Downloaded 12 times

![APP/ 14
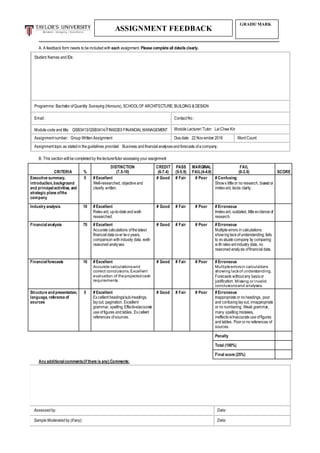
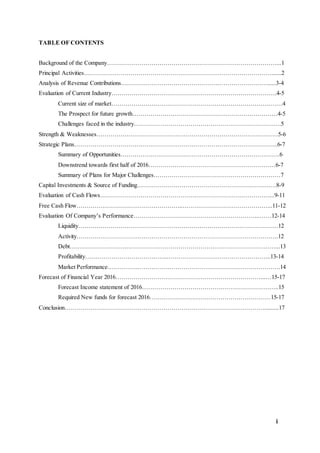
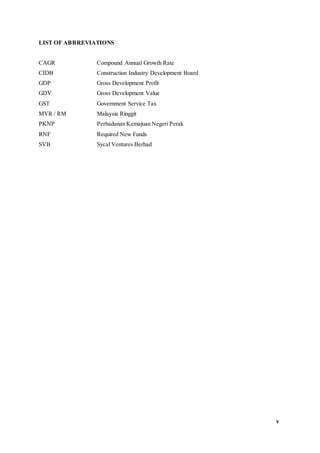
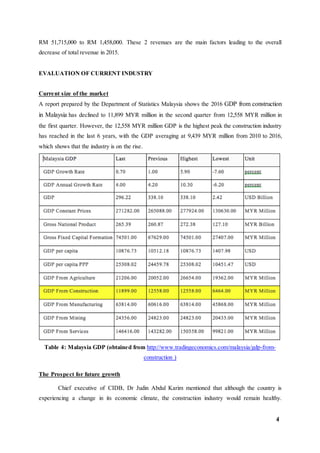
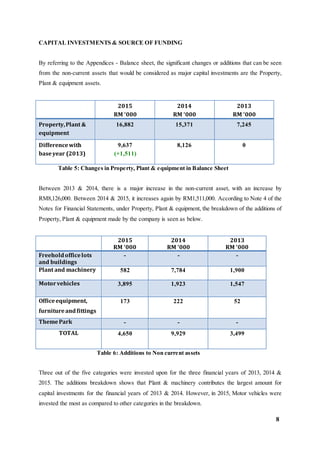
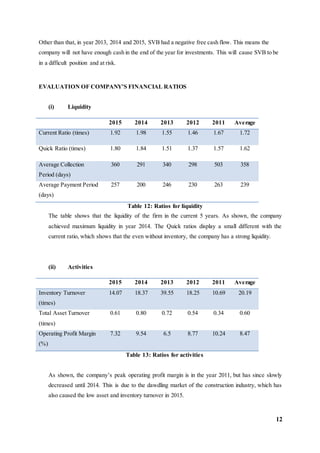
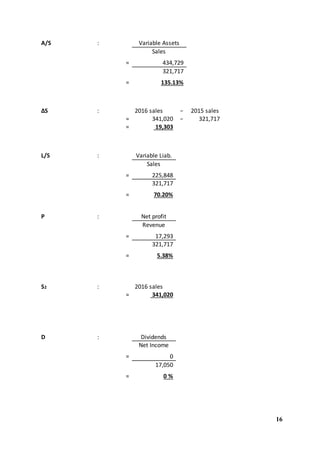
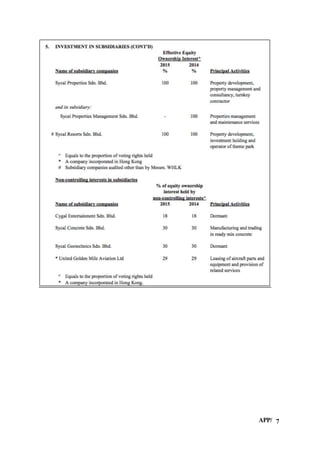
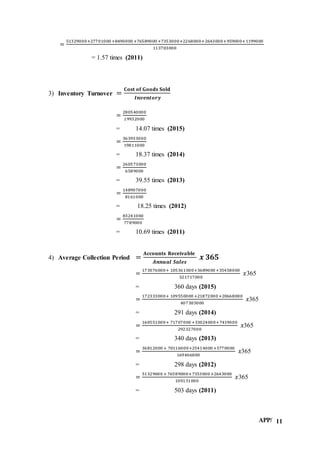
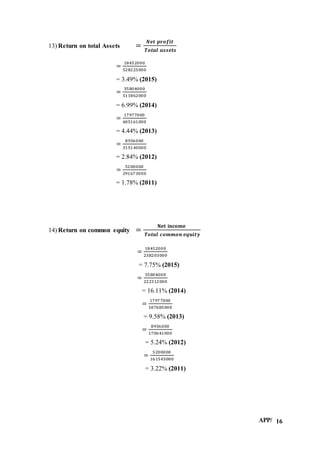
9) Fixed Payment coverage ratio =
𝐎𝐩𝐞𝐫𝐚𝐭𝐢𝐧𝐠 𝐏𝐫𝐨𝐟𝐢𝐭+𝐋𝐞𝐚𝐬𝐞 𝐏𝐚𝐲𝐦𝐞𝐧𝐭𝐬
𝑰𝒏𝒕𝒆𝒓𝒆𝒔𝒕+𝐋𝐞𝐚𝐬𝐞 𝐏𝐚𝐲𝐦𝐞𝐧𝐭𝐬+{( 𝐏𝐫𝐢𝐧𝐜𝐢𝐩𝐚𝐥 𝐩𝐚𝐲𝐦𝐞𝐧𝐭𝐬+𝐏𝐫𝐞𝐟𝐞𝐫𝐫𝐞𝐝 𝐬𝐭𝐨𝐜𝐤 𝐝𝐢𝐯𝐢𝐝𝐞𝐧𝐝𝐬) 𝒙 [
𝟏
𝟏−𝑻
]}
=
30,187,000
13 ,621 ,333 .33
= 2.22x (2015)
=
38,930 ,000
6,548 ,594.67
= 5.94x (2014)
=
22,168 ,000
6,461 ,666.67
= 3.43x (2013)
=
15 ,616 ,000
9,283,000
= 1.68x (2012)
=
9,667 ,000
3,321 ,333.33
= 2.91x (2011)
10) Gross Profit Margin =
𝐆𝐫𝐨𝐬𝐬 𝐏𝐫𝐨𝐟𝐢𝐭
𝑺𝒂𝒍𝒆𝒔
=
41,177 ,000
321,717,000
= 12.80% (2015)
=
43,450 ,000
407,383,000
= 10.67% (2014)
=
31,754 ,000
292 ,327 ,000
= 10.86% (2013)
=
20,499,000
169,406 ,000
= 12.10% (2012)
=
16 ,890,000
87 ,322 ,000
= 19.34% (2011)](https://image.slidesharecdn.com/compiledfmassignmentcomplete-161205065744/85/Compiled-fm-assignment-complete-40-320.jpg)
![APP/ 20
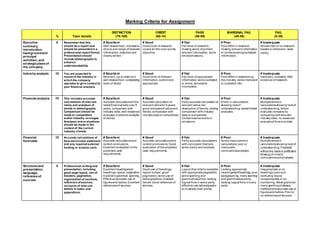
REFERENCES
Bonescythe, (2015). Sycal - Cycling North. [Blog] Bonescythe Stock Watch. Available at:
http://bonescythe.blogspot.com/2015_02_01_archive.html [Accessed 22 Nov. 2016].
Bonescythe, (2015). Sycal - Venture Higher. [Blog] Bonescythe Stock Watch. Available at:
http://bonescythe.blogspot.com/2015/07/sycal-venture-higher.html [Accessed 22 Nov. 2016].
Bonescythe, (2015). SYCAL (9717) - Sycal - Point of Perak. [online] Sharetisfy.com. Available at:
http://www.sharetisfy.com/2016/07/sycal-9717-sycal-point-of-perak.html [Accessed 22 Nov.
2016].
Corporateinformation.com, (2016). Sycal VenturesBerhad (SYCAL) Company Profile -
CorporateInformation.com. [online] Corporateinformation.com. Available at:
http://www.corporateinformation.com/Company-Snapshot.aspx?cusip=C458G7930
[Accessed 22 Nov. 2016].
Investor.com, (2016). SYCAL: Business Background | I3investor. [online] Klse.i3investor.com.
Available at: http://klse.i3investor.com/servlets/stk/bizbg/9717.jsp [Accessed 22 Nov. 2016].
ITE Build&Interiors, (2015). The future of Malaysia's construction industry. [Blog] ITE
Build&Interiors.Available at: http://www.buildingshows.com/market-insights/malaysia/the-
future-of-malaysia-s-construction-industry-/801800611 [Accessed 22 Nov. 2016].
Mohd Danuri, M., Che Munaaim, M., Abdul Rahman, H. and Hanid, M. (n.d.). Late And Non-
Payment Issues In The Malaysian Construction Industry – Contractors’Perspective.Ph.D.
University of Malaya.
Puredecisions.com, (n.d.). Tactical & Strategic Report on Sycal Ventures. [online] Puredecisions.com.
Available at: http://www.puredecisions.com/PureData/Malaysia/sycal-ventures.html
[Accessed 22 Nov. 2016].
Puspadevi, S. (2015). Obstacles to construction growth. The Star Online. [online] Available at:
http://www.thestar.com.my/business/business-news/2015/01/02/obstacles-to-construction-
growth-low-oil-price-tight-fiscal-measures-and-gst-may-limit-the-sectors-e/ [Accessed 22
Nov. 2016].
Ratings, R. (2016). Malaysia's construction sector to keep growing. The Star Online. [online]
Available at: http://www.thestar.com.my/business/business-news/2016/06/13/construction-
sector-to-keep-growing/ [Accessed 22 Nov. 2016].
Tradingeconomics.com, (2016). Malaysia GDP FromConstruction | 2010-2016. [online]
Tradingeconomics.com. Available at: http://www.tradingeconomics.com/malaysia/gdp-from-
construction [Accessed 22 Nov. 2016].
Tradesignum.com, (2016). SYCAL - SYCAL VENTURES BHD | tradeSignum. [online]
Tradesignum.com. Available at: http://www.tradesignum.com/company/sycal [Accessed 22
Nov. 2016].
Sharetisfy.com, (2016). SYCAL (9717) - Sycal - Finally Coming Out Of Its Shadows. [online]
Sharetisfy.com. Available at: http://www.sharetisfy.com/2015/04/sycal-9717-sycal-finally-
coming-out-of.html [Accessed 22 Nov. 2016].](https://image.slidesharecdn.com/compiledfmassignmentcomplete-161205065744/85/Compiled-fm-assignment-complete-46-320.jpg)
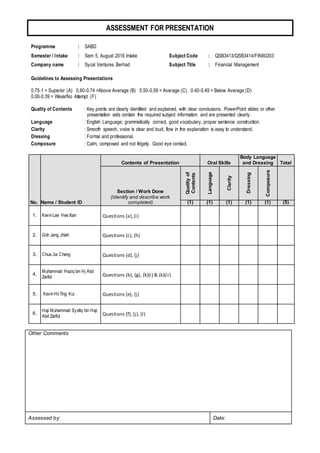
![APP/ 21
Sycal Berhad, (2016). Sycal Ventures Berhad - Construction & Infrastructure. [online]
Sycalberhad.com. Available at: http://www.sycalberhad.com/sycal-ventures-berhad---
construction---infrastructure.html [Accessed 22 Nov. 2016].
Sycal Berhad, (2016). Sycal Berhad - Overview.[online] Sycalberhad.com. Available at:
http://www.sycalberhad.com/overview.htm [Accessed 22 Nov. 2016].
Worldwide Company Profile. (2016). SYCAL VENTURES BERHAD. [online] Available at:
http://listofcompanies.co.in/2012/03/18/sycal-ventures-berhad/ [Accessed 22 Nov. 2016].
Wall Street Journal, (2016). SYCAL.MY Company Profile & Executives - Sycal Ventures Bhd - Wall
Street Journal. [online] Quotes.wsj.com. Available at:
http://quotes.wsj.com/MY/SYCAL/company-people [Accessed 22 Nov. 2016].](https://image.slidesharecdn.com/compiledfmassignmentcomplete-161205065744/85/Compiled-fm-assignment-complete-47-320.jpg)

Here are the principal activities of the subsidiaries of Sycal Ventures Berhad: Table 2: List of subsidiaries & respective principal activities Subsidiary Principal Activity Sycal Construction Sdn Bhd Building construction and civil engineering works Sycal Properties Sdn Bhd Property development Sycal Industries Sdn Bhd Manufacturing and trading of ready-mixed concrete, concrete products and quarry products Sycal Hong Kong Limited Building construction and civil engineering works (Operates in Hong Kong) Sycal Land Sdn Bhd Property development Sycal Quarry Sdn Bhd Quarrying of granite and production of quarry by-products Sycal Marketing Sdn


![Chapter 2 [compatibility mode]](https://cdn.slidesharecdn.com/ss_thumbnails/chapter2compatibilitymode-170825100839-thumbnail.jpg?width=640&height=640&fit=bounds)


