This document provides background information on KEN Holdings Sdn Bhd, a Malaysia-based public investment holding company with two main segments - construction and property development. It details the company's founder, headquarters, subsidiaries, vision, missions and an analysis of its shareholding structure. The principal activities of the company and its subsidiaries are also outlined, including property development, specialist engineering services, and construction works. Financial information on the revenue contributions of different segments for years 2015-2017 is also presented.
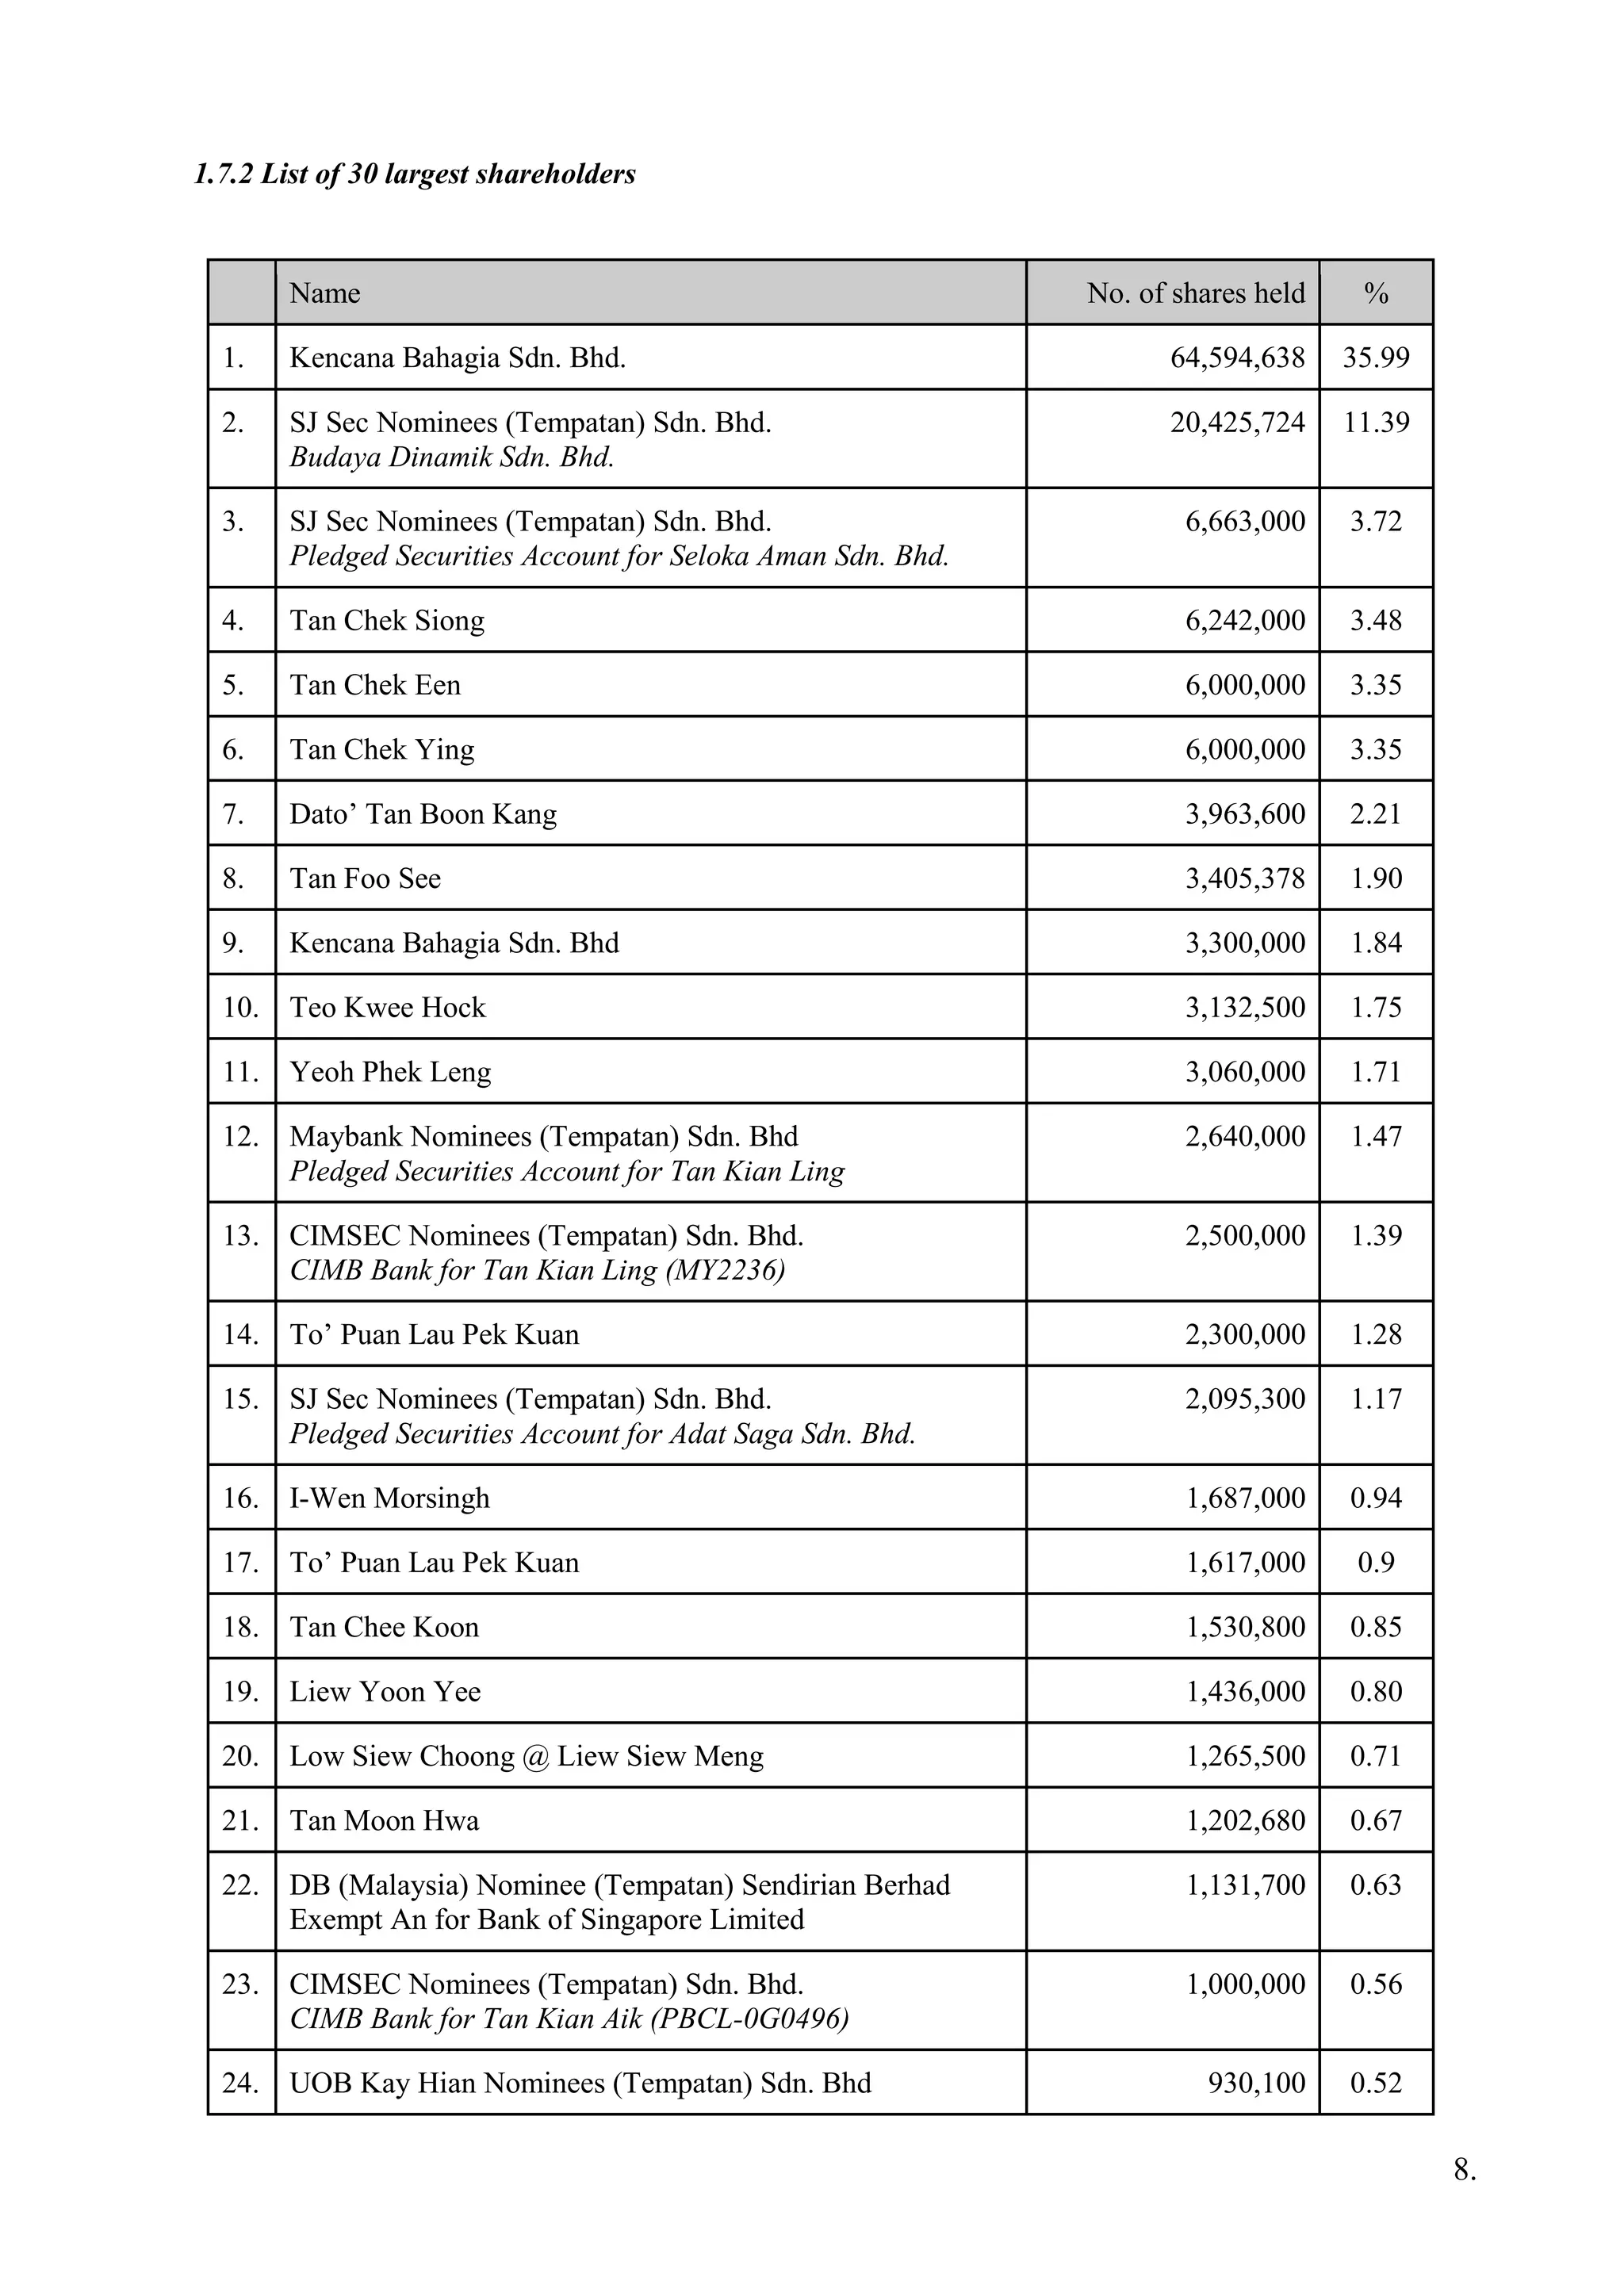
![1.7.3 Substantial Shareholders
Name of substantial shareholders No. of ordinary shares
Direct % Indirect %
1. Kencana Bahagia Sdn. Bhd. 67,849,638 37.83 - -
2. Dato’ Tan Boon Kang 3,963,600 2.21 83,766,638[1] 46.71
3. To’ Puan Lau Pek Kuan 3,917,000 2.18 83,813,238[1] 46.73
4. Anton Syazi bin Ahmad Sebi - - 20,425,724[2] 11.39
5. Aryati Sasya binti Ahmad Sebi - - 20,425,724[2] 11.39
6. Budaya Dinamik Sdn. Bhd. 20,425,724 11.39 - -
1.7.4 Statement of Directors’ Shareholdings
Directors’ name No. of ordinary shares
Direct % Indirect %
1. Dato’ Tan Boon Kang 3,963,300 2.21 83,766,638[1] 46.71
2. Tan Chek Siong 6,242,000 3.48 - -
3. Tan Moon Hwa 1,202,680 0.67 - -
4. YAM Dato’ Seri Syed Azni Ibni
Almarhum Tuanku Syed Putra Jamalullail
- - - -
5. Dato’ Ir. Dr. Ashaari bin Mohamad - - - -
6. Sha Thiam Lu - - - -
Notes :
[1] Deemed interested by virtue of his / her substantial shareholdings in kencana Bahagia Sdn. Bhd. and
shareholdings of his / her spouse and children in the Company.
[2] Deemed interested by virtue of his / her substantial shareholdings in Budata Dinamik Sdb. Bhd.
10.](https://image.slidesharecdn.com/fmassignment-finalreport-181215042206/75/Fm-assignment-final-report-15-2048.jpg)
![7.0 Company’s Major Capital Investments & Major Sources of Funding
7.1 Major Capital Investments
Capital investment is defined as the funds invested in a company for the purpose of furthering
or achieving its business objectives. Capital investment may also refer to a company’s acquisition of
capital assets or fixed assets that are expected to be productive over many years. KEN Holdings uses its
capital to invest in different types of long and short-term investment such as property, plant and
equipment.
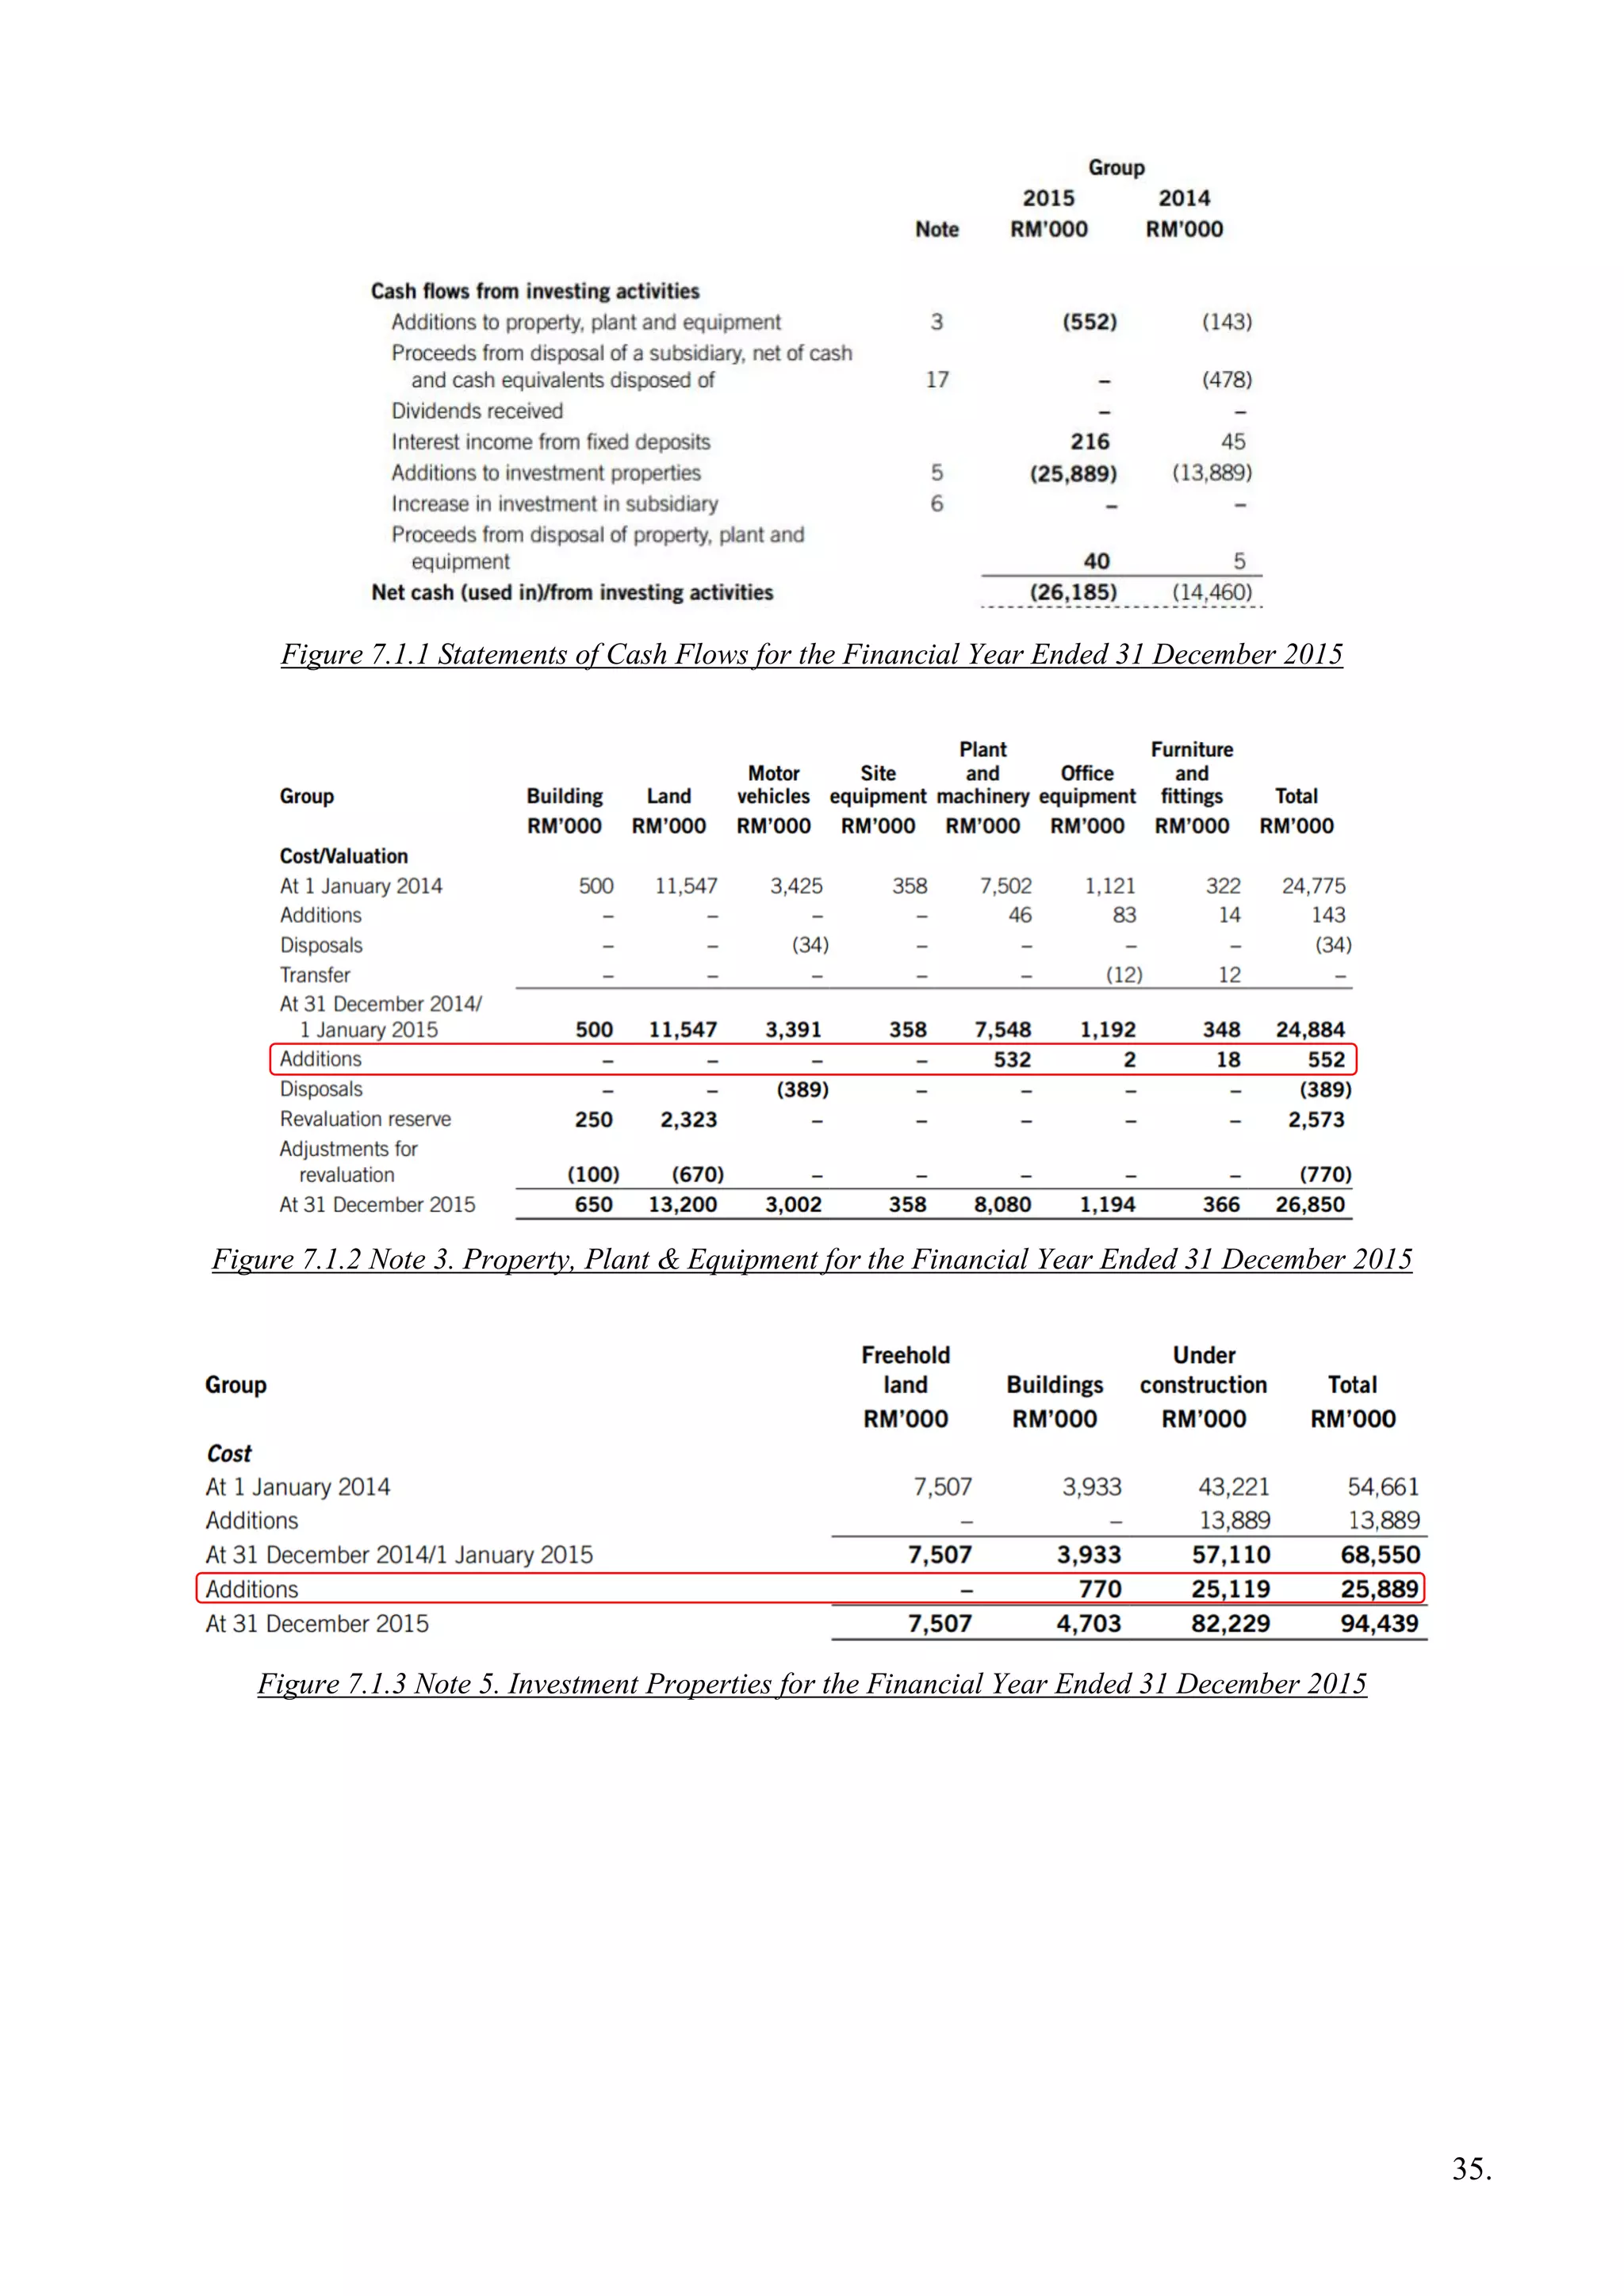
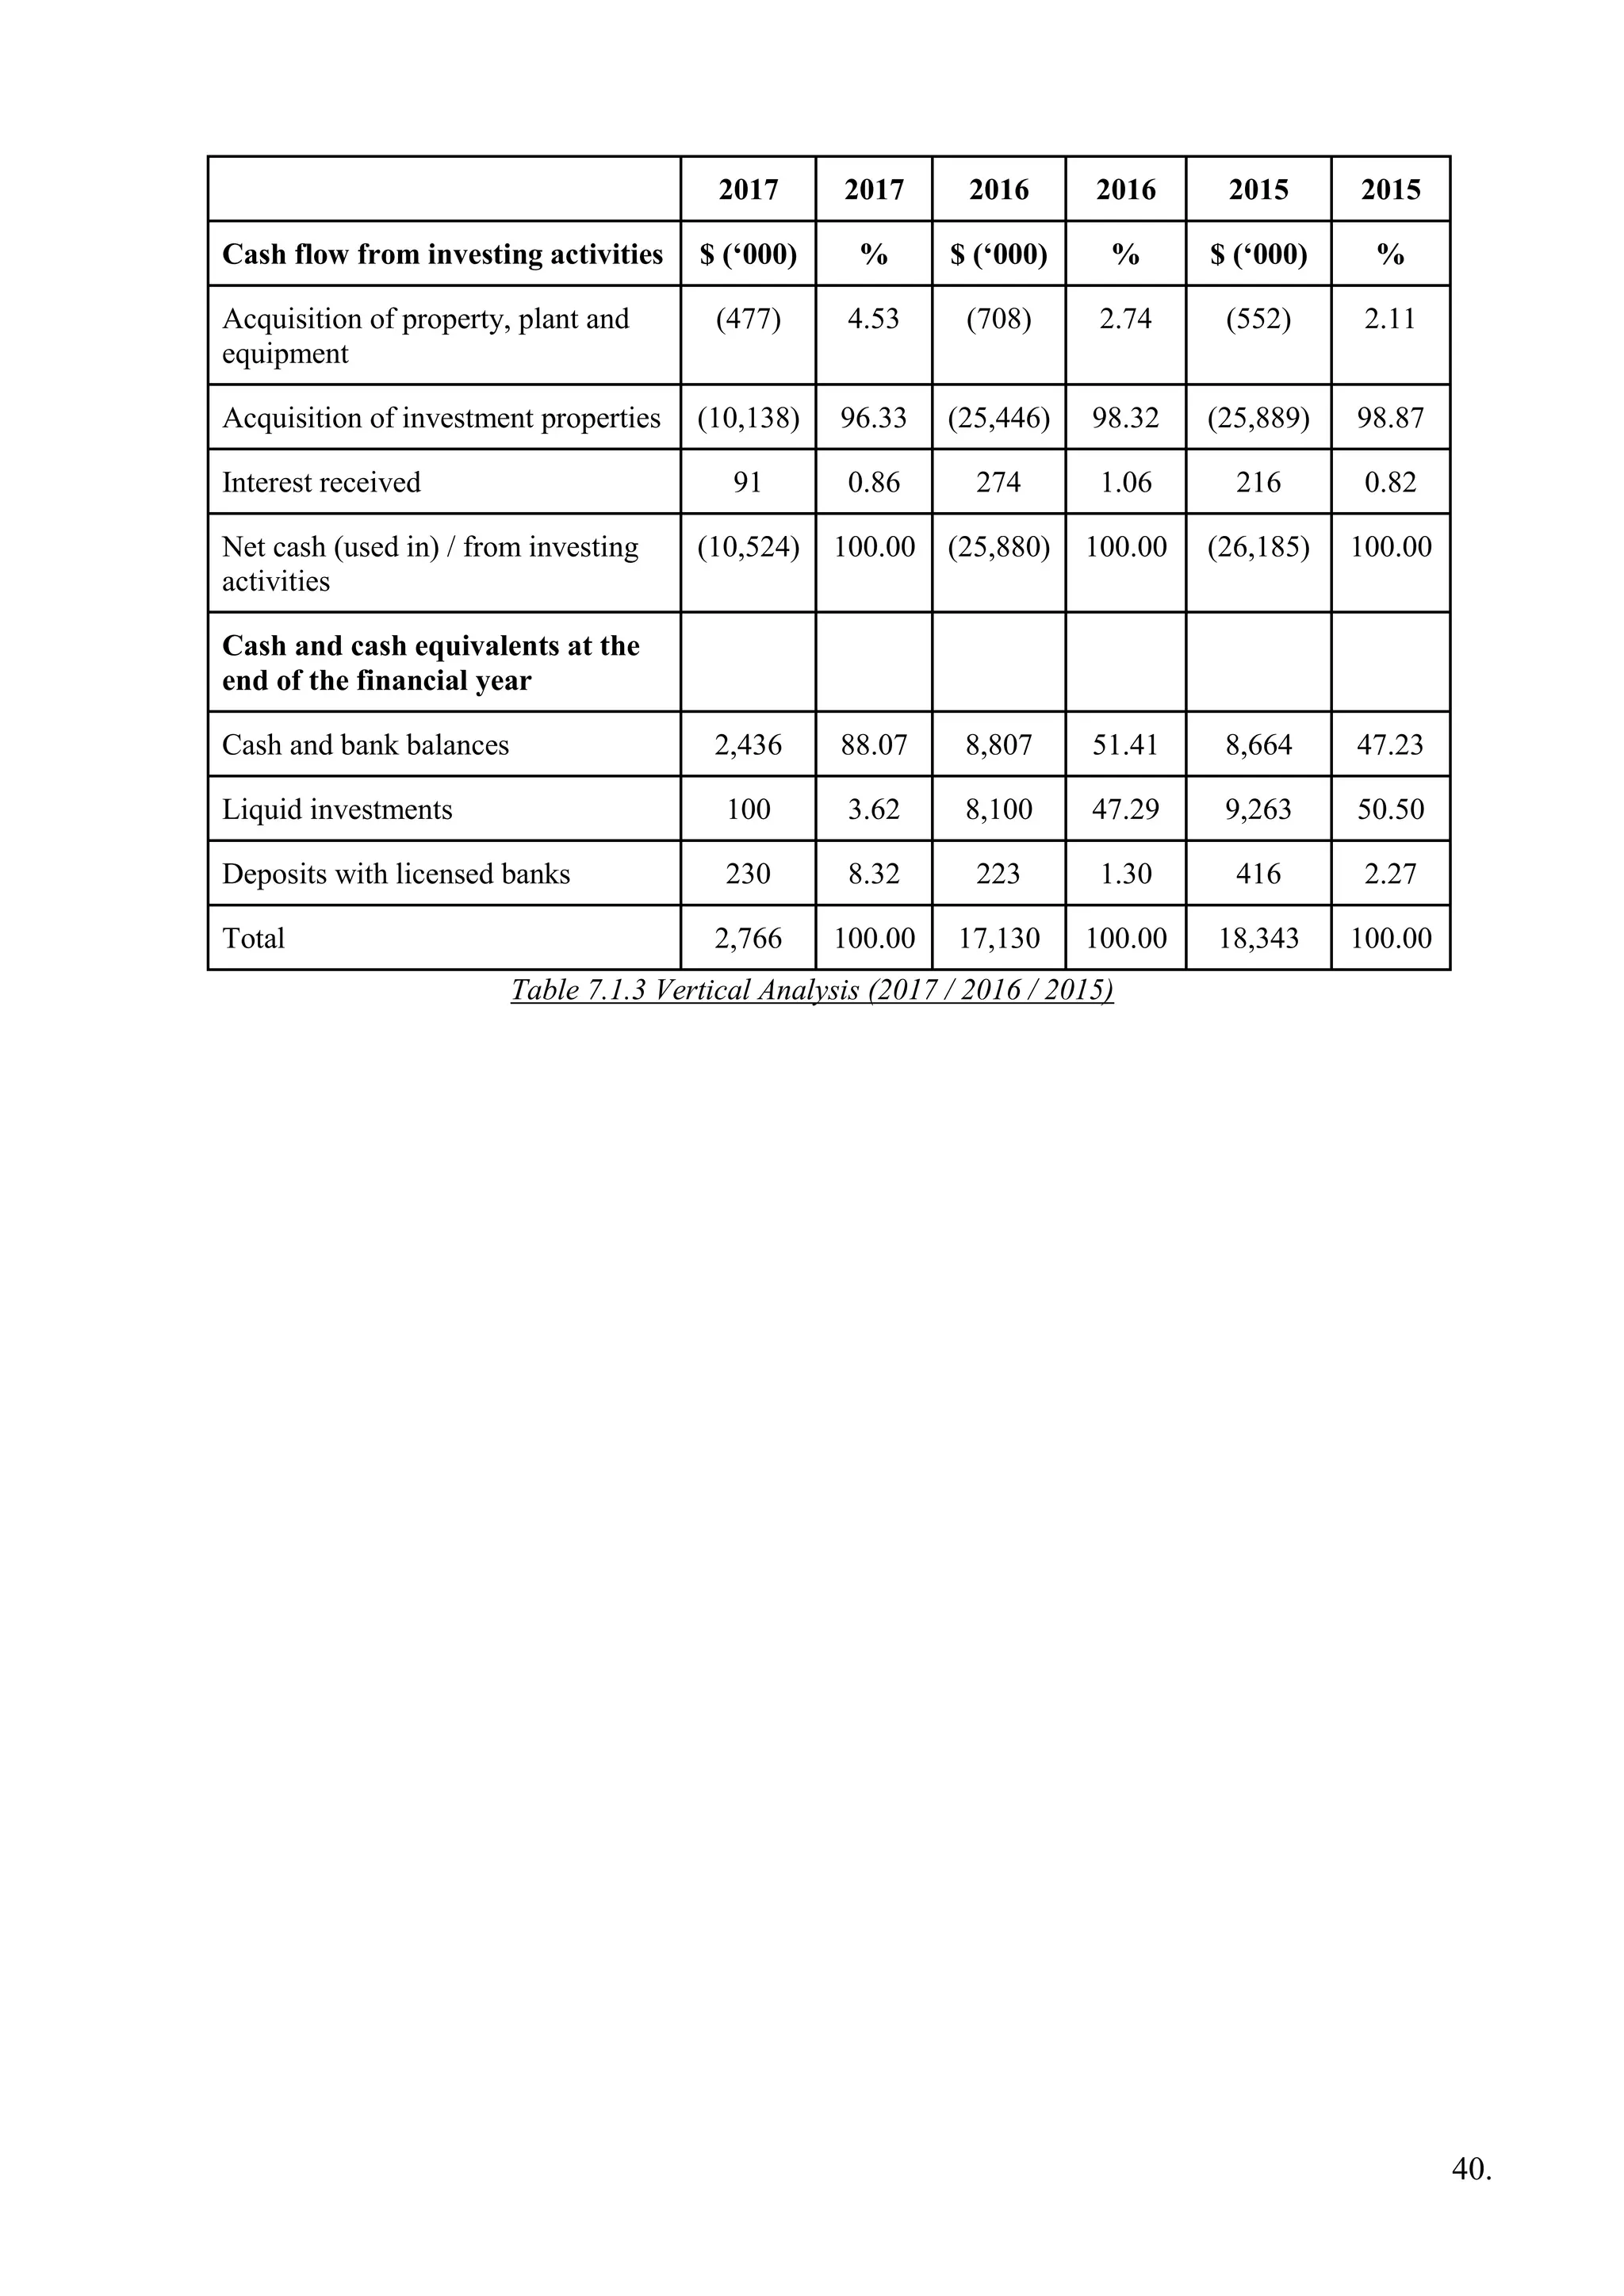
In the year 2015, KEN Holdings has purchased RM 552,000 of property, plant and equipment
which included plant and machinery, office equipment, and furniture and fittings. Besides that, KEN
Holdings has invested RM 25,889,000 in the building and under construction project [Figure 7.1.1].
There is a significant ratio difference between 2 types of long-term investment undertaken by KEN
Holdings. there is only 2.11% of capital investment has been allocated in property, plant and equipment
whereas 98.87% have been used in properties investment [Table 7.1.3]. Thus, it is obvious that KEN
Holdings is greatly emphasized on property investment in the year 2015.
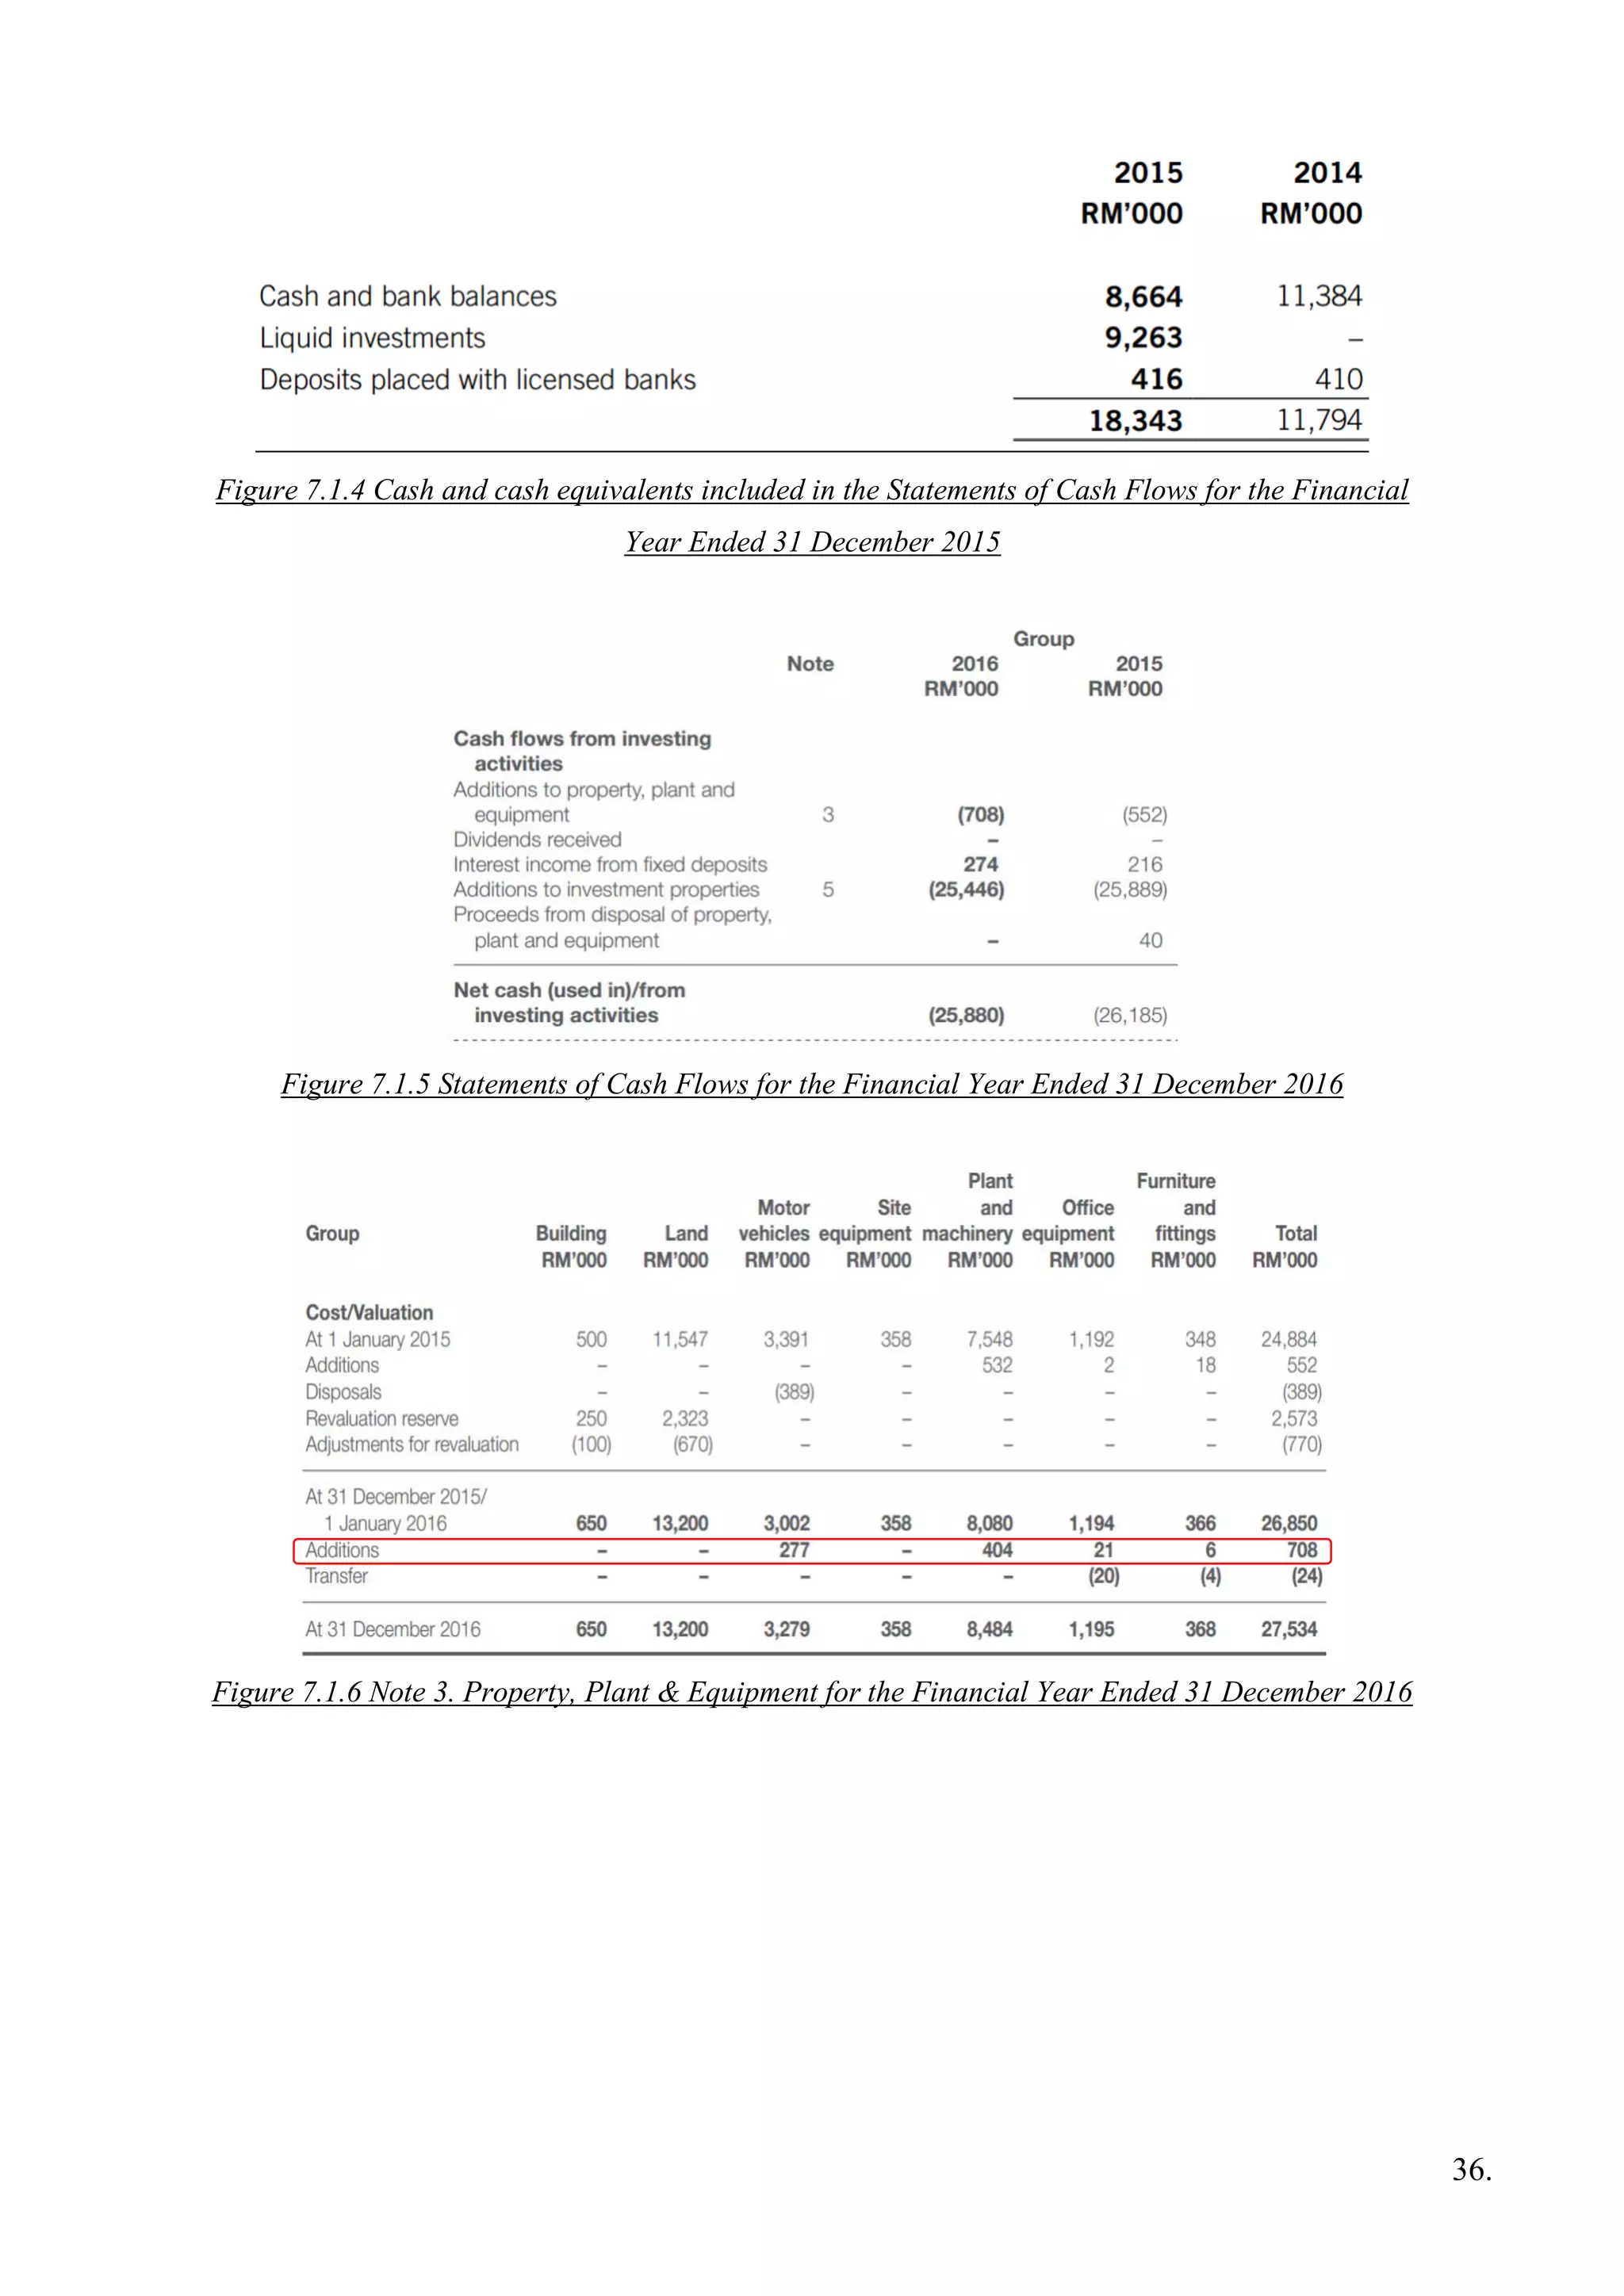
This company also has short-term investments such as liquid investment and deposits placed
with licensed banks in the year 2015 with the amount of RM 9,263,000 and RM416,000 respectively
[Figure 7.1.4]. The major short-term investment undertaken by the company is the liquid investments
which consist of 50.50% whereas the deposits with licensed banks only consist of 2.27% of the cash and
cash equivalent [Table 7.1.3]. The company’s cash and cash equivalents shows that they have no
undertaken liquid investments in the year 2014. The reason they highly invest in the liquid investment
in the year 2015 is that this investment can bring the readily convertible to known amounts of cash and
which are subject to an insignificant risk of changes in value.
In the year 2016, KEN Holdings has purchased RM 708,000 of property, plant and equipment
which comprised of motor vehicles, plant and machinery, office equipment, and furniture and fittings.
Besides that, KEN Holdings placed RM 25,446,000 as their investment in the properties which is the
under construction project this year [Figure 7.1.5]. Same as the year 2015, the ratio of the funds allocated
between the 2 types of long-term investment has a significant difference which is 2.74% in property,
plant and equipment and 98.32% in the investment in property [Table 7.1.3]. Therefore, KEN Holdings
is also invested its majority of the funds in the property investment in the year 2016. This company also
has the short-term investments same as the year 2015 but with a lower amount which is the liquid
investment of RM 8,100,000 and deposits placed with licensed banks of RM 223,000 [Figure 7.1.8].
The major short-term investment undertaken by the company is the liquid investments which consist of
47.29% whereas the deposits with licensed banks only consist of 1.30% [Table 7.1.3].
33.](https://image.slidesharecdn.com/fmassignment-finalreport-181215042206/75/Fm-assignment-final-report-38-2048.jpg)
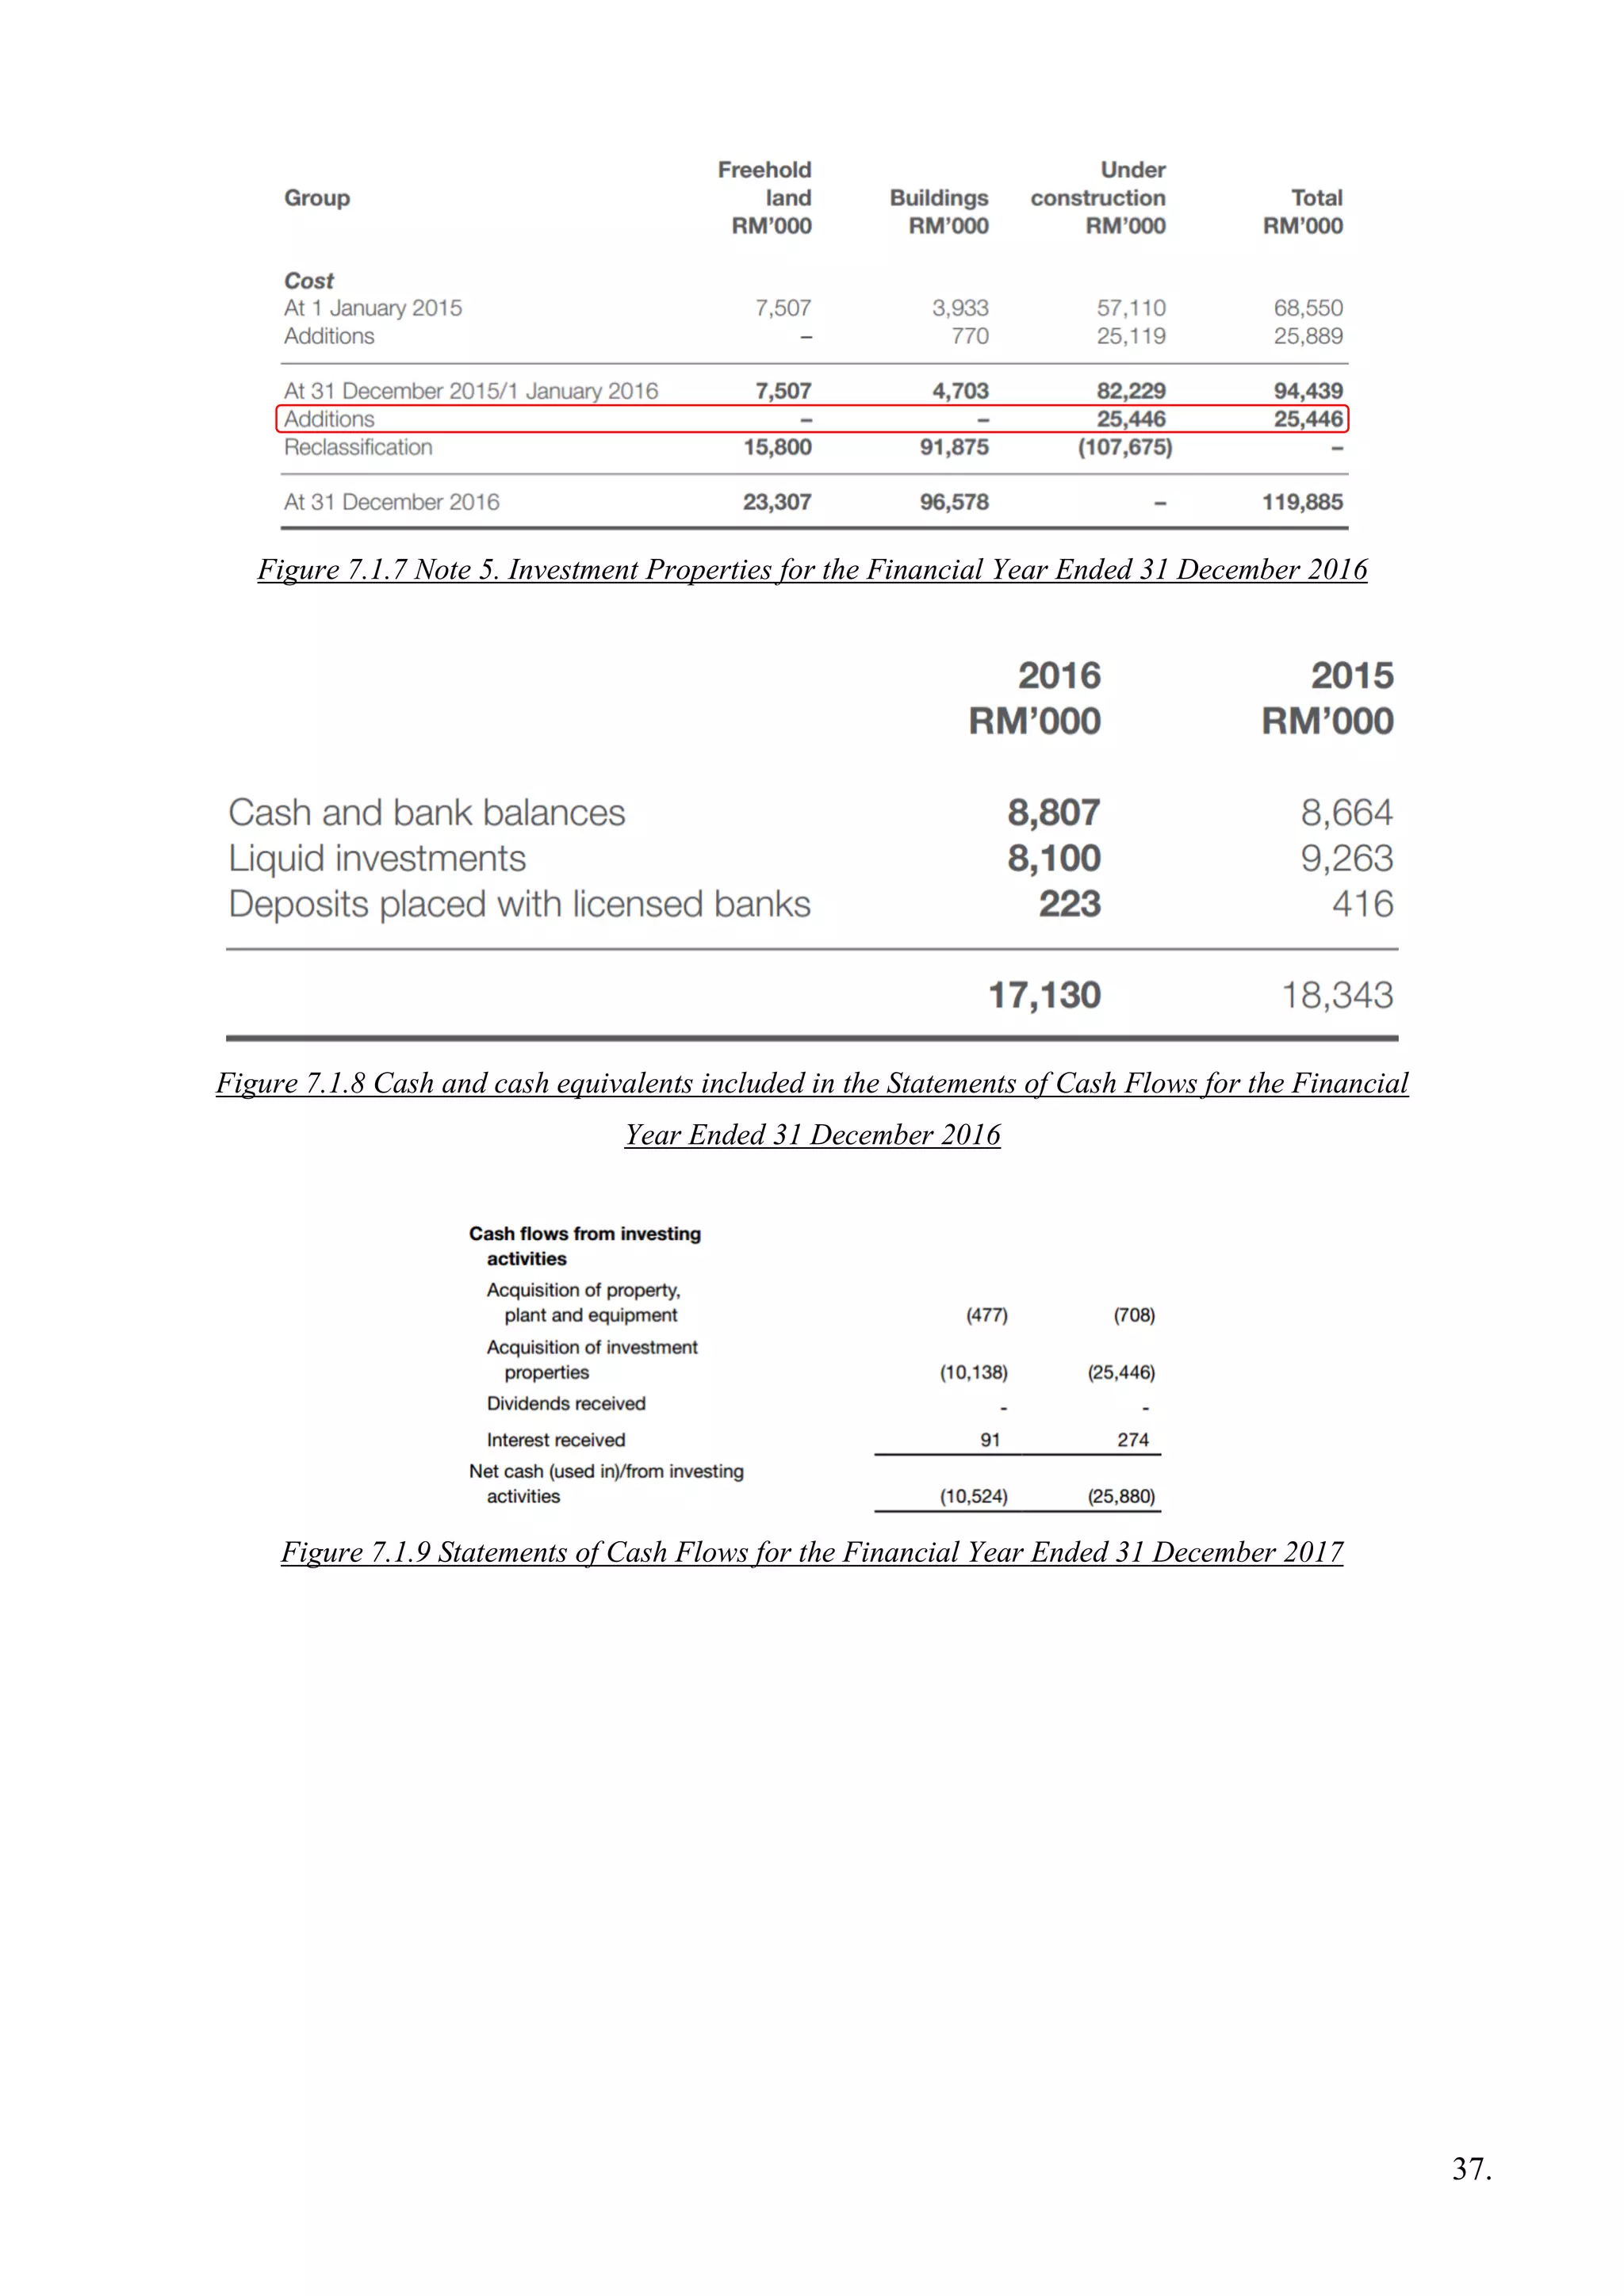
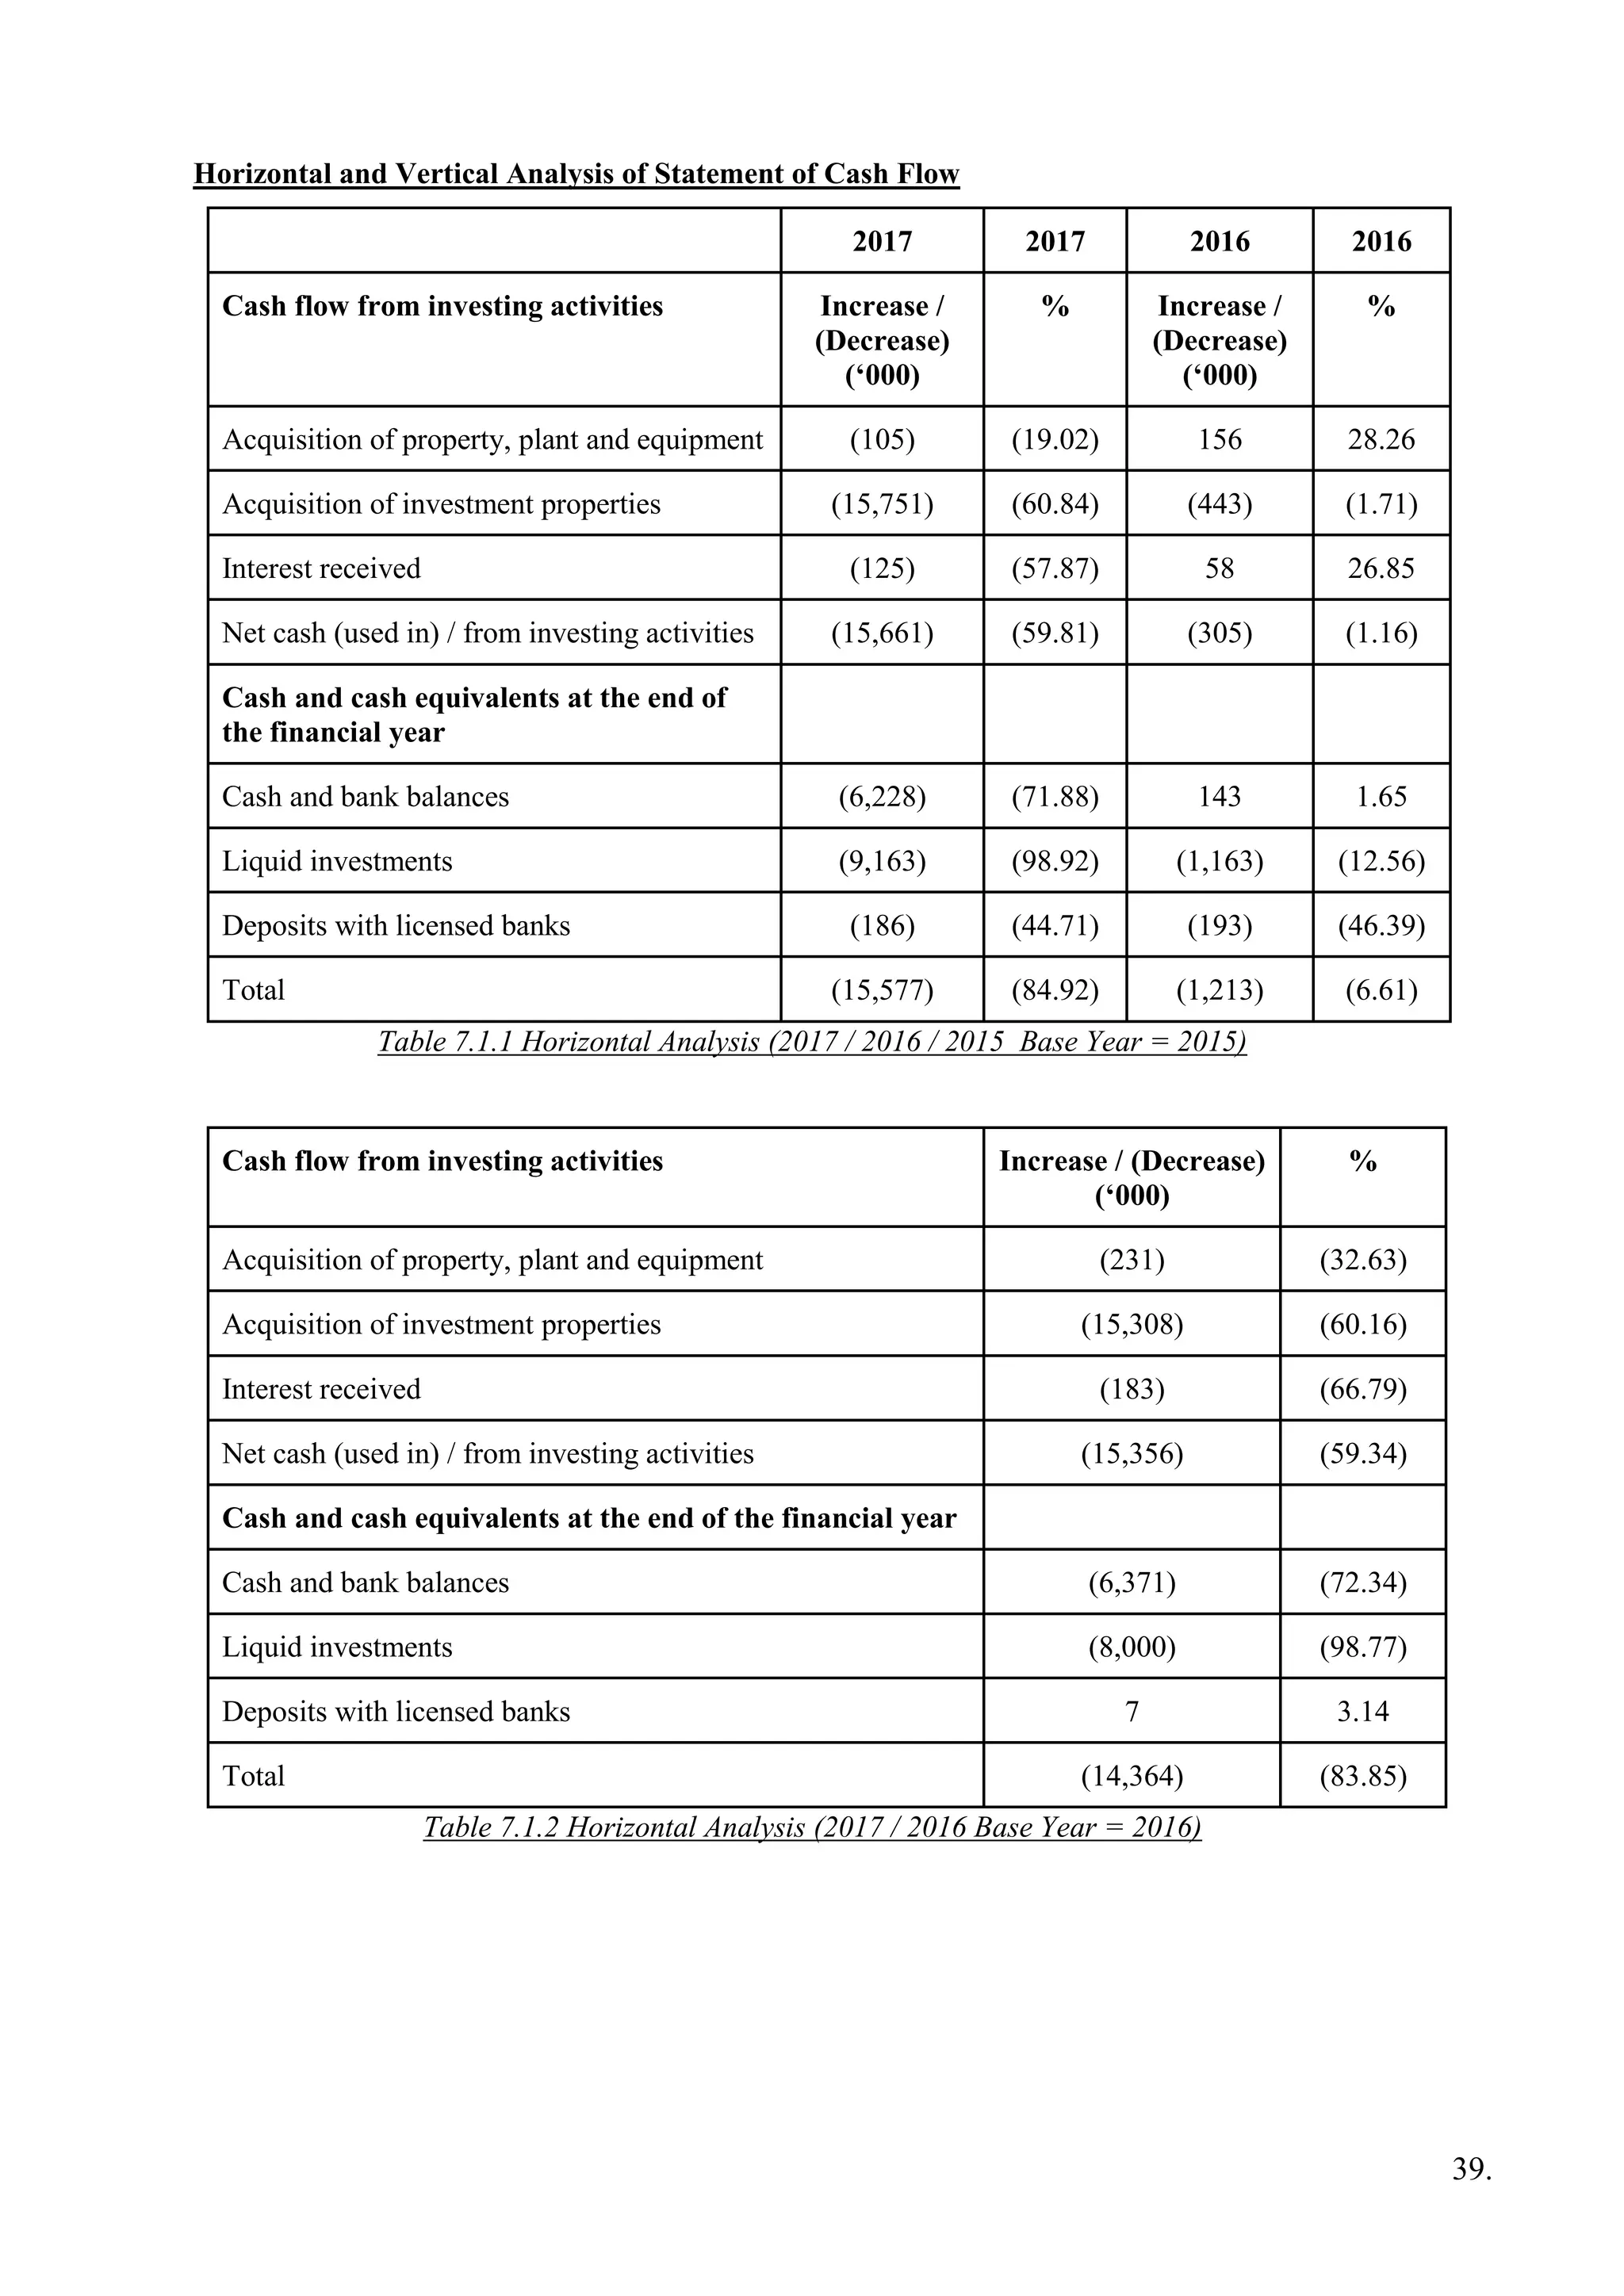
![Refer to the Table 7.1.1, as compared to the year 2015, KEN Holdings has the allocated more
funds in the property, plant and equipment which is an increase of 28.26%, but a decrease of 1.71% in
the properties investment. Besides that, the total amount that the company allocated in the investment
activities is decreased by 1.16% from year 2015 to 2016. Even though the cash and bank balances of the
company is increased by 1.65%, but there is a drop in the liquid investment and deposits with licensed
banks which are 12.56% and 46.39% respectively.
In the year 2017, KEN Holdings has spent RM 447,000 to purchase the office equipment and
furniture and fittings which contributed 4.53% of the annual investment activities. Besides that, KEN
Holdings has invested 96.33% of its capital which is RM 10,138,000 in the properties [Figure 7.1.9,
Table 7.1.3]. The liquid investments in this year are relatively lower than the previous two year which
only consists of 3.62% of the total cash and cash equivalent with the amount of RM 100,000. The
deposits with licensed banks is RM 230,000 in this year and the effective interest rates and maturity
period of the deposits of this company as at the end of the reporting period is 3.15% (2016: 3.15%) per
annum [Figure 7.1.12, Table 7.1.3].
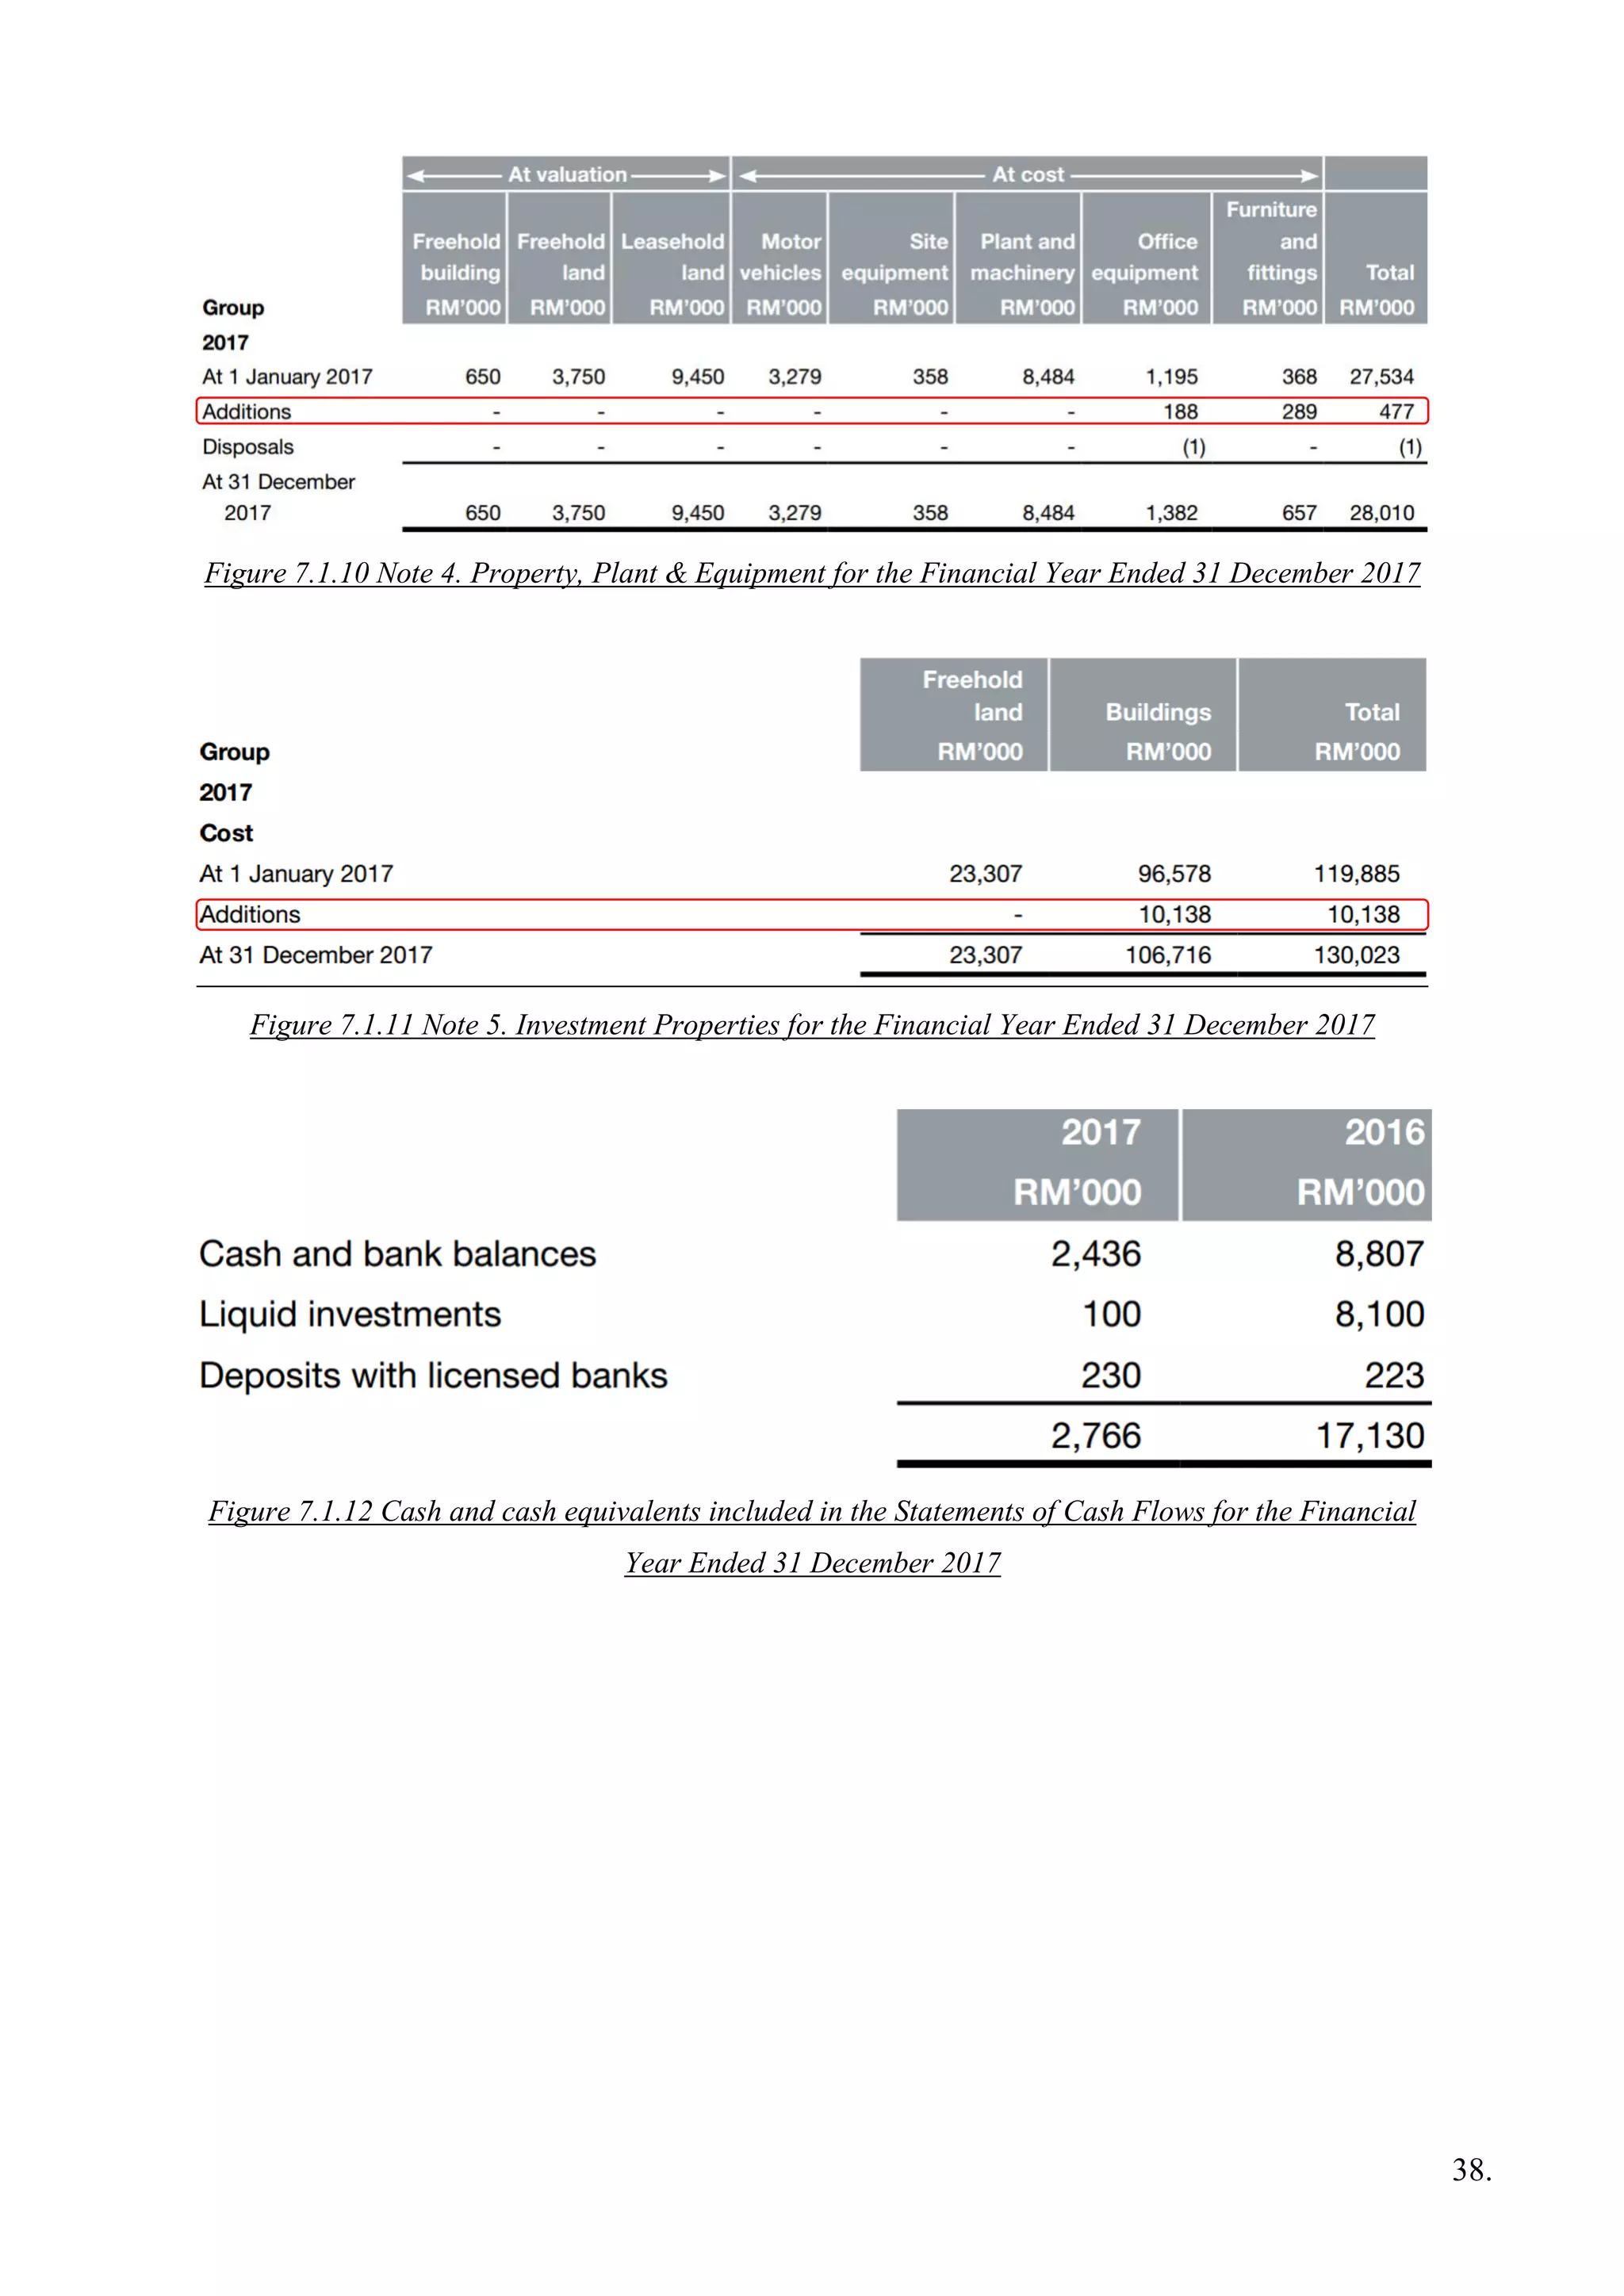
From the statement of cash flow, we can observe that KEN Holdings placed its funds into the
investment of properties are gradually decrease each year. Refer to Table 7.1.1, in the year 2017 as
compared to the year 2015, the funds allocated in the purchasing of the property, plant and equipment
is reduced 19.02% and the properties investment is dropped 60.84%. Not only the funding of the
investment is declined, the cash and cash equivalents has a significant decrease which is 84.92% in the
year 2017 as compared to year 2015.
Table 7.1.2 shows that there is a 32.63% of the decline in the acquisition of property, plant and
equipment in the year 2017 as compared to 2016 which is higher than when compared to the year 2015,
and the acquisition of investment properties is decreased 60.16%. Not only decreased in the funds
allocated to the investment, but the liquid investment is also decreased 98.77% while the deposits with
licensed banks is increased by 3.14%. Net cash used in investing activities reduced by 59.34% from the
year 2016 to 2017 which is RM10.5 million in the year 2017 and RM25.9 million in the year 2016. This
is mainly due to the completion of the company’s corporate office tower, Menara KEN TTDI in 2016.
34.](https://image.slidesharecdn.com/fmassignment-finalreport-181215042206/75/Fm-assignment-final-report-39-2048.jpg)