Downloaded 94 times

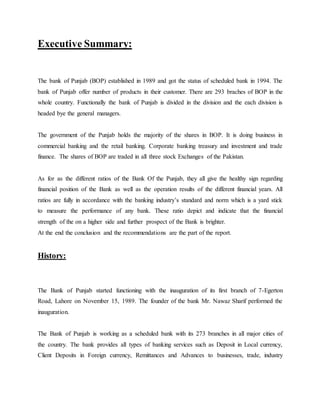
![ Political
Environmental
People
The people category can be subdivided into risks associated with the people. Examples of people
risks include the risk of not finding the skills needed to execute the project or the sudden
unavailability of key people on the project. David Hillson[1] uses the same framework as the
work breakdown structure (WBS) for developing a risk breakdown structure (RBS). A risk
breakdown structure organizes the risks that have been identified into categories using a table
with increasing levels of detail to the right.
The result is a clearer understanding of where risks are most concentrated. Hillson’s approach
helps the project team identify known risks, but can be restrictive and less creative in identifying
unknown risks and risks not easily found inside the work breakdown structure](https://image.slidesharecdn.com/riskmanagementofbop-160123155718/85/Financial-Analysis-of-BOP-5-320.jpg)
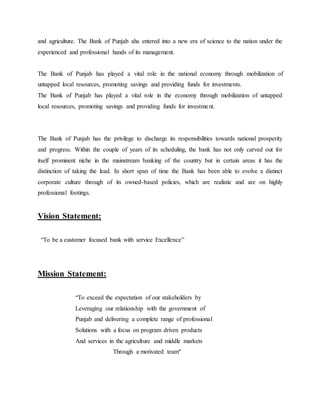
![technology manager typically needs to meet project goals, and each of those resources could face
unexpected problems.
Risk evaluation often occurs in a workshop setting. Building on the identification of the risks,
each risk event is analyzed to determine the likelihood of occurring and the potential cost if it did
occur. The likelihood and impact are both rated as high, medium, or low. A risk mitigation plan
addresses the items that have high ratings on both factors—likelihood and impact.
A project team analyzed the risk of some important equipment not arriving to the project on
time. The team identified three pieces of equipment that were critical to the project and would
significantly increase the costs of the project if they were late in arriving. One of the vendors,
who was selected to deliver an important piece of equipment, had a history of being late on other
projects. The vendor was good and often took on more work than it could deliver on time. This
risk event (the identified equipment arriving late) was rated as high likelihood with a high
impact. The other two pieces of equipment were potentially a high impact on the project but with
a low probability of occurring.
Not all project managers conduct a formal risk assessment on the project. One reason, as found
by David Parker and Alison Mobey[2] in their phenomenological study of project managers, was
a low understanding of the tools and benefits of a structured analysis of project risks. The lack of
formal risk management tools was also seen as a barrier to implementing a risk management
program. Additionally, the project manager’s personality and management style play into risk
preparation levels. Some project managers are more proactive and will develop elaborate risk
management programs for their projects. Other managers are reactive and are more confident in
their ability to handle unexpected events when they occur. Yet others are risk averse, and prefer
to be optimistic and not consider risks or avoid taking risks whenever possible.
On projects with a low complexity profile, the project manager may informally track items that
may be considered risk items. On more complex projects, the project management team may
develop a list of items perceived to be higher risk and track them during project reviews. On
projects with greater complexity, the process for evaluating risk is more formal with a risk
assessment meeting or series of meetings during the life of the project to assess risks at different
phases of the project. On highly complex projects, an outside expert may be included in the risk](https://image.slidesharecdn.com/riskmanagementofbop-160123155718/85/Financial-Analysis-of-BOP-7-320.jpg)

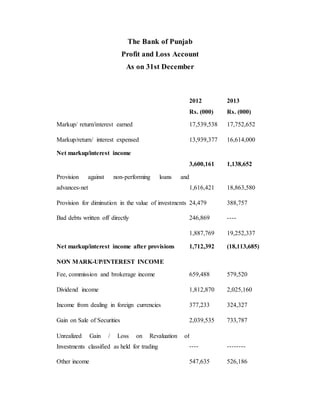
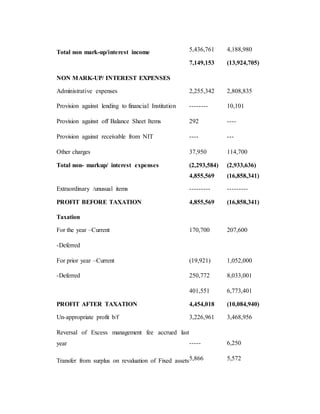

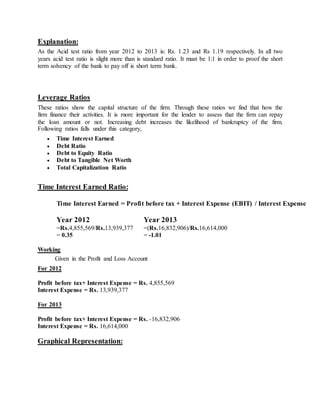
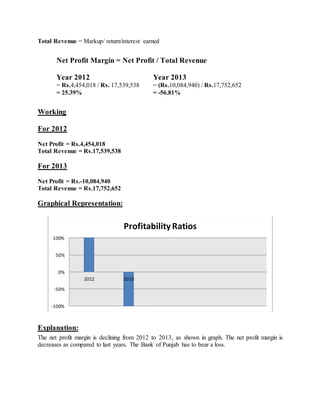
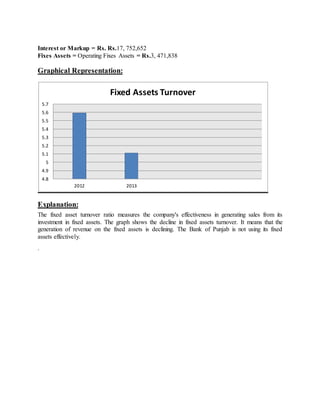

The Bank of Punjab reported a net loss in 2013 due to higher provisioning against non-performing loans and investments. Provisions against bad debts increased significantly to Rs. 18.86 billion in 2013 from Rs. 1.61 billion in 2012. This led to a net interest income loss of Rs. 18.11 billion in 2013 compared to a net interest income of Rs. 1.71 billion in 2012. However, non-markup income declined slightly to Rs. 4.19 billion in 2013 from Rs. 5.44 billion in 2012. Overall, higher provisioning caused the bank to report a net loss in 2013 versus a net profit in 2012.