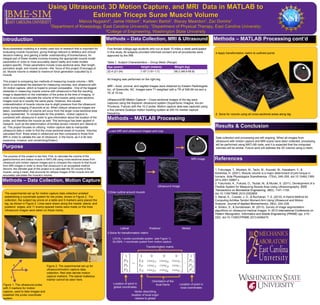
Introduction
Using Ultrasound, 3D Motion Capture, and MRI Data in MATLAB to
Estimate Triceps Surae Muscle Volume
Marcia Nygaard3, Jamie Hibbert1, Karleen Bartol2, Stacey Meardon2, Zac Domire1
1Department of Kinesiology, East Carolina University; 3Department of Physical Therapy, East Carolina University;
3College of Engineering, Washington State University
Methods – Data Collection, MRI & Ultrasound
Results & Conclusion
References
4.Apply transformation matrix to outlined points
5. Solve for volume using all cross-sectional areas along leg
Purpose
1. Fukunaga, T., Miyatani, M., Tachi, M., Kouzaki, M., Kawakami, Y., &
Kanehisa, H. (2001). Muscle volume is a major determinant of joint torque in
humans. Acta Physiologica Scandinavica, 172(4), 249–255. doi:10.1046/j.1365-
201x.2001.00867.x
2. Fukumoto, K., Fukuda, O., Tsubai, M., & Muraki, S. (2011). Development of a
Flexible System for Measuring Muscle Area Using Ultrasonography. IEEE
Transactions on Biomedical Engineering, 58(5), 1147–1155.
doi:10.1109/TBME.2010.2052809
3. Manal, K., Cowder, J. D., & Buchanan, T. S. (2010). A Hybrid Method for
Computing Achilles Tendon Moment Arm Using Ultrasound and Motion
Analysis. Journal of Applied Biomechanics, 26(2), 224–228.
4. Sridevi, S., & Sundaresan, M. (2013). Survey of image segmentation
algorithms on ultrasound medical images. In 2013 International Conference on
Pattern Recognition, Informatics and Mobile Engineering (PRIME) (pp. 215–
220). doi:10.1109/ICPRIME.2013.6496475
Musculoskeletal modeling is a widely used tool of research that is important for
evaluating muscle movement, giving findings relevant to athletics and clinical
decision-making, and gaining a better understanding of biomechanics. An
integral part of these models involves knowing the appropriate muscle model
parameters in order to most accurately depict reality and make models
subject-specific. These parameters include cross-sectional area, fiber length,
pennation angle, and muscle volume—the focus of this project (Fukunaga et
al). Muscle volume is related to maximum force generation outputted by a
muscle.
This project is comparing two methods of measuring muscle volume— MRI,
which is considered the standard for measuring volumes, and ultrasound with
3D motion capture, which is hoped to proved comparable . One of the biggest
obstacles in measuring muscle volume with ultrasound is that the resulting
image is dependent on the orientation of the probe at the time of imaging. In
order to accurately calculate the volume of the muscle using cross-sections,
images must lie in exactly the same plane. However, this causes
underestimation of muscle volume due to slight pressure from the ultrasound
probe during imaging (Fukumoto et al). When oblique ultrasound images are
taken, overestimation of volume will occur from the larger cross-sectional area
being represented. To compensate for this problem, motion capture is
combined with ultrasound in order to give information about the location of the
probe, and therefore the muscle as well. This technique has been applied in
research, such as the determination of Achilles tendon moment arm (Manal et
al). This project focuses on utilizing motion capture data to manipulate
ultrasound data in order to find the cross-sectional areas of muscles. Volumes
calculated from these areas in ultrasound are then compared to those from
MRI in order to validate the use of ultrasound in the future, as it is far less
expensive, invasive, and constricting(Sridevi).
The purpose of this project is two-fold. First, to calculate the volume of the
gastrocnemius and soleus muscle in MATLAB using cross-sectional areas from
ultrasound and motion capture images and to compare this volume to that found
from MRI images in order to show that ultrasound is an acceptable method.
Second, the ultimate goal of this project is to calculate the 3D volume of the
muscle, using a mesh, that accounts for oblique images of the muscle and still
accurately calculates the muscle’s volume.
Five female college-age students who run at least 10 miles a week participated
in this study. All subjects provided informed consent and all procedures were
approved by the IRB.
Table 1. Subject Characteristics – Group Mean (Range)
All imaging was performed on the right leg.
MRI – Axial, coronal, and sagittal images were obtained by Eastern Radiologists
Inc. of Greenville, NC. Images were T1-weighted with a TR of 549.99 ms and a
TE of 15 ms.
Ultrasound/3D Motion Capture – Cross-sectional images of the leg were
captured using the Aixplorer ultrasound system (SuperSonic Imagine, Aix-en-
Provence, France) with the 10-2 probe. Motion capture data was captured using
a five camera Qualisys motion tracking system at 240 Hz marker capture
frequency.
1.Load MRI and ultrasound images and crop
2.Draw outline around muscle
3.Solve for transformation matrix
Data collection and processing are still ongoing. When all images from
ultrasound with motion capture and MRI scans have been collected, processing
will be performed using MATLAB code, and it is expected that the computed
volumes will be similar. Future work will address the 3D volume using a mesh.
Figure 1. The ultrasound probe
with 3 markers for motion
capture, used to take images and
establish the probe coordinate
system.
The experimental set up for motion capture data collection entailed
establishing a coordinate system for the probe, shown in Figure 2. For
collection, the subject lay prone on a table and 5 markers were placed the
leg, as shown in Figure 2. Lines were drawn along the medial, lateral, and
posterior edges, and 11 evenly-spaced marks were made on the lines.
Ultrasound images were taken on these marks.
Methods – MATLAB Processing
Methods – MATLAB Processing cont’d
LOCAL = probe coordinate system (see Figure 1)
GLOBAL = coordinate system from motion capture
Location of point in
global coordinates
Vector describing
location of local origin
relative to global
Orientation of the
local frame Location of point in
local coordinates
Transformation matrix
MRI image
Ultrasound Image
x
y
z
Age (years) Height (meters) Weight (kg)
22.4 (21-24) 1.67 (1.61-1.7) 58.2 (48.5-65.8)
Figure 2. The experimental set up for
ultrasound/motion capture data
collection. Red dots denote motion
capture markers. The lateral malleolus
marker cannot be seen here.
Methods – Data Collection, Motion Capture
Lateral Posterior Medial

FinalPoster2

  • 1.
    Introduction Using Ultrasound, 3DMotion Capture, and MRI Data in MATLAB to Estimate Triceps Surae Muscle Volume Marcia Nygaard3, Jamie Hibbert1, Karleen Bartol2, Stacey Meardon2, Zac Domire1 1Department of Kinesiology, East Carolina University; 3Department of Physical Therapy, East Carolina University; 3College of Engineering, Washington State University Methods – Data Collection, MRI & Ultrasound Results & Conclusion References 4.Apply transformation matrix to outlined points 5. Solve for volume using all cross-sectional areas along leg Purpose 1. Fukunaga, T., Miyatani, M., Tachi, M., Kouzaki, M., Kawakami, Y., & Kanehisa, H. (2001). Muscle volume is a major determinant of joint torque in humans. Acta Physiologica Scandinavica, 172(4), 249–255. doi:10.1046/j.1365- 201x.2001.00867.x 2. Fukumoto, K., Fukuda, O., Tsubai, M., & Muraki, S. (2011). Development of a Flexible System for Measuring Muscle Area Using Ultrasonography. IEEE Transactions on Biomedical Engineering, 58(5), 1147–1155. doi:10.1109/TBME.2010.2052809 3. Manal, K., Cowder, J. D., & Buchanan, T. S. (2010). A Hybrid Method for Computing Achilles Tendon Moment Arm Using Ultrasound and Motion Analysis. Journal of Applied Biomechanics, 26(2), 224–228. 4. Sridevi, S., & Sundaresan, M. (2013). Survey of image segmentation algorithms on ultrasound medical images. In 2013 International Conference on Pattern Recognition, Informatics and Mobile Engineering (PRIME) (pp. 215– 220). doi:10.1109/ICPRIME.2013.6496475 Musculoskeletal modeling is a widely used tool of research that is important for evaluating muscle movement, giving findings relevant to athletics and clinical decision-making, and gaining a better understanding of biomechanics. An integral part of these models involves knowing the appropriate muscle model parameters in order to most accurately depict reality and make models subject-specific. These parameters include cross-sectional area, fiber length, pennation angle, and muscle volume—the focus of this project (Fukunaga et al). Muscle volume is related to maximum force generation outputted by a muscle. This project is comparing two methods of measuring muscle volume— MRI, which is considered the standard for measuring volumes, and ultrasound with 3D motion capture, which is hoped to proved comparable . One of the biggest obstacles in measuring muscle volume with ultrasound is that the resulting image is dependent on the orientation of the probe at the time of imaging. In order to accurately calculate the volume of the muscle using cross-sections, images must lie in exactly the same plane. However, this causes underestimation of muscle volume due to slight pressure from the ultrasound probe during imaging (Fukumoto et al). When oblique ultrasound images are taken, overestimation of volume will occur from the larger cross-sectional area being represented. To compensate for this problem, motion capture is combined with ultrasound in order to give information about the location of the probe, and therefore the muscle as well. This technique has been applied in research, such as the determination of Achilles tendon moment arm (Manal et al). This project focuses on utilizing motion capture data to manipulate ultrasound data in order to find the cross-sectional areas of muscles. Volumes calculated from these areas in ultrasound are then compared to those from MRI in order to validate the use of ultrasound in the future, as it is far less expensive, invasive, and constricting(Sridevi). The purpose of this project is two-fold. First, to calculate the volume of the gastrocnemius and soleus muscle in MATLAB using cross-sectional areas from ultrasound and motion capture images and to compare this volume to that found from MRI images in order to show that ultrasound is an acceptable method. Second, the ultimate goal of this project is to calculate the 3D volume of the muscle, using a mesh, that accounts for oblique images of the muscle and still accurately calculates the muscle’s volume. Five female college-age students who run at least 10 miles a week participated in this study. All subjects provided informed consent and all procedures were approved by the IRB. Table 1. Subject Characteristics – Group Mean (Range) All imaging was performed on the right leg. MRI – Axial, coronal, and sagittal images were obtained by Eastern Radiologists Inc. of Greenville, NC. Images were T1-weighted with a TR of 549.99 ms and a TE of 15 ms. Ultrasound/3D Motion Capture – Cross-sectional images of the leg were captured using the Aixplorer ultrasound system (SuperSonic Imagine, Aix-en- Provence, France) with the 10-2 probe. Motion capture data was captured using a five camera Qualisys motion tracking system at 240 Hz marker capture frequency. 1.Load MRI and ultrasound images and crop 2.Draw outline around muscle 3.Solve for transformation matrix Data collection and processing are still ongoing. When all images from ultrasound with motion capture and MRI scans have been collected, processing will be performed using MATLAB code, and it is expected that the computed volumes will be similar. Future work will address the 3D volume using a mesh. Figure 1. The ultrasound probe with 3 markers for motion capture, used to take images and establish the probe coordinate system. The experimental set up for motion capture data collection entailed establishing a coordinate system for the probe, shown in Figure 2. For collection, the subject lay prone on a table and 5 markers were placed the leg, as shown in Figure 2. Lines were drawn along the medial, lateral, and posterior edges, and 11 evenly-spaced marks were made on the lines. Ultrasound images were taken on these marks. Methods – MATLAB Processing Methods – MATLAB Processing cont’d LOCAL = probe coordinate system (see Figure 1) GLOBAL = coordinate system from motion capture Location of point in global coordinates Vector describing location of local origin relative to global Orientation of the local frame Location of point in local coordinates Transformation matrix MRI image Ultrasound Image x y z Age (years) Height (meters) Weight (kg) 22.4 (21-24) 1.67 (1.61-1.7) 58.2 (48.5-65.8) Figure 2. The experimental set up for ultrasound/motion capture data collection. Red dots denote motion capture markers. The lateral malleolus marker cannot be seen here. Methods – Data Collection, Motion Capture Lateral Posterior Medial