Download to read offline

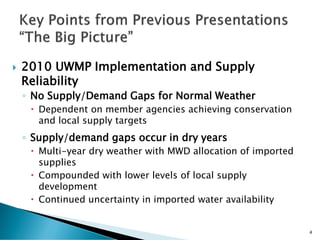
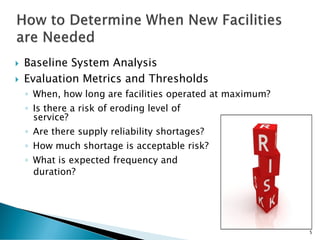
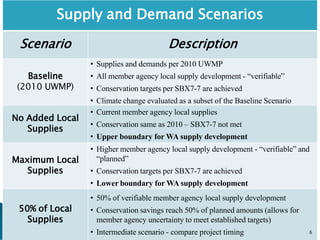
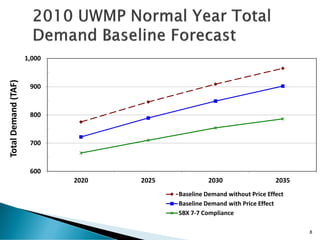
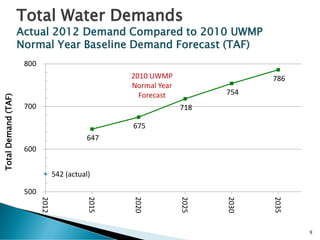
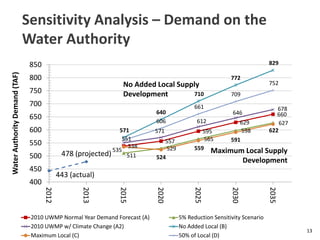
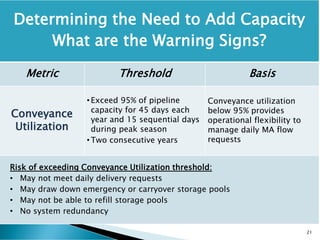
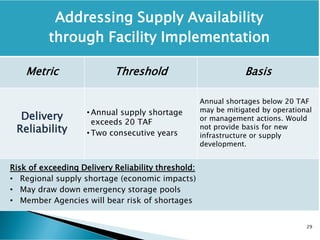
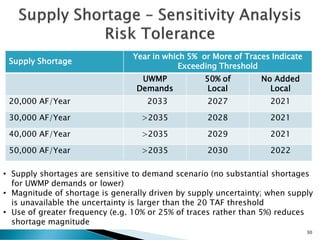
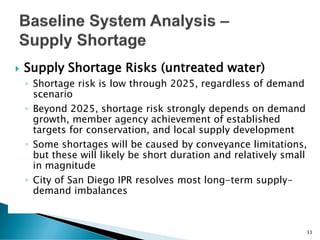
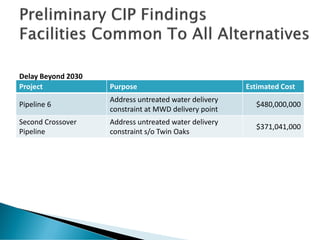

This document summarizes water supply and demand projections for a water agency through 2035. It analyzes the agency's baseline supply and demand under normal weather conditions, and identifies potential supply shortages during dry years. The document evaluates the agency's existing water storage and conveyance infrastructure and identifies needs to improve system performance and reliability. Metrics and thresholds are established to determine when new infrastructure or supplies may be needed to address risks to the system from high conveyance utilization or low delivery reliability. Near-term and long-term options are considered to address identified needs and ensure a reliable water supply for the region.

![Wp special master-plan[071113]](https://cdn.slidesharecdn.com/ss_thumbnails/wpspecial-masterplan071113-130712181949-phpapp02-thumbnail.jpg?width=640&height=640&fit=bounds)
![Wp [final]master plan may 16 workshop summary](https://cdn.slidesharecdn.com/ss_thumbnails/wp-finalmasterplanmay16workshopsummary-130715163001-phpapp02-thumbnail.jpg?width=640&height=640&fit=bounds)


