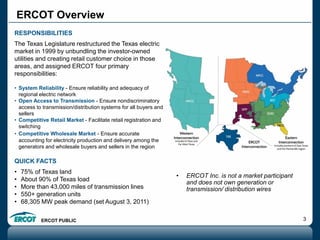
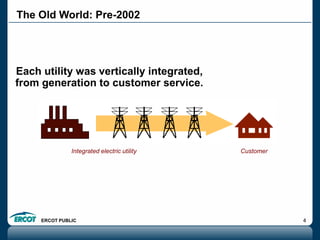
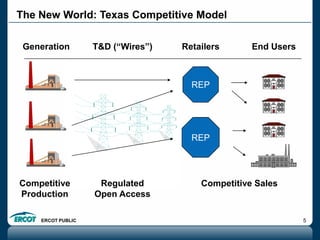
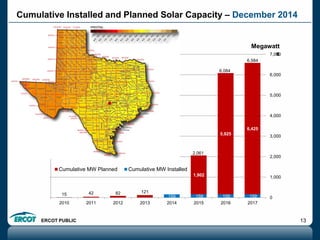
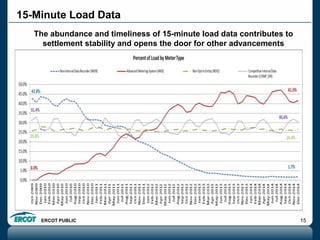
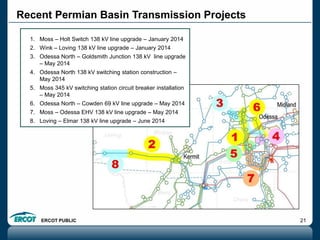
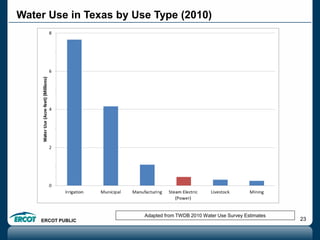
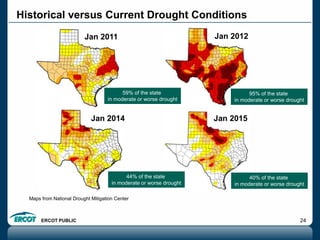
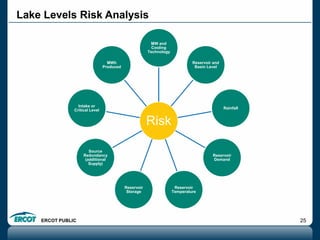
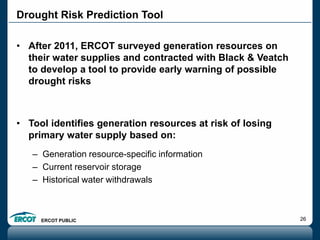
Update on ERCOT Activities
Trip Doggett
President & CEO
ERCOT
Texas Water Conservation Association
March 5, 2015
What is ERCOT?
ERCOT PUBLIC 3
ERCOT Overview
RESPONSIBILITIES
The Texas Legislature restructured the Texas electric
market in 1999 by unbundling the investor-owned
utilities and creating retail customer choice in those
areas, and assigned ERCOT four primary
responsibilities:
• System Reliability - Ensure reliability and adequacy of
regional electric network
• Open Access to Transmission - Ensure nondiscriminatory
access to transmission/distribution systems for all buyers and
sellers
• Competitive Retail Market - Facilitate retail registration and
switching
• Competitive Wholesale Market - Ensure accurate
accounting for electricity production and delivery among the
generators and wholesale buyers and sellers in the region
QUICK FACTS
• 75% of Texas land
• About 90% of Texas load
• More than 43,000 miles of transmission lines
• 550+ generation units
• 68,305 MW peak demand (set August 3, 2011)
• ERCOT Inc. is not a market participant
and does not own generation or
transmission/ distribution wires
ERCOT PUBLIC 4
The Old World: Pre-2002
Each utility was vertically integrated,
from generation to customer service.
Integrated electric utility Customer
ERCOT PUBLIC 5
Generation T&D (“Wires”)
Competitive
Production
Regulated
Open Access
End Users
REP
Competitive Sales
REP
Retailers
The New World: Texas Competitive Model
ERCOT PUBLIC 6
Current Records – February 27, 2015
Peak Demand Record: 68,305 megawatts (MW)
 68,305 MW, August 3, 2011
Weekend Record
 65,159 MW, Sunday, August 28, 2011
Winter Peak Record: 57,265 MW
 57,265 MW, February 10, 2011
Wind Generation Records (instantaneous)
 11,154 MW, February 19, 2015, 10:52 p.m.
- Non-Coastal Wind Output = 9,872 MW
- Coastal Wind Output = 1,282 MW
- Supplying 34.2% of the load
- Active Wind Capacity = 13,370 MW
• 39.67% Wind Penetration, December 14, 2014, 2:50 a.m.
- Total Wind Output = 10,240 MW
- Total Load = 25,814 MW
Summer 2014 Demand
- 59,786 MW, June 30
- 63,532 MW, July 21
- 66,454 MW, August 25
- 64,440 MW, September 10
- No new records
Load & Resources
ERCOT PUBLIC 8
Annual Energy and Peak Demand (2004-2014)
ERCOT PUBLIC 9
Energy Use
Total energy consumed:
324,859,701 MWh
Total energy consumed:
331,624,102 MWh
Total energy consumed:
340,033,353 MWh
ERCOT PUBLIC 10
December 2014 CDR compared to May 2014
ERCOT PUBLIC 11
Wind Generation Capacity – January 2015
• Texas is #1 in the U.S. in wind capacity.
• Our capacity is more than twice the amount
of #2 (California)
• If Texas were a separate country, we’d be
#6 in the world in wind generation capacity.
ERCOT PUBLIC 12
Installed and Planned Solar Capacity by Area – December 2014
27 122
10 105
280 200 285
5,555
0
1,000
2,000
3,000
4,000
5,000
6,000
North South West South West Panhandle South West
Installed Planned with
Interconnection Agreement
Planned with no Interconnection
Agreement
Megawatt
(as of Dec.31, 2014)
ERCOT PUBLIC 13
Cumulative Installed and Planned Solar Capacity – December 2014
159 159 15915 42 82 121
159
1,902
5,925
6,425
0
1,000
2,000
3,000
4,000
5,000
6,000
7,000
2010 2011 2012 2013 2014 2015 2016 2017
Cumulative MW Planned Cumulative MW Installed
Megawatt
s
2,061
6,084
6,584
ERCOT PUBLIC 14
Potential Impacts of Environmental Regulations
ERCOT reviewed potential impacts of new and pending environmental
regulations on grid reliability.
• Included CSAPR, MATS, Regional Haze, Clean Water Act Section 316(b), Ash Disposal
Regulations & Clean Power Plan
Studies indicate:
• Half of coal-fired generation capacity (about 9,000 MW) is likely to retire by 2022.
• Retirement of units serving urban areas may result in localized reliability issues.
• Growth in renewable resources may require development of new or additional
generation and transmission facilities and technologies to manage operational issues
(e.g., ramping, inertia, etc.).
• Costs of compliance could drive up consumer energy costs as much as 20%.
o Does not include costs of transmission upgrades or other investments to support
grid reliability
ERCOT and other grid operators support incorporation of “safety valve”
provisions to allow sufficient flexibility to maintain system reliability.
ERCOT PUBLIC 15
15-Minute Load Data
The abundance and timeliness of 15-minute load data contributes to
settlement stability and opens the door for other advancements
ERCOT PUBLIC 16
Distributed Energy Resources
• Distributed Energy Resources (DERs) include solar photovoltaic
(PV) installations, small wind turbines, batteries, small
generators, and advanced demand response.
• Identify potential future impacts of DERs on ERCOT’s functions
– including but not limited to load forecasting, network
modeling, real-time grid operations, metering and settlement.
• Identify and, when possible, eliminate barriers to DER
participation in ERCOT markets, including developing ways for
appropriate wholesale market price signals to be delivered to
DERs
Selected Transmission Projects
ERCOT PUBLIC 18
Houston Import Project
On April 8, 2014, the
ERCOT Board of
Directors endorsed the
Houston Import Project:
• New Limestone-
Gibbons Creek-Zenith
345 kV double-circuit
line deemed critical
• Includes
improvements to
substations and other
existing facilities
• Scheduled for
completion by summer
2018
ERCOT PUBLIC 19
Lower Rio Grande Valley Projects
Valley Import Project
• Includes new Lobo – North Edinburg 345 kV line and upgrade of existing
Valley import 345 kV lines
• Scheduled for summer 2016 in-service
Cross Valley Project
• Includes North Edinburg – Loma Alta 345 kV line
• Scheduled for summer 2016 in-service
ERCOT PUBLIC 20
Permian Basin
Oil and natural gas related demand has caused a significant
amount of load growth in the ERCOT Far West weather zone
ERCOT PUBLIC 21
Recent Permian Basin Transmission Projects
1. Moss – Holt Switch 138 kV line upgrade – January 2014
2. Wink – Loving 138 kV line upgrade – January 2014
3. Odessa North – Goldsmith Junction 138 kV line upgrade
– May 2014
4. Odessa North 138 kV switching station construction –
May 2014
5. Moss 345 kV switching station circuit breaker installation
– May 2014
6. Odessa North – Cowden 69 kV line upgrade – May 2014
7. Moss – Odessa EHV 138 kV line upgrade – May 2014
8. Loving – Elmar 138 kV line upgrade – June 2014
Drought
ERCOT PUBLIC 23
Water Use in Texas by Use Type (2010)
Adapted from TWDB 2010 Water Use Survey Estimates
ERCOT PUBLIC 24
Historical versus Current Drought Conditions
Maps from National Drought Mitigation Center
95% of the state
in moderate or worse drought
40% of the state
in moderate or worse drought
Jan 2011 Jan 2012
Jan 2015
59% of the state
in moderate or worse drought
Jan 2014
44% of the state
in moderate or worse drought
ERCOT PUBLIC 25
Lake Levels Risk Analysis
Risk
MW and
Cooling
Technology
Reservoir and
Basin Level
Rainfall
Reservoir
Demand
Reservoir
Temperature
Reservoir
Storage
Source
Redundancy
(additional
Supply)
Intake or
Critical Level
MWh
Produced
ERCOT PUBLIC 26
• After 2011, ERCOT surveyed generation resources on
their water supplies and contracted with Black & Veatch
to develop a tool to provide early warning of possible
drought risks
• Tool identifies generation resources at risk of losing
primary water supply based on:
– Generation resource-specific information
– Current reservoir storage
– Historical water withdrawals
Drought Risk Prediction Tool
ERCOT PUBLIC 27
Current Reservoir Storage
ERCOT PUBLIC 28
Reservoir Storage Prediction Example
Reservoir conservation storage capacity
Reservoir critical level (location of water intake)
Predicted reservoir storage
(under drought conditions)
Current reservoir
storage
Reservoir could reach
critical level in 17 months
ERCOT PUBLIC 29
Drought Monitoring & Preparedness
• SB 662 (83R) added ERCOT and the Public Utility Commission to
the Drought Preparedness Council
• ERCOT has employees focused on resource adequacy issues,
including water supply and environmental issues. ERCOT also
has a meteorologist on staff.
• ERCOT is in frequent communication with Resource and
Transmission owners about water availability and other issues
• ERCOT has developed a drought risk-assessment tool that is used
to track the potential near-term impacts of drought conditions
• ERCOT has incorporated drought issues into the near-term and
long-term resource adequacy reports
Social Media Update
ERCOT PUBLIC 31
Improving communications with consumers
ERCOT website – added features
• Today’s Outlook: Now shows Real-
Time demand and capacity (vs.
hourly)
• Weather page: Daily, seasonal
Social media – join us!
• Twitter: 6,200+ followers
• Facebook: 1,500+ friends
• LinkedIn: 3,000+ followers
ERCOT Energy Saver mobile app – upgraded
• System conditions – Real-Time demand and capacity
• Wholesale pricing information – Hubs and Load Zones
• Information sharing options

Update on ERCOT Activities

  • 1.
    Update on ERCOTActivities Trip Doggett President & CEO ERCOT Texas Water Conservation Association March 5, 2015
  • 2.
  • 3.
    ERCOT PUBLIC 3 ERCOTOverview RESPONSIBILITIES The Texas Legislature restructured the Texas electric market in 1999 by unbundling the investor-owned utilities and creating retail customer choice in those areas, and assigned ERCOT four primary responsibilities: • System Reliability - Ensure reliability and adequacy of regional electric network • Open Access to Transmission - Ensure nondiscriminatory access to transmission/distribution systems for all buyers and sellers • Competitive Retail Market - Facilitate retail registration and switching • Competitive Wholesale Market - Ensure accurate accounting for electricity production and delivery among the generators and wholesale buyers and sellers in the region QUICK FACTS • 75% of Texas land • About 90% of Texas load • More than 43,000 miles of transmission lines • 550+ generation units • 68,305 MW peak demand (set August 3, 2011) • ERCOT Inc. is not a market participant and does not own generation or transmission/ distribution wires
  • 4.
    ERCOT PUBLIC 4 TheOld World: Pre-2002 Each utility was vertically integrated, from generation to customer service. Integrated electric utility Customer
  • 5.
    ERCOT PUBLIC 5 GenerationT&D (“Wires”) Competitive Production Regulated Open Access End Users REP Competitive Sales REP Retailers The New World: Texas Competitive Model
  • 6.
    ERCOT PUBLIC 6 CurrentRecords – February 27, 2015 Peak Demand Record: 68,305 megawatts (MW)  68,305 MW, August 3, 2011 Weekend Record  65,159 MW, Sunday, August 28, 2011 Winter Peak Record: 57,265 MW  57,265 MW, February 10, 2011 Wind Generation Records (instantaneous)  11,154 MW, February 19, 2015, 10:52 p.m. - Non-Coastal Wind Output = 9,872 MW - Coastal Wind Output = 1,282 MW - Supplying 34.2% of the load - Active Wind Capacity = 13,370 MW • 39.67% Wind Penetration, December 14, 2014, 2:50 a.m. - Total Wind Output = 10,240 MW - Total Load = 25,814 MW Summer 2014 Demand - 59,786 MW, June 30 - 63,532 MW, July 21 - 66,454 MW, August 25 - 64,440 MW, September 10 - No new records
  • 7.
  • 8.
    ERCOT PUBLIC 8 AnnualEnergy and Peak Demand (2004-2014)
  • 9.
    ERCOT PUBLIC 9 EnergyUse Total energy consumed: 324,859,701 MWh Total energy consumed: 331,624,102 MWh Total energy consumed: 340,033,353 MWh
  • 10.
    ERCOT PUBLIC 10 December2014 CDR compared to May 2014
  • 11.
    ERCOT PUBLIC 11 WindGeneration Capacity – January 2015 • Texas is #1 in the U.S. in wind capacity. • Our capacity is more than twice the amount of #2 (California) • If Texas were a separate country, we’d be #6 in the world in wind generation capacity.
  • 12.
    ERCOT PUBLIC 12 Installedand Planned Solar Capacity by Area – December 2014 27 122 10 105 280 200 285 5,555 0 1,000 2,000 3,000 4,000 5,000 6,000 North South West South West Panhandle South West Installed Planned with Interconnection Agreement Planned with no Interconnection Agreement Megawatt (as of Dec.31, 2014)
  • 13.
    ERCOT PUBLIC 13 CumulativeInstalled and Planned Solar Capacity – December 2014 159 159 15915 42 82 121 159 1,902 5,925 6,425 0 1,000 2,000 3,000 4,000 5,000 6,000 7,000 2010 2011 2012 2013 2014 2015 2016 2017 Cumulative MW Planned Cumulative MW Installed Megawatt s 2,061 6,084 6,584
  • 14.
    ERCOT PUBLIC 14 PotentialImpacts of Environmental Regulations ERCOT reviewed potential impacts of new and pending environmental regulations on grid reliability. • Included CSAPR, MATS, Regional Haze, Clean Water Act Section 316(b), Ash Disposal Regulations & Clean Power Plan Studies indicate: • Half of coal-fired generation capacity (about 9,000 MW) is likely to retire by 2022. • Retirement of units serving urban areas may result in localized reliability issues. • Growth in renewable resources may require development of new or additional generation and transmission facilities and technologies to manage operational issues (e.g., ramping, inertia, etc.). • Costs of compliance could drive up consumer energy costs as much as 20%. o Does not include costs of transmission upgrades or other investments to support grid reliability ERCOT and other grid operators support incorporation of “safety valve” provisions to allow sufficient flexibility to maintain system reliability.
  • 15.
    ERCOT PUBLIC 15 15-MinuteLoad Data The abundance and timeliness of 15-minute load data contributes to settlement stability and opens the door for other advancements
  • 16.
    ERCOT PUBLIC 16 DistributedEnergy Resources • Distributed Energy Resources (DERs) include solar photovoltaic (PV) installations, small wind turbines, batteries, small generators, and advanced demand response. • Identify potential future impacts of DERs on ERCOT’s functions – including but not limited to load forecasting, network modeling, real-time grid operations, metering and settlement. • Identify and, when possible, eliminate barriers to DER participation in ERCOT markets, including developing ways for appropriate wholesale market price signals to be delivered to DERs
  • 17.
  • 18.
    ERCOT PUBLIC 18 HoustonImport Project On April 8, 2014, the ERCOT Board of Directors endorsed the Houston Import Project: • New Limestone- Gibbons Creek-Zenith 345 kV double-circuit line deemed critical • Includes improvements to substations and other existing facilities • Scheduled for completion by summer 2018
  • 19.
    ERCOT PUBLIC 19 LowerRio Grande Valley Projects Valley Import Project • Includes new Lobo – North Edinburg 345 kV line and upgrade of existing Valley import 345 kV lines • Scheduled for summer 2016 in-service Cross Valley Project • Includes North Edinburg – Loma Alta 345 kV line • Scheduled for summer 2016 in-service
  • 20.
    ERCOT PUBLIC 20 PermianBasin Oil and natural gas related demand has caused a significant amount of load growth in the ERCOT Far West weather zone
  • 21.
    ERCOT PUBLIC 21 RecentPermian Basin Transmission Projects 1. Moss – Holt Switch 138 kV line upgrade – January 2014 2. Wink – Loving 138 kV line upgrade – January 2014 3. Odessa North – Goldsmith Junction 138 kV line upgrade – May 2014 4. Odessa North 138 kV switching station construction – May 2014 5. Moss 345 kV switching station circuit breaker installation – May 2014 6. Odessa North – Cowden 69 kV line upgrade – May 2014 7. Moss – Odessa EHV 138 kV line upgrade – May 2014 8. Loving – Elmar 138 kV line upgrade – June 2014
  • 22.
  • 23.
    ERCOT PUBLIC 23 WaterUse in Texas by Use Type (2010) Adapted from TWDB 2010 Water Use Survey Estimates
  • 24.
    ERCOT PUBLIC 24 Historicalversus Current Drought Conditions Maps from National Drought Mitigation Center 95% of the state in moderate or worse drought 40% of the state in moderate or worse drought Jan 2011 Jan 2012 Jan 2015 59% of the state in moderate or worse drought Jan 2014 44% of the state in moderate or worse drought
  • 25.
    ERCOT PUBLIC 25 LakeLevels Risk Analysis Risk MW and Cooling Technology Reservoir and Basin Level Rainfall Reservoir Demand Reservoir Temperature Reservoir Storage Source Redundancy (additional Supply) Intake or Critical Level MWh Produced
  • 26.
    ERCOT PUBLIC 26 •After 2011, ERCOT surveyed generation resources on their water supplies and contracted with Black & Veatch to develop a tool to provide early warning of possible drought risks • Tool identifies generation resources at risk of losing primary water supply based on: – Generation resource-specific information – Current reservoir storage – Historical water withdrawals Drought Risk Prediction Tool
  • 27.
    ERCOT PUBLIC 27 CurrentReservoir Storage
  • 28.
    ERCOT PUBLIC 28 ReservoirStorage Prediction Example Reservoir conservation storage capacity Reservoir critical level (location of water intake) Predicted reservoir storage (under drought conditions) Current reservoir storage Reservoir could reach critical level in 17 months
  • 29.
    ERCOT PUBLIC 29 DroughtMonitoring & Preparedness • SB 662 (83R) added ERCOT and the Public Utility Commission to the Drought Preparedness Council • ERCOT has employees focused on resource adequacy issues, including water supply and environmental issues. ERCOT also has a meteorologist on staff. • ERCOT is in frequent communication with Resource and Transmission owners about water availability and other issues • ERCOT has developed a drought risk-assessment tool that is used to track the potential near-term impacts of drought conditions • ERCOT has incorporated drought issues into the near-term and long-term resource adequacy reports
  • 30.
  • 31.
    ERCOT PUBLIC 31 Improvingcommunications with consumers ERCOT website – added features • Today’s Outlook: Now shows Real- Time demand and capacity (vs. hourly) • Weather page: Daily, seasonal Social media – join us! • Twitter: 6,200+ followers • Facebook: 1,500+ friends • LinkedIn: 3,000+ followers ERCOT Energy Saver mobile app – upgraded • System conditions – Real-Time demand and capacity • Wholesale pricing information – Hubs and Load Zones • Information sharing options

Editor's Notes

  • #16 15-min load data stats: Over 6.7M ESIIDs are settled using Advanced Meter data AMS deployment is near complete, < 5% remain to be provisioned Sharyland will file AMS deployment plan with the commission in 2015, therefore AMS numbers will increase Over 98% of the load in ERCOT is settled with 15-min interval data (AMS, Competitive IDR, and NOIE IDR). Over 67% of the 15-minute interval data is quickly available for use on RTM Initial Settlement (~5 days later) ESI ID Counts by Meter Type: - AMS: > 6.7M ESI IDs - Competitive IDR: ~ 12K ESI IDs - NOIE IDR ESI IDs: ~ 1300 ESI Ds - NIDR: ~ 295K ESI IDs - TOTAL: ~ 7M ESI IDs “Settlement Stability”: Reduced need for ERCOT to profile and estimate load for 15-minute intervals  increases accuracy Increased “actual” data on Initial Settlement  less settlement volatility throughout the settlement cycle Both of these contribute towards to reduced UFE. UFE levels steadily decreased, while 15-min data availability steadily increased “Other advancements”: Wholesale demand response Retail products and services
  • #17 Slide #5
  • #32 Communication will remain important to help consumers understand when conservation needed most and how best to get there. Also working to improve awareness of operating reserves – new Today’s Outlook on home page shows generation capacity Added weather page for Chris’ forecasts, adding a page this week for longer-term outlooks, working on new conservation page Organizational change this spring moved ercot.com to Corporate Communications. Overall website overhaul still in progress – team moved to Corporate Communications. Goal is rollout by summer 2014 Amy Apodaca working to keep content on existing site fresh Aubrey Hale working on strategy for site redesign