Canara Bank's operating performance to improve in remaining 9MFY16E
•
1 like•239 views

Canara Bank's operating performance to improve in remaining 9MFY16E; Buy #BrokerAdvice http://goo.gl/MD4XQ9

Recommended
Recommended
More Related Content
What's hot
What's hot (19)
Viewers also liked
Viewers also liked (17)
Similar to Canara Bank's operating performance to improve in remaining 9MFY16E
Similar to Canara Bank's operating performance to improve in remaining 9MFY16E (20)
More from IndiaNotes.com
More from IndiaNotes.com (20)
Recently uploaded
Recently uploaded (20)
Canara Bank's operating performance to improve in remaining 9MFY16E
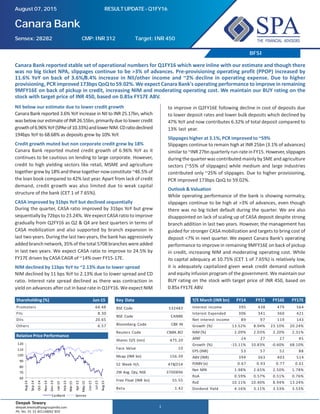
- 1. 1 BFSI Canara Bank Canara Bank reported stable set of operational numbers for Q1FY16 which were inline with our estimate and though there was no big ticket NPA, slippages continue to be >3% of advances. Pre-provisioning operating profit (PPOP) increased by 11.6% YoY on back of 3.6%/8.4% increase in NII/other income and ~2% decline in operating expense. Due to higher provisioning, PCR improved 173bps QoQ to 59.02%. We expect Canara Bank's operating performance to improve in remaining 9MFY16E on back of pickup in credit, increasing NIM and moderating operating cost. We maintain our BUY rating on the stock with target price of INR 450, based on 0.85x FY17E ABV. NII below our estimate due to lower credit growth Canara Bank reported 3.6% YoY increase in NII to INR 25.17bn, which wasbelowourestimateofINR26.55bn,primarilyduetolowercredit growthof6.96%YoY(SPAeof10.33%)andlowerNIM.CDratiodeclined 194bps YoY to 68.68% as deposits grew by 10% YoY. Credit growth muted but non corporate credit grew by 18% Canara Bank reported muted credit growth of 6.96% YoY as it continues to be cautious on lending to large corporate. However, credit to high yielding sectors like retail, MSME and agriculture togethergrewby18%andthesetogethernowconstitute~46.5%of the loan book compared to 42% last year. Apart from lack of credit demand, credit growth was also limited due to weak capital structure of the bank (CET 1 of 7.65%). CASA improved by 31bps YoY but declined sequentially During the quarter, CASA ratio improved by 31bps YoY but grew sequentially by 72bps to 23.24%. We expect CASA ratio to improve gradually from Q2FY16 as Q2 & Q4 are best quarters in terms of CASA mobilization and also supported by branch expansion in last two years. During the last two years, the bank has aggressively added branch network, 35% of the total 5708 branches were added in last two years. We expect CASA ratio to improve to 24.5% by FY17E driven by CASA CAGR of ~14% over FY15-17E. NIM declined by 11bps YoY to ~2.13% due to lower spread NIM declined by 11 bps YoY to 2.13% due to lower spread and CD ratio. Interest rate spread declined as there was contraction in yield on advances after cut in base rate in Q1FY16. We expect NIM Shareholding (%) Jun-15 Promoters 64.48 FIIs 8.30 DIIs 20.65 Others 6.57 Relative Price Performance August 07, 2015 RESULTUPDATE-Q1FY16 to improve in Q2FY16E following decline in cost of deposits due to lower deposit rates and lower bulk deposits which declined by 47% YoY and now contributes 6.32% of total deposit compared to 13% last year. Slippages higher at 3.1%, PCR improved to ~59% Slippages continue to remain high at INR 25bn (3.1% of advances) similar to ~INR 27bn quarterly run-rate in FY15. However, slippages during the quarter was contributed mainly by SME and agriculture sectors (~55% of slippages) while medium and large industries contributed only ~25% of slippages. Due to higher provisioning, PCR improved 173bps QoQ to 59.02%. Outlook & Valuation While operating performance of the bank is showing normalcy, slippages continue to be high at >3% of advances, even though there was no big ticket default during the quarter. We are also disappointed on lack of scaling up of CASA deposit despite strong branch addition in last two years. However, the management has guided for stronger CASA mobilization and targets to bring cost of deposit <7% in next quarter. We expect Canara Bank's operating performance to improve in remaining 9MFY16E on back of pickup in credit, increasing NIM and moderating operating cost. While its capital adequacy at 10.75% (CET 1 of 7.65%) is relatively low, it is adequately capitalized given weak credit demand outlook and equity infusion program of the government. We maintain our BUY rating on the stock with target price of INR 450, based on 0.85x FY17E ABV. Key Data BSE Code 532483 NSE Code CANBK Bloomberg Code CBK IN Reuters Code CNBK.BO Shares O/S (mn) 475.20 Face Value 10 Mcap (INR bn) 156.39 52 Week H/L 478/254 2W Avg. Qty, NSE 3700896 Free Float (INR bn) 55.55 Beta 1.42 Y/E March (INR bn) FY14 FY15 FY16E FY17E Interest income 395 438 479 564 Interest Expended 306 341 360 421 Net interest income 89 97 119 143 Growth (%) 13.52% 8.04% 23.10% 20.24% NIM (%) 2.09% 2.03% 2.20% 2.31% APAT 24 27 27 45 Growth (%) -15.11% 10.83% -0.60% 68.10% EPS (INR) 53 57 52 88 ABV (INR) 394 363 403 514 P/ABV (x) 0.67 0.93 0.77 0.61 Net NPA 1.98% 2.65% 2.50% 1.78% RoA 0.59% 0.57% 0.51% 0.76% RoE 10.11% 10.40% 8.94% 13.24% Dividend Yield 4.16% 3.11% 3.53% 3.53% Sensex: 28282 CMP:INR312 Target: INR 450 Deepak Tewary deepak.tewary@spagroupindia.com Ph. No. 91 33 40114800/ 859 60 70 80 90 100 110 120 Aug-14 Sep-14 Oct-14 Nov-14 Dec-14 Jan-15 Feb-15 Mar-15 Apr-15 May-15 Jun-15 Jul-15 Aug-15 CanBank Sensex
- 2. 2 BFSI Source:Company, SPA Research Other Highlights • During the quarter, the bank restructured asset worth INR 7.19bn against management guidance of ~INR 5bn. However, there was no slippages from standard restructured accounts and NPA in restructured accounts declined to INR 56.67bn compared to 58.8bn in Q4FY15. Of the total restructured amount, infrastructure, iron & steel, textile and construction constitutes 51%, 11%, 7% and 11% respectively. • NetProfitdeclinedby40.6%YoYtoINR4.79bn(SPAe:INR4.83bn) despite PPOP improving by 11.6% due to higher provisioning for NPA, which increased by 72.5% YoY to 13.6bn. Due to higher NPA provisioning, PCR improved 173bps QoQ to 59.02%. Non- interest income increased by 8.4% YoY because of higher trading profit and recovery in written-off accounts. • Canara Bank added 26 branches and 506 ATMs during the quarter taking the total strength of branches to 5708 and ATMs to 9039. • As per Basel III norms, Canara Bank's CAR stands at 10.75% at the end of Q1FY16 with tier 1 / CET1 capital at 8.28%/7.65%. During the quarter, Canara Bank allotted 40mn shares to LIC at NR 380.08 after which, government's shareholding decreased to 64.48% from 69.91%. Quarterly Financials Particulars(INRbn) Q1FY16 Q4FY15 Q1FY15 % YoY % QoQ Interest Earned 111.4 111.0 107.0 4.1% 0.3% Interest Expended 86.2 86.2 82.7 4.2% 0.1% Net Interest Income 25.2 24.9 24.3 3.6% 1.2% NIM (%) 2.13 2.09 2.24 (11 bps) 04 bps Other Income 11.1 13.3 10.3 8.4% -16.1% Net Total Income 36.3 38.1 34.6 5.0% -4.8% Operating Expenses 16.3 20.8 16.6 -2.1% -21.8% Paymentsto/Provisionsforemployees 10.6 11.6 10.4 2.0% -8.9% Other operating expenses 5.7 9.2 6.2 -9.0% -38.1% Cost/Income Ratio (%) 44.80 54.55 48.06 (326 bps) (975 bps) OperatingProfits 20.0 17.3 18.0 11.6% 15.6% Provisions & Contingencies 13.6 10.1 7.9 72.5% 34.7% ProfitBefore Tax 6.4 7.2 10.1 -36.1% -10.9% Provision for Tax 1.7 1.1 2.0 -17.5% 50.0% NetProfit 4.8 6.1 8.1 -40.7% -21.9% EPS 9.3 12.9 17.5 - - Equity 5.2 4.8 4.6 - - GNPA 130.8 130.3 81.6 60.3% 0.4% NNPA 88.9 87.4 61.5 44.5% 1.7% GNPA (%) 3.98 3.89 2.67 131 bps 09 bps NNPA (%) 2.74 2.65 2.03 71 bps 09 bps RoA (%) 0.36 0.50 0.66 (30 bps) (14 bps) NIM to improve due to higher retail lending and repricing of liability 0.00% 3.00% 6.00% 9.00% 12.00% Q1FY15 Q2FY15 Q3FY15 FY15E FY16E FY17E 1.8% 1.9% 2.0% 2.1% 2.2% 2.3% 2.4% Cost of deposit Yield on Advances NIM (RHS) CASA impacted due to lower current deposit growth 0.0% 5.0% 10.0% 15.0% 20.0% 25.0% 30.0% Q4FY14 Q1FY15 Q2FY15 Q3FY15 Q4FY15 Q1FY16 21.5% 22.0% 22.5% 23.0% 23.5% 24.0% 24.5% 25.0% CASA Ratio (RHS) Growth in Deposit Growth in Advances Cost/Income Ratio - decline due to no wage hike related provisioning; expect it to stabilize ~46% in FY17E 40.0% 45.0% 50.0% 55.0% Q4FY14 Q1FY15 Q2FY15 Q3FY15 Q4FY15 Q1FY16
- 3. 3 BFSI Financials Income StatementY Y/E March (INR bn) FY14 FY15 FY16E FY17E Interest income 395 438 479 564 Growth (%) 16.05% 10.63% 9.58% 17.72% Interest Expended 306 341 360 421 Net interest income 89 97 119 143 Growth (%) 13.52% 8.04% 23.10% 20.24% Other Income 39 45 49 58 Net Income 129 142 168 201 Operating Expenditure 61 73 81 92 Operating Income 68 69 88 110 Provisions & Contingencies 37 35 50 45 PBT 31 35 38 64 Tax 6 8 11 19 PAT 24 27 27 45 Extra-ordinary Items 0 0 0 0 APAT 24 27 27 45 Growth (%) -15.11% 10.83% -0.60% 68.10% EPS (INR) 52.86 56.86 52.13 87.63 Balance Sheet Y/E March (INR bn) FY14 FY15 FY16E FY17E SOURCES OF FUNDS Equity Share Capital 4.6 4.8 5.2 5.2 Reserves 292 313 350 391 Total Shareholders Funds 296 318 356 396 Total Deposits 4207 4738 5293 6007 Growth (%) 18.23% 12.63% 11.70% 13.50% Borrowings 272 257 165 336 Other Liabilities & Provisions 147 166 243 180 Total Liabilities 4923 5479 6057 6920 APPLICATION OF FUNDS Current Assets 448 486 439 496 Investments 1268 1453 1678 1904 Advances 3011 3300 3729 4289 Growth (%) 24.32% 9.62% 13.00% 15.00% Fixed Assets 66 69 77 85 Other Assets 129 170 133 146 Total Assets 4923 5479 6057 6920 Key Ratios Y/E March (INR bn) FY14 FY15 FY16E FY17E Per Share Data (INR) EPS 52.86 56.86 52.13 87.63 BVPS 642.16 668.50 690.12 768.62 ABVPS 393.63 362.76 402.68 513.76 DPS 11.00 10.50 11.00 11.00 Profitability Ratios Yield on Advances 10.62% 10.72% 10.22% 10.22% Cost of Deposits 7.49% 7.41% 7.01% 7.00% Net Interest Margin 2.09% 2.03% 2.20% 2.31% RoA 0.59% 0.57% 0.51% 0.76% RoE 10.11% 10.40% 8.94% 13.24% Balance Sheet Ratios Credit/Deposit Ratio 71.56% 69.65% 70.46% 71.39% Investment/Deposit Ratio 30.15% 30.67% 31.70% 31.70% CASA Ratio 24.55% 23.96% 24.21% 24.50% Capital Adequacy Ratio (CAR) 10.63% 10.56% 9.99% 9.59% Tier I 7.68% 8.02% 7.75% 7.65% Aseet Quality Ratios Gross NPA 2.51% 3.95% 3.75% 2.83% Net NPA 1.98% 2.65% 2.50% 1.78% Provision Coverage Ratio 60.11% 57.29% 58.85% 62.82% Slippage Ratio 3.91% 3.29% 2.50% 1.00% Efficiency Ratios Cost to Income Ratio 47.22% 51.10% 47.82% 45.63% Business per Employee (in INR mn) 147.93 148.92 156.69 168.29 Profit per Employee (in INR mn) 0.50 0.50 0.47 0.74 Valuation Ratios P/E(x) 5.00 5.94 5.98 3.56 P/ABV (x) 0.67 0.93 0.77 0.61 Dividend Yield 4.16% 3.11% 3.53% 3.53%
- 4. 4 BFSI For More Information Visit Us At : www.spasecurities.com Sharad Avasthi Head - Equity Research sharad.avasthi@spagroupindia.com Tel.: +91-33-4011 4800 Ext.832 SPA Securities Ltd: Mittal Court, A-Wing, 10th Floor, Nariman Point, Mumbai - 400 021, Tel. No. : +91-022-4289 5600, Fax: +91 (22) 2657 3708/9 Analyst Certification of Independence: The analyst(s) for this report certifies that all the views expressed in this report accurately reflect his or her personal views about the subject company(ies) or issuers and no part of his or hercompensationwas,isorwillbe,directlyorindirectlyrelatedtospecificrecommendationsorviewsexpressedinthisreport.Theresearchanalystsareboundbystringentinternalregulationsandalsolegalandstatutoryrequirements of the Securities and Exchange Board of India (hereinafter "SEBI") and the analysts' compensation are completely delinked from all the other companies and/or entities of SPASecurities Limited, and have no bearing whatsoever on anyrecommendationthattheyhavegivenintheResearchReport. DisclaimerandDisclosuresasrequiredunderSEBI(Research Analyst)Regulations,2014:SPASecuritiesLimited(hereinafterreferasSPASecurities)anditsaffiliatesareengagedininvestmentbanking,investment advisory, stock broking, institutional equities, Mutual Fund Distributor and insurance broking. SPASecurities is a SEBI registered securities broking Company having membership of NSE, BSE & MCX for Equity, Future & Option, Currency Derivatives segment and Wholesale Debt Market. The Company is focused primarily on providing securities broking services to institutional clients and is empanelled as an approved securities broker with all the major Nationalised, PrivateandCo-operativebanks,Corporatehouses,InsuranceCompanies,FinancialInstitutions,AssetManagementCompaniesandProvidentFundTrusts.Detailsofaffiliatesareavailableonourwebsitei.e.www.spasecurities.com. Weherebydeclarethatouractivitieswereneithersuspendednorwehavedefaultedwithanystockexchangeauthoritywithwhom weareregisteredinthelastfiveyears.WehavenotbeendebarredfromdoingbusinessbyanyStock Exchange/SEBI or any other authorities, nor has our certificate of registration been cancelled by SEBI at any point of time. GeneralDisclosures: ThisResearchReport(hereinaftercalled"report")hasbeenpreparedbySPASecuritiesandismeantforsoleusebytherecipientandnotforcirculation.ThisReportdoesnotconstituteapersonalrecommendation or take into account the particular investment objectives, financial situations, or needs of individual clients. The recommendations, if any, made herein are expression of views and/or opinions and should not be deemed or construed tobeneitheradviceforthepurposeofpurchaseorsaleofanysecurity,(asdefinedundersection2(h)ofsecuritiesContracts(Regulation)Act.1956,throughSPASecuritiesnoranysolicitationorofferingofanyinvestment/tradingopportunity onbehalfoftheissuer(s)oftherespectivesecurity(ies)referredtoherein.RecipientsofthisReportshouldrelyoninformation/dataarisingoutoftheirowninvestigations.Readersareadvisedtoseekindependentprofessionaladvice and arrive at an informed trading/investment decision before executing any trades or making any investments. ThisReporthasbeenpreparedonthebasisofpubliclyavailableinformation,internallydevelopeddataandothersourcesbelievedbySPASecuritiestobereliable,althoughitsaccuracyandcompletenesscannotbeguaranteed.Such information has not been independently verified and no guaranty, representation of warranty, express or implied, is made as to its accuracy, completeness or correctness.Any review, retransmission or any other use is prohibited. The information, opinions, views expressed in this Research Report are those of the research analyst as at the date of this Research Report which are subject to change and do not represent to be an authority on the subject. While we would endeavour to update the information herein on a reasonable basis, we are under no obligation to update the information.Also, there may be regulatory, compliance or other reasons that prevent us from doing so. Hence all such information and opinions are subject to change without notice. Our salespeople, traders, and other professionals may provide oral or written market commentary or trading strategies to our clients that reflect opinions that are contrary to the opinions expressed herein, and our proprietary trading and investing businesses may make investment decisions that may be inconsistent with the recommendations expressed herein. This Research Report should be read and relied upon at the sole discretion and risk of the recipient. If you are dissatisfied with the contents of this complimentary Research Report or with the terms of this Disclaimer, your sole and exclusive remedy is to stop using this Research Report. Neither SPASecurities nor its affiliates or their respective directors, employees, agents or representatives shall be responsible or liable in any manner, directly or indirectly, for the losses or the damages sustained due to the investments made or any action taken on basis of this report, including but not restricted to, fluctuation in the prices of shares and bonds, changes in the currency rates, diminution in the NAVs, reduction in the dividend or income, etc. Compensation of our ResearchAnalysts is not based on any specific merchant banking, investment banking or brokerage service transactions. SPASecurities may have issued other reports in the past that are inconsistent with and reachdifferentconclusionfromtheinformationpresentedinthisreport. SPASecurities, its affiliates and employees may, from time to time, effect or have effected an own account transaction in, or deal as principal or agent in or for the securities mentioned in this document.They may perform or seek to perform investment banking or other services for, or solicit investment banking or other business from, any company referred to in this report. TheusershouldconsulttheirownadvisorstodeterminethemeritsandrisksofinvestmentandalsoreadtheRiskDisclosureDocumentsforCapitalMarketsandDerivativeSegmentsasprescribedbySecuritiesandExchangeBoard of India before investing in the Indian Markets. A graph of daily closing prices of securities is available at www.nseindia.com and http://economictimes.indiatimes.com/markets/stocks/stock-quotes. (Choose a company from the list on the browser and select the "three years" icon in the price chart). SPASecurities plans to register itself as a Research Entity under the SEBI (ResearchAnalysts) Regulations, 2014. Disclaimers in respect of jurisdiction: This report is not directed to, or intended for distribution to or use by, any person or entity who is a citizen or resident or located in any locality, state, country or other jurisdiction where such distribution, publication, reproduction, availability or use would be contrary to law or regulation or what would subject SPASecurities or its affiliates to any registration or licensing requirement within such jurisdiction. If this report is inadvertentlysendorhasreachedanyindividualinsuchcountry,especially,USA,thesamemaybeignoredandbroughttotheattentionofthesender.Thisdocumentmaynotbereproduced,distributedorpublishedforanypurposes without prior written approval of SPASecurities. List of Associates as per SEBI (Research Analyst) Regulations, 2014 • SPAInsurance Broking Services limited Statements on ownership and material conflicts of interest, compensation - SPA and Associates Disclosure of interest statement Yes/No SPA Securities/its Affiliates/Analyst/his or her Relative financial interest in the company No SPA Securities/its Affiliates/Analyst/his or her Relative actual/beneficial ownership of more than 1% in subject company at the end of the month Immediately preceding the date of the publication of the research report or date of public appearance. No Investment banking relationship with the company covered No Any other material conflict of interest at the time of publishing the research report No Receipt of compensation by SPA Securities or its Affiliated Companies from the subject company covered for in the last twelve months: • Managing/co-managing public offering of securities • Investmentbanking/merchantbanking/brokerageservices • products or services other than those above • in connection with research report No Whether Research Analyst has served as an officer, director or employee of the subject company covered No Whether the Research Analyst or Research Entity has been engaged in market making activity of the Subject Company; No For statements on ownership and material conflicts of interest, compensation, etc. for individual Research Analyst(s), please refer to each specific research report. SPA CAPITAL SERVICES LIMITED Investment Advisory Services, AMFI Reg. No. ARN-0007 SPA CAPITAL ADVISORS LIMITED SEBI registered Category-1 Merchant Bankers SEBI Regn. No. INM000010825 SPA COMTRADE PRIVATE LIMITED Member of NCDEX & MCX. NCDEX TMID-00729, NCDEXFMCNo.NCDEX/TCM/CORP/0714 SPAINSURANCE BROKING SERVICES LTD Direct Broker for Life and General Insurance Broking IRDA Lic. Code No. DB053/03 SPA Securities Ltd SEBI Reg. Nos. NSE Cash INB231178238 NSE Future & Option INF231173238 NSE Currency Derivatives INE231178238 BSE Cash INB011178234 BSE Currency Derivatives INE011178234 MCX-SX Cash INB261178231 MCX-SX Future & Option INF261178231 MCX-SX Currency Derivatives INE261178238 Mutual Fund ARN 77388 CDSLDP IN-DP-CDSL-485-2008 NSDLDP IN-DP-NSDL-316-2009