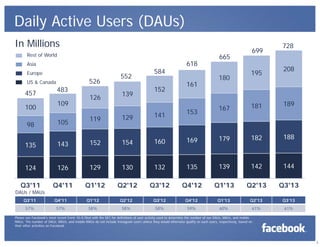
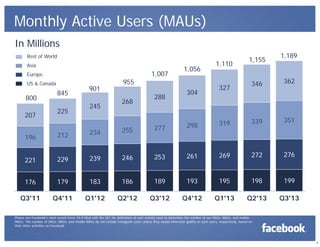
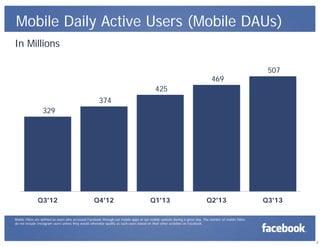
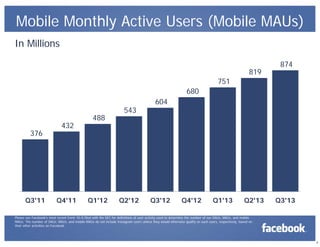
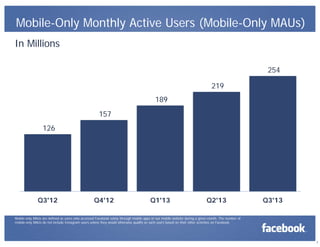
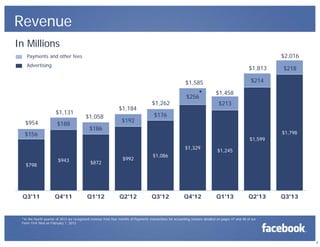
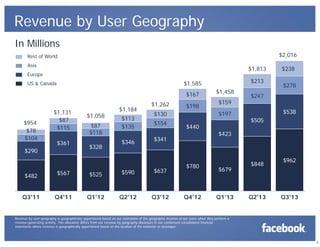
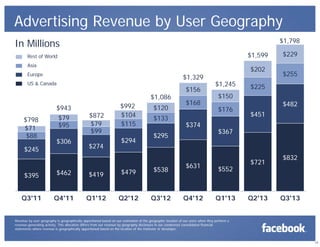
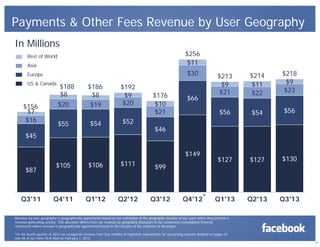
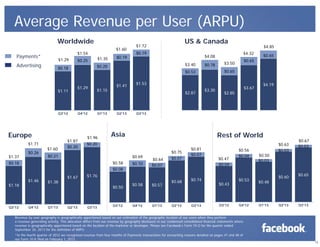
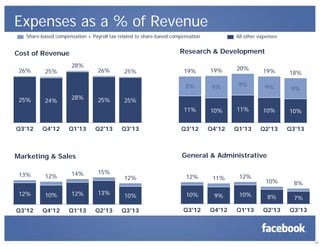
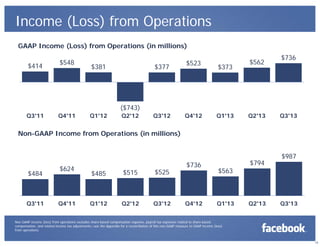
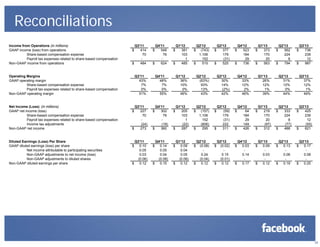
- Facebook reported increased daily and monthly active users, mobile users, and revenue in Q3 2013 compared to previous quarters. Revenue grew 47% year-over-year to over $2 billion, with strong growth in mobile and advertising revenue.
- Expenses remained steady as a percentage of revenue, while income from operations increased significantly. The number of daily and monthly active users also continued growing worldwide, with rising mobile usage.
Presentation given by CEO Jeff Weiner, and CFO Steve Sordello, at LinkedIn Q1 2016 Earnings Call. For more information, check out http://investors.linkedin.com/
Facebook, Inc. (NASDAQ: FB) reported financial results for the first quarter, which ended March 31, 2013. Pandora.vn - One of the best Technology News Websites in Vietnam: http://pandora.vn
Annie Williams Real Estate Report - March 2019Jon Weaver
2019 is slated to produce a long list of multibillion-dollar IPOs from San Francisco Bay Area heavyweights like Lyft, Uber, Palantir, Pinterest, Airbnb, Slack, Postmates, and Instacart. The result will be a massive and sudden injection of liquid cash into a region already infamous for having the nation’s priciest real estate, according to Patrick Howell O'Neill, writing for Gizmodo.
One of the projections in his article is the IPOs will produce 211 techie buyers to purchase property above $10 million, while thousands more are expected to buy above $1 million.
Shutterfly Earnings for 1Q 2014 released after market close today. Released in tandem with their conference call - which starts in about 20 minutes: http://www.media-server.com/m/p/o42tycb9
Looks like they beat by $0.05 and gave updated guidance more or less in-line with consensus. Note that Goldman upgraded the stock 2 weeks ago...
Annie Williams Real Estate Report June-July 2017Jon Weaver
Do Zillow ‘Zestimates’ mislead home buyers?
Lawsuit claims yes. Suburban Chicago home builders filed legal action last week against the real estate marketing company Zillow, whose at-your-fingertips property value approximations are misleading home buyers with lowball figures that roil sellers, the suit claims. The so-called Zestimates that the Seattle-based
Zillow app has calculated since 2006 pose as accurate appraisals in violation of the legal description in Illinois of an appraisal, which needs to be conducted by a licensed appraiser, according to the class-action complaint. Zillow, for its part, maintains that its approximations are not actual appraisals, nor do they claim to be.
Insight 12 - Digital Predictions for 2012Microsoft
My slides from the Insight 12 conference where I look at some of the issues that need to be on your digital agenda for 2012. Some are entirely tactical/platform based, but as our mobile and digital experiences become wholly social, there are much greater and important legal and permission issues that need addressing.
Telefonica Global Millennial Survey - Meet the Millennial LeadersMicrosoft
Meet the Millennial Leaders, a distinct group of young people determined to shape their own future. They can defined by their expertise with technology, a passion to participate in solving challenges facing communities and the world, and a drive to succeed.
Telefónica in partnership with the Financial Times, commissioned 12,171 online quantitative interviews among Millennials, aged 18-30, across 27 countries in six regions including North America, Latin America, Western Europe, Central and Eastern Europe, Asia, and Middle East & Africa .
Telefonica Global Millennial Survey - Latin AmericaMicrosoft
Latin American Millennials are empowered by technology, motivated to succeed and to make a difference locally.
They are not only highly comfortable with technology but also strongly believe in its ability to affect change in society.
There is optimisim about Latin American Millennial's futures but remain concerned about their regional economies.
The environment plays a large role in Latin American Millennials lives, with 52% of them believing that protecting the environment is one of the most important ways to make a difference in the world.
Telefónica in partnership with the Financial Times, commissioned 12,171 online quantitative interviews among Millennials, aged 18-30, across 27 countries in six regions including North America, Latin America, Western Europe, Central and Eastern Europe, Asia, and Middle East & Africa .
Telefonica Global Millennial Survey - AsiaMicrosoft
Millennials in Asia are highly influenced by technology largely due to the high penetration of smartphones in the region, and think technology has improved communication.
They are inspired by technology, have confidence in their economy and believe their best days are ahead of them.
Contagious content - why people share on Facebook.Microsoft
This is not my research, but I do think there's some great examples of categories of posts that really work in social form Pages 15-30. Twitter's new inline delivery of images via mobile means that many of the ideas could work there too.
Telefonica Global Millennial Survey - EuropeMicrosoft
European Millennials are highly comfortable with technology and believe it has been influential in their lives. Regional economies though, cause a high degree of concern amongst this group.
European Millennials have a strong belief that they can make a difference by addressing critical social issues, with the improvement of the access to, and quality of, education being cited as the most important areas.
Digital SWOT - the digital landscape for 2014Microsoft
My presentation from Digital SWOT 2014, a major new conference examining the increasingly pervasive digital revolution from a business point of view: essentially a SWOT analysis of how companies and organisations and/or their agencies should re-examine their commercial performance from a digital point of view.
Facebook's Investor Presentation from 2018.
We're compiling some of the investor presentations for technology start-ups. The purpose is to better understand the business as a point of reference or comparison.
I do not own this deck or any of its contents. The original deck can be found on Facebook's Investor Relations webpage as part of its required reporting.
Presentation given by CEO Jeff Weiner, and CFO Steve Sordello, at LinkedIn Q1 2014 Earnings Call. For more information, check out http://investors.linkedin.com/.
Amaze generation phase 2 final - October 2013Microsoft
The Amaze Generation are tomorrow’s society shapers. Today’s technological change is part of their lives – it’s unremarkable; they adopt it and change it at will. But how is it changing them and how will they, in turn, change society?
We are following a group of 10-15 year olds (our Amaze Generation) over a period of five years to understand their digital selves. We want to know how they evolve behaviourally, how they interact with digital tools, sites, networks… how tomorrow’s generation will communicate and shape tomorrow’s technology.
CIPR North West - Social summer 12: Community management tools and techniquesMicrosoft
As the old saying goes, technology is scalable but people are not. This is never more true than in social media. As the importance of social channels grows, how can you find the best ways to grow with the demands of your audiences? Here, we will look at some of the tools and considerations you need to take into account to make the management of your social media channels as effective as possible.
There's lots of talk about Google Plus. From the fastest growing social network to the least used, everyone has an opinion about its merits and benefits.
The one things that everybody agrees on though is that it has immense influence when it comes to search results - and happens to integrate a pretty neat social network to boot.
We've tried to put together a guide as to exactly what the benefits are and whether or not you should be looking to launch your Google Plus presence.
Let us know what you think below - have you found any other benefits to it?
How Timeline for Pages is affecting engagementMicrosoft
So today is the day that timeline for Pages becomes permanent and social media management platform provider, Wildfire, have released some very interesting research about how timeline has impacted the launch partner’s pages as well as a large number of other diverse pages. We've spent a bit of time distilling the main points down here for you to give you a taster as to how pages have been affected by the changes.
The pages were assessed BEFORE timeline was adopted on the 29th Feb and a month after. Engagement comparisons were then made between the two periods. It's worth bearing in mind that the real acid test will be a month from today - once all pages have had the chance to adopt and adapt to timeline.
My presentation from the KMP Seminar on 6th May 2010.
It was a stab at explaining some of why I think blogs are the beating heart of a social media strategy.
It's also got some good cases of how brands build up their social media presences from blogs out to other social networks.
Enjoy and download...and please link/quote if quoted/cited.
Thx, Paul
This is my presentation from the Figaro Digital even on Social Media, 28th July 2009.
The presentation focussed solely on how any business or agency can improve the effectiveness of their Twitter interactions using a variety of tools and some simple rules.
The Evolution of SEO: Insights from a Leading Digital Marketing AgencyDigital Marketing Lab
Explore the latest trends in Search Engine Optimization (SEO) and discover how modern practices are transforming business visibility. This document delves into the shift from keyword optimization to user intent, highlighting key trends such as voice search optimization, artificial intelligence, mobile-first indexing, and the importance of E-A-T principles. Enhance your online presence with expert insights from Digital Marketing Lab, your partner in maximizing SEO performance.
Exploring The Dimensions and Dynamics of Felt Obligation: A Bibliometric Anal...AJHSSR Journal
ABSTARCT: This study presents, to our knowledge, the first bibliometric analysis focusing on the concept of
"felt obligation," examining 120 articles published between 1986 and 2024. The aim of the study is to deepen our
understanding of the existing knowledge in the field of "felt obligation" and to provide guidance for further
research. The analysis is centered around the authors, countries, institutions, and keywords of the articles. The
findings highlight prominent researchers in this field, leading universities, and influential journals. Particularly,
it is identified that China plays a leading role in "felt obligation" research. The analysis of keywords emphasizes
the thematic focuses of these studies and provides a roadmap for future research. Finally, various
recommendations are presented to deepen the knowledge in this area and promote applied research. This study
serves as a foundation to expand and advance the understanding of "felt obligation" in the field.
KEYWORDS: Felt Obligation, Bibliometric Analysis, Research Trends
Grow Your Reddit Community Fast.........SocioCosmos
Sociocosmos helps you gain Reddit followers quickly and easily. Build your community and expand your influence.
https://www.sociocosmos.com/product-category/reddit/
This tutorial presentation provides a step-by-step guide on how to use Facebook, the popular social media platform. In simple and easy-to-understand language, this presentation explains how to create a Facebook account, connect with friends and family, post updates, share photos and videos, join groups, and manage privacy settings. Whether you're new to Facebook or just need a refresher, this presentation will help you navigate the features and make the most of your Facebook experience.
Telegram is a messaging platform that ushers in a new era of communication. Available for Android, Windows, Mac, and Linux, Telegram offers simplicity, privacy, synchronization across devices, speed, and powerful features. It allows users to create their own stickers with a user-friendly editor. With robust encryption, Telegram ensures message security and even offers self-destructing messages. The platform is open, with an API and source code accessible to everyone, making it a secure and social environment where groups can accommodate up to 200,000 members. Customize your messenger experience with Telegram's expressive features.
Surat Digital Marketing School is created to offer a complete course that is specifically designed as per the current industry trends. Years of experience has helped us identify and understand the graduate-employee skills gap in the industry. At our school, we keep up with the pace of the industry and impart a holistic education that encompasses all the latest concepts of the Digital world so that our graduates can effortlessly integrate into the assigned roles.
This is the place where you become a Digital Marketing Expert.
This tutorial presentation offers a beginner-friendly guide to using THREADS, Instagram's messaging app. It covers the basics of account setup, privacy settings, and explores the core features such as close friends lists, photo and video sharing, creative tools, and status updates. With practical tips and instructions, this tutorial will empower you to use THREADS effectively and stay connected with your close friends on Instagram in a private and engaging way.
Unlock TikTok Success with Sociocosmos..SocioCosmos
Discover how Sociocosmos can boost your TikTok presence with real followers and engagement. Achieve your social media goals today!
https://www.sociocosmos.com/product-category/tiktok/
Your Path to YouTube Stardom Starts HereSocioCosmos
Skyrocket your YouTube presence with Sociocosmos' proven methods. Gain real engagement and build a loyal audience. Join us now.
https://www.sociocosmos.com/product-category/youtube/
Your LinkedIn Success Starts Here.......SocioCosmos
In order to make a lasting impression on your sector, SocioCosmos provides customized solutions to improve your LinkedIn profile.
https://www.sociocosmos.com/product-category/linkedin/
Project Serenity is an innovative initiative aimed at transforming urban environments into sustainable, self-sufficient communities. By integrating green architecture, renewable energy, smart technology, sustainable transportation, and urban farming, Project Serenity seeks to minimize the ecological footprint of cities while enhancing residents' quality of life. Key components include energy-efficient buildings, IoT-enabled resource management, electric and autonomous transportation options, green spaces, and robust waste management systems. Emphasizing community engagement and social equity, Project Serenity aspires to serve as a global model for creating eco-friendly, livable urban spaces that harmonize modern conveniences with environmental stewardship.
Buy Pinterest Followers, Reactions & Repins Go Viral on Pinterest with Socio...SocioCosmos
Get more Pinterest followers, reactions, and repins with Sociocosmos, the leading platform to buy all kinds of Pinterest presence. Boost your profile and reach a wider audience.
https://www.sociocosmos.com/product-category/pinterest/
Improving Workplace Safety Performance in Malaysian SMEs: The Role of Safety ...AJHSSR Journal
ABSTRACT: In the Malaysian context, small and medium enterprises (SMEs) experience a significant
burden of workplace accidents. A consensus among scholars attributes a substantial portion of these incidents to
human factors, particularly unsafe behaviors. This study, conducted in Malaysia's northern region, specifically
targeted Safety and Health/Human Resource professionals within the manufacturing sector of SMEs. We
gathered a robust dataset comprising 107 responses through a meticulously designed self-administered
questionnaire. Employing advanced partial least squares-structural equation modeling (PLS-SEM) techniques
with SmartPLS 3.2.9, we rigorously analyzed the data to scrutinize the intricate relationship between safety
behavior and safety performance. The research findings unequivocally underscore the palpable and
consequential impact of safety behavior variables, namely safety compliance and safety participation, on
improving safety performance indicators such as accidents, injuries, and property damages. These results
strongly validate research hypotheses. Consequently, this study highlights the pivotal significance of cultivating
safety behavior among employees, particularly in resource-constrained SME settings, as an essential step toward
enhancing workplace safety performance.
KEYWORDS :Safety compliance, safety participation, safety performance, SME
EASY TUTORIAL OF HOW TO USE G-TEAMS BY: FEBLESS HERNANEFebless Hernane
Using Google Teams (G-Teams) is simple. Start by opening the Google Teams app on your phone or visiting the G-Teams website on your computer. Sign in with your Google account. To join a meeting, click on the link shared by the organizer or enter the meeting code in the "Join a Meeting" section. To start a meeting, click on "New Meeting" and share the link with others. You can use the chat feature to send messages and the video button to turn your camera on or off. G-Teams makes it easy to connect and collaborate with others!
2. Non-GAAP Measures
In addition to U.S. GAAP financials, this presentation includes certain non-GAAP financial measures. These
non-GAAP measures are in addition to, not a substitute for or superior to, measures of financial performance
prepared in accordance with U.S. GAAP. A reconciliation of non-GAAP financial measures to the corresponding
GAAP measures is provided in the appendix to this presentation.
2
3. Daily Active Users (DAUs)
In Millions
Rest of World
Asia
Europe
526
US & Canada
457
100
483
109
126
552
139
584
152
618
161
153
665
180
699
195
728
208
167
181
189
105
119
129
141
143
154
160
169
179
182
188
135
152
124
126
129
130
132
135
139
142
144
Q3'11
Q4'11
Q1'12
Q2'12
Q3'12
Q4'12
Q1'13
Q2'13
Q3'13
98
DAUs / MAUs
Q3'11
Q4'11
Q1'12
Q2'12
Q3'12
Q4'12
Q1'13
Q2'13
Q3’13
57%
57%
58%
58%
58%
59%
60%
61%
61%
Please see Facebook's most recent Form 10-Q filed with the SEC for definitions of user activity used to determine the number of our DAUs, MAUs, and mobile
MAUs. The number of DAUs, MAUs, and mobile MAUs do not include Instagram users unless they would otherwise qualify as such users, respectively, based on
their other activities on Facebook.
3
4. Monthly Active Users (MAUs)
In Millions
Rest of World
Asia
1,007
Europe
US & Canada
800
207
845
225
901
245
1,056
955
268
288
304
1,110
327
277
298
319
1,155
1,189
346
362
339
351
196
212
234
255
221
229
239
246
253
261
269
272
276
176
179
183
186
189
193
195
198
199
Q3'11
Q4'11
Q1'12
Q2'12
Q3'12
Q4'12
Q1'13
Q2'13
Q3'13
Please see Facebook's most recent Form 10-Q filed with the SEC for definitions of user activity used to determine the number of our DAUs, MAUs, and mobile
MAUs. The number of DAUs, MAUs, and mobile MAUs do not include Instagram users unless they would otherwise qualify as such users, respectively, based on
their other activities on Facebook.
4
5. Mobile Daily Active Users (Mobile DAUs)
In Millions
469
507
425
374
329
Q3'12
Q4'12
Q1'13
Q2'13
Q3'13
Mobile DAUs are defined as users who accessed Facebook through our mobile apps or our mobile website during a given day. The number of mobile DAUs
do not include Instagram users unless they would otherwise qualify as such users based on their other activities on Facebook.
5
6. Mobile Monthly Active Users (Mobile MAUs)
In Millions
819
874
751
680
376
Q3'11
432
Q4'11
488
Q1'12
543
Q2'12
604
Q3'12
Q4'12
Q1'13
Q2'13
Q3'13
Please see Facebook's most recent Form 10-Q filed with the SEC for definitions of user activity used to determine the number of our DAUs, MAUs, and mobile
MAUs. The number of DAUs, MAUs, and mobile MAUs do not include Instagram users unless they would otherwise qualify as such users, respectively, based on
their other activities on Facebook.
6
7. Mobile-Only Monthly Active Users (Mobile-Only MAUs)
In Millions
254
219
189
157
126
Q3'12
Q4'12
Q1'13
Q2'13
Q3'13
Mobile-only MAUs are defined as users who accessed Facebook solely through mobile apps or our mobile website during a given month. The number of
mobile-only MAUs do not include Instagram users unless they would otherwise qualify as such users based on their other activities on Facebook.
7
8. Revenue
In Millions
$2,016
Payments and other fees
Advertising
$1,813
$214
$1,585
$1,131
$954
$188
$156
$1,184
$1,058
$192
$1,262
$256
*
Q3'11
$1,458
$213
$176
$186
$1,798
$1,599
$1,329
$798
$218
$943
$872
Q4'11
Q1'12
$992
Q2'12
$1,086
Q3'12
Q4'12
$1,245
Q1'13
Q2'13
Q3'13
*In the fourth quarter of 2012 we recognized revenue from four months of Payments transactions for accounting reasons detailed on pages 47 and 48 of our
Form 10-K filed on February 1, 2013.
8
9. Revenue by User Geography
In Millions
$2,016
Rest of World
Asia
$1,813
Europe
$167
$954
$78
$104
$213
$1,585
US & Canada
$1,131
$87
$115
$361
$290
$1,058
$87
$118
$328
$1,184
$113
$135
$346
$482
$567
$525
$590
Q3'11
Q4'11
Q1'12
Q2'12
$1,262
$198
$440
Q3'12
$278
$247
$538
$505
$423
$341
$637
$159
$197
$130
$154
$1,458
$238
$780
Q4'12
$679
Q1'13
$848
Q2'13
$962
Q3'13
Revenue by user geography is geographically apportioned based on our estimation of the geographic location of our users when they perform a
revenue-generating activity. This allocation differs from our revenue by geography disclosure in our condensed consolidated financial
statements where revenue is geographically apportioned based on the location of the marketer or developer.
9
10. Advertising Revenue by User Geography
$1,798
In Millions
$1,599
Rest of World
Asia
Europe
$1,329
US & Canada
$1,086
$798
$71
$88
$245
$943
$79
$95
$306
$872
$79
$99
$274
$992
$104
$115
$294
$395
$462
$419
$479
Q3'11
Q4'11
Q1'12
Q2'12
$120
$133
$156
$168
$374
$295
$538
Q3'12
$202
$1,245
$255
$225
$150
$176
$229
$482
$451
$367
$631
$552
Q4'12
Q1'13
$721
Q2'13
$832
Q3'13
Revenue by user geography is geographically apportioned based on our estimation of the geographic location of our users when they perform a
revenue-generating activity. This allocation differs from our revenue by geography disclosure in our condensed consolidated financial
statements where revenue is geographically apportioned based on the location of the marketer or developer.
10
11. Payments & Other Fees Revenue by User Geography
In Millions
$256
$11
Rest of World
Asia
$30
Europe
US & Canada
$156
$7
$16
$188
$8
$20
$55
$186
$8
$19
$192
$9
$20
$54
$52
$45
$176
$10
$21
$87
Q3'11
$105
$106
Q4'11
Q1'12
Q2'12
$218
$9
$23
$54
$56
$127
$127
$130
Q1'13
Q2'13
Q3'13
$46
$149
$111
$214
$11
$22
$56
$66
$213
$9
$21
$99
Q3'12
Q4'12 *
Revenue by user geography is geographically apportioned based on our estimation of the geographic location of our users when they perform a
revenue-generating activity. This allocation differs from our revenue by geography disclosure in our condensed consolidated financial
statements where revenue is geographically apportioned based on the location of the marketer or developer.
*In the fourth quarter of 2012 we recognized revenue from four months of Payments transactions for accounting reasons detailed on pages 47
and 48 of our Form 10-K filed on February 1, 2013.
11
12. Average Revenue per User (ARPU)
Worldwide
$1.54
Payments*
$1.29
Advertising
$1.37
$0.26
$1.60
$1.29
$1.15
Q4'12
$1.87
$0.20
Q1'13
$1.96
$0.20
Q3'12
$1.41
$1.38
$1.67
Q1'13
Q2'13
$0.10
$0.64
$0.07
$0.75
$0.07
$1.76
Q3'13
Q3'12
$3.50
$0.65
$3.30
$4.19
$3.67
$2.85
Rest of World
$0.69
$0.50
Q4'12
$0.78
$0.65
$0.65
Q3'13
Asia
$0.21
$4.32
$1.53
$2.87
Q2'13
$4.85
$4.08
$3.40
$0.58
$0.08
$1.46
$0.19
$0.53
$0.18
$1.18
$0.19
$0.20
Q3'12
Europe
$1.35
$0.25
$0.18
$1.11
$1.71
$1.60
US & Canada
$1.72
$0.58
$0.57
Q4'12
Q1'13
$0.68
Q2'13
$0.81
$0.07
$0.74
Q3'13
$0.47
$0.04
$0.43
Q3'12
$0.56
$0.04
$0.53
Q4'12
$0.50
$0.03
$0.48
Q1'13
$0.63
$0.03
$0.60
Q2'13
$0.67
$0.03
$0.65
Q3'13
Revenue by user geography is geographically apportioned based on our estimation of the geographic location of our users when they perform
a revenue-generating activity. This allocation differs from our revenue by geography disclosure in our condensed consolidated financial statements where
revenue is geographically apportioned based on the location of the marketer or developer. Please see Facebook’s Form 10-Q for the quarter ended
September 30, 2013 for the definition of ARPU.
*In the fourth quarter of 2012 we recognized revenue from four months of Payments transactions for accounting reasons detailed on pages 47 and 48 of
our Form 10-K filed on February 1, 2013.
12
14. Expenses as a % of Revenue
Share-based compensation + Payroll tax related to share-based compensation
All other expenses
Research & Development
Cost of Revenue
28%
Q3'12
24%
Q4'12
28%
Q1'13
26%
25%
Q2'13
25%
20%
19%
18%
9%
9%
9%
9%
10%
11%
10%
10%
Q3'12
Q4'12
Q1'13
Q2'13
Q3'13
25%
Q3'13
General & Administrative
Marketing & Sales
15%
12%
14%
12%
10%
12%
13%
Q3'12
Q4'12
Q1'13
Q2'13
13%
19%
11%
25%
25%
19%
8%
26%
12%
12%
11%
12%
10%
10%
9%
Q3'13
Q3'12
Q4'12
10%
8%
10%
8%
7%
Q1'13
Q2'13
Q3'13
14
15. Income (Loss) from Operations
GAAP Income (Loss) from Operations (in millions)
$414
$548
$381
$377
$523
$373
$562
$736
($743)
Q3'11
Q4'11
Q1'12
Q2'12
Q3'12
Q4'12
Q1'13
Q2'13
Q3'13
Non-GAAP Income from Operations (in millions)
$484
Q3'11
$624
Q4'11
$485
$515
$525
Q1'12
Q2'12
Q3'12
$736
Q4'12
$563
Q1'13
$794
Q2'13
$987
Q3'13
Non-GAAP income (loss) from operations excludes share-based compensation expense, payroll tax expenses related to share-based
compensation, and related income tax adjustments—see the Appendix for a reconciliation of this non-GAAP measure to GAAP income (loss)
from operations.
15
16. Operating Margin
GAAP Operating Margin
43%
48%
30%
33%
26%
31%
37%
Q2'12
Q3'12
Q4'12
Q1'13
Q2'13
Q3'13
46%
43%
42%
Q1'12
Q2'12
Q3'12
36%
(63%)
Q3'11
Q4'11
Q1'12
Non-GAAP Operating Margin
51%
Q3'11
55%
Q4'11
46%
Q4'12
39%
Q1'13
44%
Q2'13
49%
Q3'13
Non-GAAP operating margin excludes share-based compensation expense, payroll tax expenses related to share-based compensation, and
related income tax adjustments—see the Appendix for a reconciliation of this non-GAAP measure to GAAP operating margin.
16
17. Effective Tax Rate
GAAP Effective Tax Rate
($ in millions)
GAAP (loss) income before provision for income taxes
GAAP (provision for) benefit from income taxes
Effective Tax Rate
Q2
2012
$
(765)
608
79%
Q3
2012
$
372
(431)
116%
Q4
2012
$
505
(441)
87%
Q1
2013
353
(134)
38%
Q2
2013
545
(212)
39%
FY
2011
1,695
(695)
41%
FY
2012
494
(441)
89%
Q2
2012
493
198
40%
Q3
2012
520
209
40%
Q4
2012
718
292
41%
Q1
2013
543
231
43%
Q2
2013
777
289
37%
FY
2011
1,919
755
39%
FY
2012
2,217
900
41%
Non-GAAP Effective Tax Rate
($ in millions)
Non-GAAP income before provision for income taxes
Non-GAAP provision for income taxes
Effective Tax Rate
Q3’12 through Q4’12 GAAP effective tax rates were influenced by significant share-based compensation expense resulting from our initial public
offering, a portion of which is not tax-deductible—see the Appendix for a reconciliation of this non-GAAP measure to GAAP effective tax rate.
17
18. Net Income (Loss)
GAAP Net Income (Loss) (in millions)
$227
$302
$205
$64
($157)
Q3'11
Q4'11
Q1'12
Q2'12
$219
$333
$425
Q2'13
Q3'13
($59)
Q3'12
Q4'12
Q1'13
Non-GAAP Net Income (in millions)
$273
Q3'11
$360
$287
$295
$311
Q4'11
Q1'12
Q2'12
Q3'12
$426
Q4'12
$312
Q1'13
$488
Q2'13
$621
Q3'13
Non-GAAP net income excludes share-based compensation expense, payroll tax expenses related to share-based compensation, and related
income tax adjustments—see the Appendix for a reconciliation of this non-GAAP measure to GAAP net income.
18
19. Diluted EPS
GAAP Diluted EPS
$0.10
$0.14
$0.09
$0.09
$0.13
$0.17
$0.03
($0.02)
Q3'11
Q4'11
Q1'12
($0.08)
Q2'12
Q3'12
Q4'12
Q1'13
Q2'13
Q3'13
Non-GAAP Diluted EPS
$0.25
$0.12
Q3'11
$0.15
Q4'11
$0.12
$0.12
$0.12
Q1'12
Q2'12
Q3'12
$0.17
Q4'12
$0.19
$0.12
Q1'13
Q2'13
Q3'13
Non-GAAP diluted EPS excludes share-based compensation expense, payroll tax expenses related to share-based compensation, and related
income tax adjustments—see the Appendix for a reconciliation of this non-GAAP measure to GAAP diluted EPS.
19
20. Capital Investments
In Millions
$1,575
Property and equipment acquired
under capital leases
Purchases of property
$340
and equipment
$1,288
$1,079
$251
$890
$11
$473
$1,235
$510
$1,037
$879
$217
$606
$293
2012
2013
YTD
2010
2011
2012
Annual
20
25. Limitations of Key Metrics and Other Data
The numbers for our key metrics, daily active users (DAUs), monthly active users (MAUs), mobile MAUs, and average
revenue per user (ARPU), and certain other metrics such as mobile DAUs and mobile-only MAUs, are calculated using
internal company data based on the activity of user accounts. While these numbers are based on what we believe to be
reasonable estimates of our user base for the applicable period of measurement, there are inherent challenges in measuring
usage of our products across large online and mobile populations around the world. For example, there may be individuals
who maintain one or more Facebook accounts in violation of our terms of service, despite our efforts to detect and suppress
such behavior. We estimate, for example, that “duplicate” accounts (an account that a user maintains in addition to his or her
principal account) may have represented between approximately 4.3% and 7.9% of our worldwide MAUs during the nine
months ended September 30, 2013. We also seek to identify “false” accounts, which we divide into two categories: (1) usermisclassified accounts, where users have created personal profiles for a business, organization, or non-human entity such
as a pet (such entities are permitted on Facebook using a Page rather than a personal profile under our terms of service);
and (2) undesirable accounts, which represent user profiles that we determine are intended to be used for purposes that
violate our terms of service, such as spamming. During the nine months ended September 30, 2013, for example, we
estimate user-misclassified accounts may have represented between approximately 0.8% and 2.1% of our worldwide MAUs
and undesirable accounts may have represented between approximately 0.4% and 1.2% of our worldwide MAUs. We
believe the percentage of accounts that are duplicate or false is meaningfully lower in developed markets such as the United
States or the United Kingdom and higher in developing markets such as India and Turkey. However, these estimates are
based on an internal review of a limited sample of accounts and we apply significant judgment in making this determination,
such as identifying names that appear to be fake or other behavior that appears inauthentic to the reviewers. As such, our
estimation of duplicate or false accounts may not accurately represent the actual number of such accounts. We are
continually seeking to improve our ability to identify duplicate or false accounts and estimate the total number of such
accounts, and such estimates may be affected by improvements or changes in our methodology. Due to inherent variability
in such estimates at particular dates of measurement, we disclose these estimates as a range over a recent period.
25
26. Limitations of Key Metrics and Other Data (cont.)
Our data limitations may affect our understanding of certain details of our business. For example, while user-provided data indicates a
decline in usage among younger users, this age data is unreliable because a disproportionate number of our younger users register
with an inaccurate age. We have worked with third parties to develop models to analyze user data by age in the United States. These
models suggest that usage by U.S. teens overall continues to be stable, but that there has recently been a decline in DAU among
younger U.S. teens. The data and models we are using are not precise and our understanding of usage by age group may not be
complete.
Some of our historical metrics through the second quarter of 2012 have also been affected by applications on certain mobile devices
that automatically contact our servers for regular updates with no user action involved, and this activity can cause our system to count
the user associated with such a device as an active user on the day such contact occurs. For example, we estimate that less than 5% of
our estimated worldwide DAUs as of December 31, 2011 and 2010 resulted from this type of automatic mobile activity, and that this type
of activity had a substantially smaller effect on our estimate of worldwide MAUs and mobile MAUs. The impact of this automatic activity
on our metrics varies by geography because mobile usage varies in different regions of the world. In addition, our data regarding the
geographic location of our users is estimated based on a number of factors, such as the user’s IP address and self-disclosed location.
These factors may not always accurately reflect the user’s actual location. For example, a mobile-only user may appear to be accessing
Facebook from the location of the proxy server that the user connects to rather than from the user’s actual location. The methodologies
used to measure user metrics may also be susceptible to algorithm or other technical errors. For example, in early June 2012, we
discovered an error in the algorithm we used to estimate the geographic location of our users that affected our attribution of certain user
locations for the period ended March 31, 2012. While this issue did not affect our overall worldwide MAU and DAU numbers, it did affect
our attribution of users to different geographic regions. We estimate that the number of MAUs as of March 31, 2012 for the United
States & Canada region was overstated as a result of the error by approximately 3% and this overstatement was offset by
understatements in other regions. In addition, our estimates for revenue by user location are also affected by these factors. We regularly
review and may adjust our processes for calculating these metrics to improve their accuracy. In addition, our MAU and DAU estimates
will differ from estimates published by third parties due to differences in methodology. For example, some third parties are not able to
accurately measure mobile users or do not count mobile users for certain user groups or at all in their analyses.
The numbers of DAUs, MAUs, mobile DAUs, mobile MAUs, and mobile-only MAUs discussed in these slides, as well as ARPU, do not
include users of Instagram unless they would otherwise qualify as such users, respectively, based on their other activities on Facebook.
26