More Related Content Similar to Campstone Offering Memorandum 5-12-16 Similar to Campstone Offering Memorandum 5-12-16 (20) 1. 8865 E. Via De Ventura, Suite G-200
Scottsdale, AZ 85258
480 | 922 | 2433 Ph 480 | 922 | 2434 Fax
www.suncommercialre.com
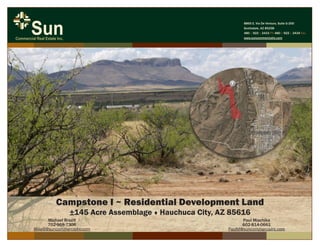
Campstone I ~ Residential Development Land
±145 Acre Assemblage ♦ Hauchuca City, AZ 85616
Michael Brazill
702-968-7306
MikeB@suncommercialre.com
Paul Miachika
602-814-0661
PaulM@suncommercialre.com
3. Campstone
Investment Highlights
THE OFFERING
Sun Commercial Real Estate, Inc. is pleased to offer the Campstone I 145 Acre Land Assemblage for sale. The assemblage is part
of a former planned residential development project for approximately 192 home sites. The parcels are located to the southwest of
the intersection of AZ Highway 90 and Mustang Road in Hauchuca City, AZ 85616. The property is located in close proximity to Ft.
Hauchuca, Sierra Vista and the Kartchner Caverns State Park. The property offers incredible views from high elevations. Parcels
consist of road networks and lots for home site development.
ASKING PRICE
$795,000,000
INVESTMENT HIGHLIGHTS
• Property is ready for residential development
• Abundant water supply available
• Close proximity to the Sonoita Wine Country
• Only 7 miles from Ft. Hauchuca US Army Facility
• Sierra Vista Municipal Airport located 7 miles to the south of the property
• Hauchuca City government is very supportive of development
• Located just off busy AZ Hwy 90 and only 65 miles southeast Tuscon, AZ
Campstone
PROPERTY LOCATION
The Property is located to the southwest intersection of AZ Hwy 90 and Mustang Road, having the closest civic address of 200 W
Mustang Rd, Hauchuca City, AZ 85616.
ASSESSOR PARCEL NUMBERS
106-47-52G, 106-47-162H, 106-47-156, 106-47-157
SITE SIZE - ACRES
±145 acres
4. Campstone
Property Overview
Property Location:
Assessor Parcel Number:
Site Size - Acres:
The Property is located to the southwest intersection of AZ Hwy 90 and Mustang Road, having the closest
civic address of 200 W Mustang Rd, Hauchuca City, AZ 85616.
106-47-52G, 106-47-162H, 106-47-156, 106-47-157
±145 acres
Campstone
9. Campstone
Demographic and Income Profile
2722 Perimeter Rd, North Las Vegas, Nevada, 89032 Prepared by Esri
Ring: 1 mile radius Latitude: 36.20790
Longitude: -115.20218
Summary Census 2010 2015 2020
Population 10,877 11,294 11,802
Households 3,800 3,907 4,068
Families 2,612 2,664 2,765
Average Household Size 2.85 2.88 2.89
Owner Occupied Housing Units 1,964 1,836 1,896
Renter Occupied Housing Units 1,836 2,072 2,172
Median Age 33.7 34.6 35.2
Trends: 2015 - 2020 Annual Rate Area State National
Population 0.88% 1.27% 0.75%
Households 0.81% 1.25% 0.77%
Families 0.75% 1.20% 0.69%
Owner HHs 0.65% 1.25% 0.70%
Median Household Income 2.59% 2.42% 2.66%
2015 2020
Households by Income Number Percent Number Percent
<$15,000 443 11.3% 423 10.4%
$15,000 - $24,999 579 14.8% 469 11.5%
$25,000 - $34,999 500 12.8% 506 12.4%
$35,000 - $49,999 613 15.7% 607 14.9%
$50,000 - $74,999 851 21.8% 860 21.1%
$75,000 - $99,999 403 10.3% 510 12.5%
$100,000 - $149,999 376 9.6% 506 12.4%
$150,000 - $199,999 110 2.8% 149 3.7%
$200,000+ 32 0.8% 39 1.0%
Median Household Income $44,476 $50,544
Average Household Income $55,626 $62,745
Per Capita Income $19,358 $21,736
Census 2010 2015 2020
Population by Age Number Percent Number Percent Number Percent
0 - 4 934 8.6% 889 7.9% 908 7.7%
5 - 9 834 7.7% 872 7.7% 859 7.3%
10 - 14 791 7.3% 795 7.0% 875 7.4%
15 - 19 767 7.1% 730 6.5% 744 6.3%
20 - 24 718 6.6% 813 7.2% 740 6.3%
25 - 34 1,595 14.7% 1,608 14.2% 1,748 14.8%
35 - 44 1,484 13.6% 1,452 12.9% 1,514 12.8%
45 - 54 1,485 13.7% 1,460 12.9% 1,382 11.7%
55 - 64 1,135 10.4% 1,261 11.2% 1,350 11.4%
65 - 74 699 6.4% 893 7.9% 1,038 8.8%
75 - 84 325 3.0% 384 3.4% 498 4.2%
85+ 110 1.0% 136 1.2% 147 1.2%
Census 2010 2015 2020
Race and Ethnicity Number Percent Number Percent Number Percent
White Alone 5,262 48.4% 5,127 45.4% 4,971 42.1%
Black Alone 2,343 21.5% 2,558 22.6% 2,769 23.5%
American Indian Alone 104 1.0% 105 0.9% 106 0.9%
Asian Alone 508 4.7% 559 4.9% 627 5.3%
Pacific Islander Alone 57 0.5% 57 0.5% 60 0.5%
Some Other Race Alone 2,068 19.0% 2,306 20.4% 2,637 22.3%
Two or More Races 535 4.9% 583 5.2% 632 5.4%
Hispanic Origin (Any Race) 3,898 35.8% 4,304 38.1% 4,799 40.7%
Data Note: Income is expressed in current dollars.
Source: U.S. Census Bureau, Census 2010 Summary File 1. Esri forecasts for 2015 and 2020.
March 14, 2016
©2015 Esri Page 1 of 6
Demographic and Income Profile
2722 Perimeter Rd, North Las Vegas, Nevada, 89032 Prepared by Esri
Ring: 1 mile radius Latitude: 36.20790
Longitude: -115.20218
Area
State
USA
Trends 2015-2020Trends 2015-2020
AnnualRate(inpercent)
2.5
2
1.5
1
0.5
0
Population Households Families Owner HHs Median HH Income
2015
2020
Population by AgePopulation by Age
Percent
14
12
10
8
6
4
2
0
0-4 5-9 10-14 15-19 20-24 25-34 35-44 45-54 55-64 65-74 75-84 85+
2015 Household Income2015 Household Income
<$15K
11.3%
$15K - $24K
14.8%
$25K - $34K
12.8%
$35K - $49K
15.7%
$50K - $74K
21.8% $75K - $99K
10.3%
$100K - $149K
9.6%
$150K - $199K
2.8%
$200K+
0.8%
2015 Population by Race2015 Population by Race
Percent
45
40
35
30
25
20
15
10
5
0
White Black Am. Ind. Asian Pacific Other Two+
2015 Percent Hispanic Origin: 38.1%
Source: U.S. Census Bureau, Census 2010 Summary File 1. Esri forecasts for 2015 and 2020.
March 14, 2016
©2015 Esri Page 2 of 6
Area Demographics (1 Mile Radius)
10. Campstone
Demographic and Income Profile
2722 Perimeter Rd, North Las Vegas, Nevada, 89032 Prepared by Esri
Ring: 3 mile radius Latitude: 36.20790
Longitude: -115.20218
Summary Census 2010 2015 2020
Population 167,106 173,734 183,000
Households 57,258 59,334 62,433
Families 38,864 40,016 42,006
Average Household Size 2.90 2.91 2.92
Owner Occupied Housing Units 30,738 29,370 30,723
Renter Occupied Housing Units 26,520 29,964 31,710
Median Age 33.5 34.0 34.2
Trends: 2015 - 2020 Annual Rate Area State National
Population 1.04% 1.27% 0.75%
Households 1.02% 1.25% 0.77%
Families 0.98% 1.20% 0.69%
Owner HHs 0.90% 1.25% 0.70%
Median Household Income 2.71% 2.42% 2.66%
2015 2020
Households by Income Number Percent Number Percent
<$15,000 7,765 13.1% 7,716 12.4%
$15,000 - $24,999 7,640 12.9% 6,005 9.6%
$25,000 - $34,999 7,491 12.6% 6,897 11.0%
$35,000 - $49,999 9,453 15.9% 9,789 15.7%
$50,000 - $74,999 12,149 20.5% 12,473 20.0%
$75,000 - $99,999 6,820 11.5% 8,813 14.1%
$100,000 - $149,999 6,239 10.5% 8,323 13.3%
$150,000 - $199,999 1,227 2.1% 1,746 2.8%
$200,000+ 551 0.9% 671 1.1%
Median Household Income $44,679 $51,063
Average Household Income $55,572 $62,834
Per Capita Income $19,224 $21,662
Census 2010 2015 2020
Population by Age Number Percent Number Percent Number Percent
0 - 4 13,340 8.0% 13,316 7.7% 14,027 7.7%
5 - 9 12,789 7.7% 12,792 7.4% 13,365 7.3%
10 - 14 12,389 7.4% 12,280 7.1% 13,126 7.2%
15 - 19 12,680 7.6% 11,706 6.7% 12,074 6.6%
20 - 24 11,980 7.2% 13,558 7.8% 12,247 6.7%
25 - 34 23,979 14.3% 25,738 14.8% 28,932 15.8%
35 - 44 23,032 13.8% 22,009 12.7% 23,355 12.8%
45 - 54 22,426 13.4% 22,016 12.7% 21,040 11.5%
55 - 64 16,703 10.0% 19,019 10.9% 20,337 11.1%
65 - 74 10,433 6.2% 12,865 7.4% 14,593 8.0%
75 - 84 5,546 3.3% 6,255 3.6% 7,425 4.1%
85+ 1,809 1.1% 2,180 1.3% 2,479 1.4%
Census 2010 2015 2020
Race and Ethnicity Number Percent Number Percent Number Percent
White Alone 84,965 50.8% 83,557 48.1% 82,515 45.1%
Black Alone 31,480 18.8% 34,130 19.6% 37,027 20.2%
American Indian Alone 1,344 0.8% 1,381 0.8% 1,419 0.8%
Asian Alone 7,175 4.3% 7,877 4.5% 8,941 4.9%
Pacific Islander Alone 1,177 0.7% 1,228 0.7% 1,328 0.7%
Some Other Race Alone 32,105 19.2% 35,768 20.6% 40,933 22.4%
Two or More Races 8,860 5.3% 9,793 5.6% 10,836 5.9%
Hispanic Origin (Any Race) 63,774 38.2% 70,344 40.5% 78,644 43.0%
Data Note: Income is expressed in current dollars.
Source: U.S. Census Bureau, Census 2010 Summary File 1. Esri forecasts for 2015 and 2020.
March 14, 2016
©2015 Esri Page 3 of 6
Demographic and Income Profile
2722 Perimeter Rd, North Las Vegas, Nevada, 89032 Prepared by Esri
Ring: 3 mile radius Latitude: 36.20790
Longitude: -115.20218
Area
State
USA
Trends 2015-2020Trends 2015-2020
AnnualRate(inpercent)
2.5
2
1.5
1
0.5
0
Population Households Families Owner HHs Median HH Income
2015
2020
Population by AgePopulation by Age
Percent
14
12
10
8
6
4
2
0
0-4 5-9 10-14 15-19 20-24 25-34 35-44 45-54 55-64 65-74 75-84 85+
2015 Household Income2015 Household Income
<$15K
13.1%
$15K - $24K
12.9%
$25K - $34K
12.6%
$35K - $49K
15.9%
$50K - $74K
20.5% $75K - $99K
11.5%
$100K - $149K
10.5%
$150K - $199K
2.1%
$200K+
0.9%
2015 Population by Race2015 Population by Race
Percent
45
40
35
30
25
20
15
10
5
0
White Black Am. Ind. Asian Pacific Other Two+
2015 Percent Hispanic Origin: 40.5%
Source: U.S. Census Bureau, Census 2010 Summary File 1. Esri forecasts for 2015 and 2020.
March 14, 2016
©2015 Esri Page 4 of 6
Area Demographics (3 Mile Radius)
11. Campstone
Demographic and Income Profile
2722 Perimeter Rd, North Las Vegas, Nevada, 89032 Prepared by Esri
Ring: 5 mile radius Latitude: 36.20790
Longitude: -115.20218
Summary Census 2010 2015 2020
Population 444,388 462,080 486,302
Households 154,348 160,007 168,445
Families 102,609 105,625 110,840
Average Household Size 2.82 2.83 2.83
Owner Occupied Housing Units 84,721 81,763 85,612
Renter Occupied Housing Units 69,627 78,243 82,833
Median Age 34.9 35.5 35.5
Trends: 2015 - 2020 Annual Rate Area State National
Population 1.03% 1.27% 0.75%
Households 1.03% 1.25% 0.77%
Families 0.97% 1.20% 0.69%
Owner HHs 0.92% 1.25% 0.70%
Median Household Income 2.36% 2.42% 2.66%
2015 2020
Households by Income Number Percent Number Percent
<$15,000 22,195 13.9% 22,085 13.1%
$15,000 - $24,999 18,461 11.5% 14,499 8.6%
$25,000 - $34,999 19,262 12.0% 18,074 10.7%
$35,000 - $49,999 23,302 14.6% 23,920 14.2%
$50,000 - $74,999 31,216 19.5% 31,345 18.6%
$75,000 - $99,999 19,574 12.2% 24,631 14.6%
$100,000 - $149,999 18,072 11.3% 23,311 13.8%
$150,000 - $199,999 4,926 3.1% 7,006 4.2%
$200,000+ 2,991 1.9% 3,564 2.1%
Median Household Income $47,310 $53,159
Average Household Income $60,487 $68,193
Per Capita Income $21,615 $24,262
Census 2010 2015 2020
Population by Age Number Percent Number Percent Number Percent
0 - 4 33,075 7.4% 33,081 7.2% 34,908 7.2%
5 - 9 32,537 7.3% 31,764 6.9% 32,959 6.8%
10 - 14 32,430 7.3% 31,539 6.8% 32,702 6.7%
15 - 19 32,679 7.4% 30,731 6.7% 31,034 6.4%
20 - 24 29,606 6.7% 34,407 7.4% 31,910 6.6%
25 - 34 62,477 14.1% 66,371 14.4% 76,005 15.6%
35 - 44 63,749 14.3% 60,821 13.2% 63,310 13.0%
45 - 54 61,456 13.8% 61,207 13.2% 58,699 12.1%
55 - 64 47,128 10.6% 52,866 11.4% 56,031 11.5%
65 - 74 29,053 6.5% 36,080 7.8% 41,449 8.5%
75 - 84 15,345 3.5% 17,282 3.7% 20,588 4.2%
85+ 4,853 1.1% 5,928 1.3% 6,709 1.4%
Census 2010 2015 2020
Race and Ethnicity Number Percent Number Percent Number Percent
White Alone 243,809 54.9% 240,773 52.1% 238,564 49.1%
Black Alone 70,847 15.9% 78,075 16.9% 85,702 17.6%
American Indian Alone 3,430 0.8% 3,544 0.8% 3,665 0.8%
Asian Alone 24,267 5.5% 27,061 5.9% 31,186 6.4%
Pacific Islander Alone 3,180 0.7% 3,366 0.7% 3,673 0.8%
Some Other Race Alone 75,784 17.1% 83,573 18.1% 94,873 19.5%
Two or More Races 23,071 5.2% 25,688 5.6% 28,641 5.9%
Hispanic Origin (Any Race) 155,790 35.1% 170,675 36.9% 189,833 39.0%
Data Note: Income is expressed in current dollars.
Source: U.S. Census Bureau, Census 2010 Summary File 1. Esri forecasts for 2015 and 2020.
March 14, 2016
©2015 Esri Page 5 of 6
Demographic and Income Profile
2722 Perimeter Rd, North Las Vegas, Nevada, 89032 Prepared by Esri
Ring: 5 mile radius Latitude: 36.20790
Longitude: -115.20218
Area
State
USA
Trends 2015-2020Trends 2015-2020
AnnualRate(inpercent)
2.5
2
1.5
1
0.5
0
Population Households Families Owner HHs Median HH Income
2015
2020
Population by AgePopulation by Age
Percent
14
12
10
8
6
4
2
0
0-4 5-9 10-14 15-19 20-24 25-34 35-44 45-54 55-64 65-74 75-84 85+
2015 Household Income2015 Household Income
<$15K
13.9%
$15K - $24K
11.5%
$25K - $34K
12.0%
$35K - $49K
14.6%
$50K - $74K
19.5%
$75K - $99K
12.2%
$100K - $149K
11.3%
$150K - $199K
3.1%
$200K+
1.9%
2015 Population by Race2015 Population by Race
Percent
50
45
40
35
30
25
20
15
10
5
0
White Black Am. Ind. Asian Pacific Other Two+
2015 Percent Hispanic Origin: 36.9%
Source: U.S. Census Bureau, Census 2010 Summary File 1. Esri forecasts for 2015 and 2020.
March 14, 2016
©2015 Esri Page 6 of 6
Area Demographics (5 Mile Radius)