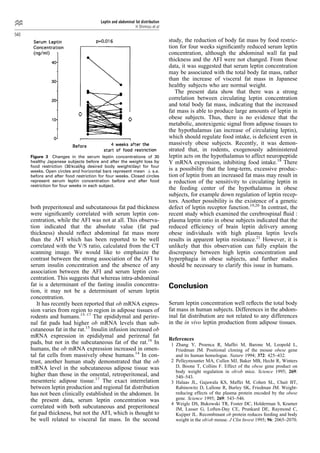
International Journal of Obesity (1997) 21, 536±541
          ß 1997 Stockton Press All rights reserved 0307±0565/97 $12.00


Serum leptin concentration is associated with
total body fat mass, but not abdominal fat
distribution

H Shimizu1, Y Shimomura2, R Hayashi2, K Ohtani1, N Sato1, T Futawatari2 and M Mori1
1
 The First Department of Internal Medicine, Gunma University School of Medicine, and 2 Gunma Prefectural College of Medical
Sciences, Gunma, Japan


OBJECTIVE: The obese (ob) gene encodes leptin which inhibits appetite and stimulates thermogenesis. Serum leptin
concentrations are determined by total body fat mass, but the inĀÆuence of visceral fat accumulation and other
metabolic factors have not been clinically determined.
METHODS: We determined the correlations between serum leptin concentrations and the total body fat mass,
abdominal fat mass, abdominal fat distribution (estimated by ultrasound), and circulating metabolic factors in 104
Japanese healthy subjects (11 men and 93 women). In addition, the effect of food restriction (30 kcal/kg desired body
weight/day) for four weeks on serum leptin concentrations were also examined in 30 women.
RESULTS: There was a signiĀ®cant correlation between serum leptin concentrations and total body fat mass (r ˆ 0.708,
P ` 0.0001), the percentage of body fat (r ˆ 0.561, P ` 0.001), and the body mass index (BMI, r ˆ 0.630, P ` 0.001).
Serum leptin concentrations were correlated with the abdominal wall preperitoneal and subcutaneous fat pad
thickness, but not the abdominal wall fat index (AFI). Serum leptin concentrations were also correlated with serum
immunoreactive insulin (IRI), but not glucose, or free fatty acid (FFA) concentrations. The weight loss after food
restriction for four weeks signiĀ®cantly (P ˆ 0.016) reduced the serum leptin concentrations with a signiĀ®cant reduction
of body fat mass, serum glucose, IRI and FFA concentrations. However, there was no signi®cant correlation of the
percentage change in serum leptin concentrations to that in body fat mass after food restriction.
CONCLUSION: Serum leptin concentrations are well correlated with the total body fat mass in healthy subjects.
Differences in abdominal fat distribution do not appear to be related to a difference in the in vivo leptin production
from adipose tissue.

Keywords: leptin; body fat; fat distribution; insulin; food restriction.


Introduction                                                                      In human studies, serum leptin concentrations have
                                                                               recently been reported to be correlated with the
                                                                               percentage of body fat, suggesting that most obese
The obese (ob) gene was recently identi®ed as being                            people may be insensitive to increased levels of
involved in the regulation of energy balance in                                the anorexigenic peptide, leptin which was endogen-
genetically obese mice.1 The ob gene encodes the                               ously overproduced from adipose tissues.11 On the
protein, leptin, that plays an important role in the                           other hand, visceral fat mass is related to the elevation
regulation of food consumption and body weight.                                of circulating metabolic factors such as insulin,12
Since leptin inhibits appetite and stimulates thermo-                          which may affect leptin production from the adipo-
genesis in rodents,2±4 this peptide is believed to act as                      cytes.5,7,8 It is possible that there may be a difference
a satiety factor in the hypothalamus. Recently, evi-                           in the leptin production between the visceral and
dence has been accumulated that the ob gene expres-                            subcutaneous adipose tissues. However, whether the
sion is modi®ed by various kinds of humoral factors                            regional differences of visceral fat mass may affect
such as insulin, glucocorticoids, estrogen, and cyto-                          serum leptin concentrations is still unknown in
kines which involve the regulation of food intake.5±10                         humans.
However, an interrelation between the ob gene expres-                             In the present study, we determined correlations
sion and circulating metabolic factors has not been                            between serum leptin concentrations and metabolic
clinically determined.                                                         parameters of body fat adiposity, abdominal fat dis-
                                                                               tribution, and circulating metabolic factors in healthy
Correspondence: Dr H Shimizu, 1st Department of Internal                       Japanese subjects who have no metabolic disorders. In
Medicine, Gunma University School of Medicine, 3-39-15                         addition, the effect of body weight loss after food
Showa-machi, Maebashi, Gunma 371, Japan.
Received 6 November 1996; revised 7 March 1997; accepted 12                    restriction on serum leptin concentrations was inves-
March 1997                                                                     tigated.
Leptin and abdominal fat distribution
                                                           H Shimizu et al
                                                                                                                     537
Subjects and methods                                       Assays
                                                           Circulating glucose and FFA concentrations were
                                                           measured with an automatic analyzer using a glucose
Subjects                                                   oxidase method and an enzymatic method, respec-
The present study included 104 healthy Japanese            tively. Serum leptin concentration was assayed with a
subjects (11 men and 93 women, mean age:                   radioimmunoassay (RIA) kit, obtained from Linco
49.7 Ɔ 1.0 y old, and Body Mass Index (BMI):               Research, Inc. (St. Charles, Mo, USA).2,12 The limit
23.9 Ɔ 0.3 kg/m2). No subject was receiving medica-        of sensitivity for human leptin assay was 0.5 ng/ml.
tions for any metabolic disorders. All subjects were       Serum IRI concentration was also assayed with a
fully informed as to the nature of the study and           commercially available RIA kit (Phadeceph Insulin
provided consent. The study was conducted in accor-        Kit, Pharmacia Japan, Tokyo, Japan).
dance with the provisions of the Declaration of
Helsinki, as amended in Tokyo in 1975 and Venice
1989. The study was approved by the Institutional          Statistical analysis
Review Board of the Department of Medicine, Gunma          All data were expressed as means Ɔ s.e. The correla-
University, School of Medicine (Maebashi, Japan).          tion was evaluated using the linear regression analy-
   In the second study which examined the effect of        sis. The values before and after food restriction were
food restriction for four weeks on serum leptin con-       compared by means of paired t-test. A value of
centrations, 30 women were randomly included from          P ` 0.05 was considered to be statistically signi®cant.
all subjects in the ®rst study, and gave their informed
consent to undergo food restriction.
                                                           Results
Study protocols
All subjects included in the ®rst study were not           Tables 1 and 2 show the simple correlation coef®-
requested to follow any particular diet prior to blood     cients and statistical signi®cance among serum leptin
sampling. Blood specimens were collected from the          concentrations, body fat mass, % body fat, body mass
cubital vein in the early morning after overnight          index (BMI), abdominal wall fat pad thickness, fast-
fasting. Following immediate centrifugation, the           ing glucose, serum IRI, FFA concentrations, and the
obtained sera were stored at 7 70 C for the measure-      P-values, respectively. As shown in Figure 1, there
ment of serum leptin, immunoreactive insulin (IRI),        were signi®cant positive correlations between the
glucose and free fatty acid (FFA) concentrations.          serum leptin concentration and the BMI (r ˆ 0.630,
Total body fat mass and the percentage of body             P ` 0.001; Figure 1a), % body fat (r ˆ 0.561,
weight (% body fat) were measured by bioelectric           P ` 0.001; Figure 1b) and total body fat mass
impedance analysis method (TBF-101, Tanita Inc.,           (r ˆ 0.708, P ` 0.001; Figure 1c), respectively. The
Tokyo, Japan). Abdominal wall subcutaneous and             strongest correlation was between total body fat mass
preperitoneal fat pad thickness was estimated by           and serum leptin concentration.
using ultrasonography (SDL-310, Shimazu Industrial            With regard to the abdominal wall fat distribution,
Ltd., Tokyo, Japan), according to the method pre-          serum leptin concentrations were signi®cantly
viously reported by Suzuki et al.13 The abdominal          (P ` 0.001) correlated with both abdominal wall sub-
wall fat index (AFI), which has been reported to be        cutaneous (Figure 2a) and preperitoneal (Figure 2b)
well correlated with visceral fat mass,13 was calcu-       fat pad thickness, but not the AFI (Figure 2c). Thus,
lated by dividing the maximum of abdominal wall            serum leptin concentration may not be associated with
preperitoneal fat thickness by the minimum of abdom-       regional difference of abdominal fat distribution
inal wall subcutaneous fat pad thickness.                  assessed with the AFI. Serum IRI concentrations
   To study the effect of body weight loss due to food     were signi®cantly correlated with serum leptin, and
restriction, thirty healthy women (the average of age:     glucose concentrations, total body fat mass, BMI,
48.4 Ɔ 1.8 y old, the average of the Body Mass Index       preperitoneal fat pad thickness, and AFI, but not %
(BMI): 25.1 Ɔ 0.5 kg/m2) received food restriction         body fat, or subcutaneous fat pad thickness (Tables 1
therapy (30 kcal/kg desired body weight/day) for           and 2). Serum FFA concentration was not correlated
four weeks. The desired body weight was calculated         with any of the factors measured in this study.
according to the modi®cation of Broca's calculation           Table 3 shows the changes of all metabolic factors
method (The Desired Body Weight (kg)                       measured before and at four weeks after the start of
ˆ (Height (cm) 7 100) 6 0.9 (kg). The diet composi-        food restriction in the second study. The food restric-
tion was not changed during the whole observation          tion for four weeks signi®cantly (P ` 0.001)
period after the start of food restriction. Changes in     decreased the total body fat mass by 1.8 kg. As
body fat mass, abdominal fat distribution, and circu-      shown in Figure 3, food restriction signi®cantly
lating metabolic factors including serum leptin con-       (P ˆ 0.016) reduced serum leptin concentration by
centration were measured before and at four weeks          79% of its initial value. However, the % change of
after the start of food restriction, as described above.   total body fat mass by food restriction was not
Leptin and abdominal fat distribution
                                                                H Shimizu et al
538
      Table 1 Relationships between parameters of serum leptin concentration, the total body fat mass, the percentage of body fat (% body
      fat), the body mass index (BMI), abdominal wall fat pad thickness, fasting glucose (FG), immunoreactive insulin (IRI) and free fatty acid
      (FFA) concentrations in 104 Japanese healthy subjects

                        Leptin   Body fat mass        % body fat    BMI        Preperitoneal fat      Subcutaneous fat      Abdominal      FG       IRI     FFA
                                                                                pad thickness          pad thickness         fat index

      Leptin            1.000          0.708            0.561       0.630           0.451                  0.525               0.076      0.038    0.291   70.074
      Body fat mass                    1.000            0.818       0.883           0.563                  0.595               0.080      0.217    0.330   70.058
      % Body fat                                        1.000       0.760           0.466                  0.526               0.005      0.133    0.043   70.015
      BMI                                                           1.000           0.520                  0.537               0.083      0.189    0.350   70.020
      Preperitoneal                                                                 1.000                  0.327               0.651      0.065    0.313   70.105
      fat pad
      thickness
                                                                          Subcutaneous
                                                                          fat pad
                                                                          thickness
          1.000                     70.435              0.013       0.105      70.124
      Abdominal                                                                                                                1.000      0.129 0.241       0.021
      fat index
      FG                                                                                                                                  1.000 0.260       0.128
      IRI                                                                                                                                       1.000       0.006
      FFA                                                                                                                                                   1.000


      Table 2 Statistical signi®cance of correlation coef®cients between parameters of serum leptin concentration, the total body fat mass,
      the percentage of body fat (% body fat), the body mass index (BMI), abdominal wall fat pad thickness, fasting glucose (FG),
      immunoreactive insulin (IRI) and free fatty acid (FFA) concentrations in 104 Japanese healthy subjects

                         Body fat mass     % body fat        BMI            Preperitoneal fat      Subcutaneous fat      Abdominal       FG        IRI      FFA
                                                                             pad thickness          pad thickness         fat index

      Leptin              P ` 0.0001      P ` 0.0001      P ` 0.0001          P ` 0.0001             P ` 0.0001             N.S.        N.S.      0.0026    N.S.
      Body fat mass                       P ` 0.0001      P ` 0.0001          P ` 0.0001             P ` 0.0001             N.S.       0.0264     0.0006    N.S.
      % body fat                                          P ` 0.0001          P ` 0.0001             P ` 0.0001             N.S.        N.S.       N.S.     N.S.
      BMI                                                                     P ` 0.0001             P ` 0.0001             N.S.        N.S.      0.0002    N.S.
      Preperitoneal                                                                                      0.0006          P ` 0.0001     N.S.      0.0011    N.S.
      fat pad
      thickness
                                                                        Subcutaneous
                                                                        fat pad
                                                                        thickness
          P ` 0.0001         N.S.              N.S.          N.S.
      Abdominal                                                                                                                          N.S.     0.0135    N.S.
      fat index
      FG                                                                                                                                          0.0075    N.S.
      IRI                                                                                                                                                   N.S.


      Figure 1 Correlations between serum leptin concentration and (a) body mass index (BMI); (b) percentage of body fat (% body fat); (c)
      total body fat mass in 104 healthy Japanese subjects. The closed circle represents each male value and the open circle represent one in
      female.
Leptin and abdominal fat distribution
                                                                       H Shimizu et al
                                                                                                                                           539


Figure 2 Correlations among serum leptin concentration and (a) abdominal subcutaneous; (b) preperitoneal fat thickness; (c) the
abdominal fat index (AFI) in 104 healthy Japanese subjects. Closed circle represents each male value and the open circle represent one
in female.


Table 3 Effects of food restriction on serum leptin concentration, the total body fat mass, the percentage of body fat (% body fat), the
body mass index (BMI), abdominal wall fat pad thickness, fasting glucose (FG), immunoreactive insulin (IRI) and free fatty acid (FFA)
concentrations in 30 Japanese healthy subjects

                                                      Before food restriction                   Four weeks after the start      P-value
                                                                                                    of diet restriction

Leptin (ng/ml)                                            12.48 Ɔ 1.48                                 9.85 Ɔ 1.21               0.0160
Total body fat mass (kg)                                  20.88 Ɔ 1.04                                19.08 Ɔ 0.98             ` 0.0001
% body fat (%)                                            35.08 Ɔ 1.10                                33.33 Ɔ 1.02             ` 0.0001
BMI (kg/m2)                                               25.09 Ɔ 0.53                                24.34 Ɔ 0.54             ` 0.0001
Preperitoneal fat pad thickness (mm)                       9.30 Ɔ 0.53                                 9.11 Ɔ 0.59               0.9068
Subcutaneous fat pad thickness (mm)                       16.50 Ɔ 0.75                                16.48 Ɔ 0.76               0.7873
Abdominal fat index                                        0.58 Ɔ 0.03                                 0.55 Ɔ 0.78               0.7130
FG (mg/dl)                                                92.73 Ɔ 2.23                                87.30 Ɔ 1.71             ` 0.0001
IRI (mU/ml)                                                8.78 Ɔ 1.12                                 6.50 Ɔ 0.43               0.0308
FFA (mEq/L)                                                0.90 Ɔ 0.06                                 0.72 Ɔ 0.04               0.0032


signi®cantly correlated with that of serum leptin                       obese subjects, the extent to which the results
concentration (r ˆ 0.131). Fasting glucose, IRI and                     obtained herein apply to obese individuals is unclear.
FFA concentrations were signi®cantly reduced after                         In addition, we found that a reduction of 1.8 kg (9%
food restriction (Table 3). However, neither abdom-                     of initial value) in total body fat mass by food
inal wall preperitoneal, subcutaneous fat pad thickness                 restriction for four weeks was associated with a
nor the AFI was signi®cantly reduced by food restric-                   reduction of serum leptin concentrations. These data
tion for four weeks.                                                    indicate that an increase of serum leptin concentration
                                                                        should reĀÆect the greater production of leptin from
                                                                        increased body fat mass. However, it is possible that
                                                                        the reduction of serum leptin concentration after food
Discussion                                                              restriction may be inĀÆuenced by other effects of recent
                                                                        dietary manipulation, since there was no obvious
                                                                        correlation between the % changes in total body fat
In the present study, we found strong correlations                      mass and serum leptin concentration.
between serum leptin concentrations and the total                          The present study demonstrated that serum leptin
body fat mass, % body fat, and BMI in healthy                           concentrations was not associated with a regional
Japanese subjects who were of normal weight                             difference of abdominal wall fat mass, evaluated by
(23.9 Ɔ 0.3 kg/m2). These results are consistent with                   the ultrasonography method. Although it has been
previous observations by several investigators.10,14                    reported that the AFI is a good indicator of visceral
However, since the present studies did not include                      fat deposition,13 the present study demonstrated that
Leptin and abdominal fat distribution
                                                             H Shimizu et al
540
                                                                                study, the reduction of body fat mass by food restric-
                                                                                tion for four weeks signi®cantly reduced serum leptin
                                                                                concentration, although the abdominal wall fat pad
                                                                                thickness and the AFI were not changed. From those
                                                                                data, it was suggested that serum leptin concentration
                                                                                may be associated with the total body fat mass, rather
                                                                                than the increase of visceral fat mass in Japanese
                                                                                healthy subjects who are normal weight.
                                                                                   The present data show that there was a strong
                                                                                correlation between circulating leptin concentration
                                                                                and total body fat mass, indicating that the increased
                                                                                fat mass is able to produce large amounts of leptin in
                                                                                obese subjects. Thus, there is no evidence that the
                                                                                metabolic, anorexigenic signal from adipose tissues to
                                                                                the hypothalamus (an increase of circulating leptin),
                                                                                which should regulate food intake, is de®cient even in
                                                                                massively obese subjects. Recently, it was demon-
                                                                                strated that, in rodents, exogenously administered
      Figure 3 Changes in the serum leptin concentrations of 30                 leptin acts on the hypothalamus to affect neuropeptide
      healthy Japanese subjects before and after the weight loss by             Y mRNA expression, inhibiting food intake.18 There
      food restriction (30 kcal/kg desired body weight/day) for four
      weeks. Open circles and horizontal bars represent mean Ɔ s.e.             is a possibility that the long-term, excessive produc-
      before and after food restriction for four weeks. Closed circles          tion of leptin from an increased fat mass may result in
      represent serum leptin concentration before and after food                a reduction of the sensitivity to circulating leptin in
      restriction for four weeks in each subject.
                                                                                the feeding center of the hypothalamus in obese
                                                                                subjects, for example down regulation of leptin recep-
                                                                                tors. Another possibility is the existence of a genetic
      both preperitoneal and subcutaneous fat pad thickness                     defect of leptin receptor function.19,20 In contrast, the
      were signi®cantly correlated with serum leptin con-                       recent study which examined the cerebrospinal ¯uid :
      centration, while the AFI was not at all. This observa-                   plasma leptin ratio in obese subjects indicated that the
      tion indicated that the absolute value (fat pad                           reduced ef®ciency of brain leptin delivery among
      thickness) should reĀÆect abdominal fat mass more                          obese individuals with high plasma leptin levels
      than the AFI which has been reported to be well                           results in apparent leptin resistance.21 However, it is
      correlated with the V/S ratio, calculated from the CT                     unlikely that this observation can fully explain the
      scanning image. We would like to emphasize the                            discrepancy between high leptin concentration and
      contrast between the strong association of the AFI to                     hyperphagia in obese subjects, and further studies
      serum insulin concentration and the absence of any                        should be necessary to clarify this issue in humans.
      association between the AFI and serum leptin con-
      centration. This suggests that whereas intra-abdominal
      fat is a determinant of the fasting insulin concentra-                    Conclusion
      tion, it may not be a determinant of serum leptin
      concentration.
         It has recently been reported that ob mRNA expres-                     Serum leptin concentration well reĀÆects the total body
      sion varies from region to region in adipose tissues of                   fat mass in human subjects. Differences in the abdom-
      rodents and humans.15±17 The epididymal and perire-                       inal fat distribution are not related to any differences
      nal fat pads had higher ob mRNA levels than sub-                          in the in vivo leptin production from adipose tissues.
      cutaneous fat in the rat.15 Insulin infusion increased ob
      mRNA expression in epididymal and perirenal fat
                                                                                References
      pads, but not in the subcutaneous fat of the rat.16 In                     1 Zhang Y, Proenca R, Maffei M, Barone M, Leopold L,
      humans, the ob mRNA expression increased in omen-                            Friedman JM. Positional cloning of the mouse obese gene
      tal fat cells from massively obese humans.14 In con-                         and its human homologue. Nature 1994; 372: 425±432.
      trast, another human study demonstrated that the ob                        2 Pelleymounter MA, Cullen MJ, Baker MB, Hecht R, Winters
      mRNA level in the subcutaneous adipose tissue was                            D, Boone T, Collins F. Effect of the obese gene product on
                                                                                   body weight regulation in ob/ob mice. Science 1995; 269:
      higher than those in the omental, retroperitoneal, and                       540±543.
      mesenteric adipose tissue.17 The exact interrelation                       3 Halaas JL, Gajawala KS, Maffei M, Cohen SL, Chait BT,
      between leptin production and regional fat distribution                      Rabinowitz D, Lallone R, Burley SK, Friedman JM. Weight-
      has not been clinically established in the abdomen. In                       reducing effects of the plasma protein encoded by the obese
      the present data, serum leptin concentration was                             gene. Science 1995; 269: 543±546.
                                                                                 4 Weigle DS, Bukowski TR, Foster DC, Holderman S, Kramer
      correlated with both subcutaneous and preperitoneal                          JM, Lasser G, Loften-Day CE, Prunkard DE, Raymond C,
      fat pad thickness, but not the AFI, which is thought to                      Kujiper JL. Recombinant ob protein reduces feeding and body
      be well related to visceral fat mass. In the second                          weight in the ob/ob mouse. J Clin Invest 1995; 96: 2065±2070.
Leptin and abdominal fat distribution
                                                                        H Shimizu et al
                                                                                                                                               541
 5 Saladin R, Do Vos P, Guerre-Millo M, Leturque A, Girard J,                ratio of visceral fat to subcutaneous fat in the abdomen. Am J
   Staels B, Auwerx J. Transient increase in obese gene expres-              Med 1993; 95: 309±314.
   sion after food intake or insulin administration. Nature 1995;       14   Maffei M, Halaas J, Ravussin E, Pratley RE, Lee GH, Zhang
   377: 527±529.                                                             Y, Fei H, Kim S, Lallone R, Ranganathan S, Kern PA,
 6 Murakami T, Iida M, Shima K. Dexamethasone regulates                      Friedman JM. Leptin levels in human and rodent: measure-
   obese expression in isolated adipocytes. Biochem Biophys                  ment of plasma leptin and ob RNA in obese and weight-
   Res Commun 1995; 214: 1260±1267.                                          reduced subjects. Nature Med 1995; 1: 1155±1161.
 7 Kolaczynski JW, Nyce MR, Considine RV, Boden G, Nolan                15   Hamilton BS, Paglia D, Kwan AY, Deitel M. Increased obese
   JJ, Henry R, Mudaliar SR, Olefsky J, Caro JF. Acute and                   mRNA expression in omental fat cells from massively obese
   chronic effect of insulin on leptin production in humans.                 humans. Nature Med 1995; 1: 953±956.
   Studies in vivo and in vitro. Diabetes 1996; 45: 699±701.            16   Zheng D, Jone JP, Usala SJ, Dohm GL. Differential expres-
 8 Gagogo-Jack S, Fanelli C, Paramore D, Brothers J, Landt M.                sion of ob mRNA in rat adipose tissues in response to insulin.
   Plasma leptin and insulin relationships in obese and nonobese             Biochem Biophys Res Commun 1996; 218: 434±437.
   humans. Diabetes 1996; 45; 695±698.                                  17   Masuzaki H, Ogawa Y, Isse N, Satoh N, Okazaki T, Shige-
 9 Slieler LJ, Sloop KW, Surface PL, Kriauciunas A, LaQuier F,               moto M, Mori K, Tamura N, Hosoda K, Yoshimasa Y, Jinhami
   Manetta J, Bue-Valleskey J, Stephens TW. Regulation of                    H, Kawada T, Nakao K. Human obese gene expression.
   expression of ob mRNA and protein by glucocorticoids and                  Adipocyte-speci®c expression and regional differences in the
   cAMP. J Biol Chem 1996; 271: 5301±5304.                                   adipose tissue. Diabetes 1995; 44: 855±858.
10 Grunfeld C, Zhao C, Fuller J, Pollock A, Moser A, Friedman J,        18   Schwartz MW, Baskin DG, Bukowski TR, Kujiper JL, Foster
   Feingold KR. Endotoxin and cytokines induce expression of                 D, Lasser G, Prunkard DE, Porte D Jr, Woods SC, Seeley RJ,
   leptin, the ob gene product, in hamsters. A role for leptin in the        Weigle DS. Speci®city of leptin action on elevated blood
   anorexia of infection. J Clin Invest 1996; 97: 2152±2157.                 glucose levels and hypothalamic neuropeptide Y gene expres-
11 Considine RV, Sinha MK, Heiman ML, Kriaucuinas A,                         sion in ob/ob mice. Diabetes 1995; 45: 531±535.
   Stephens TW, Nyce MR, Ohannesian JP, Marco CC, McKee                 19   Tartaglia LA, Dembski M, Weng X, Deng N, Culpepper J,
   LJ, Bauer TL, Caro JF. Serum immunoreactive-leptin concen-                Devos R, Richards GJ, Camp®eld LA, Clark FT, Deeds J.
   trations in normal-weight and obese humans. New Engl J Med                Identi®cation and expression cloning of a leptin receptor, OB-
   1996; 334: 292±295.                                                       R. Cell 1995; 83: 1263±1271.
12 Yoshida S, Inadera H, Ishikawa Y, Shinomiya M, Shirai K,             20   Considine RV, Considine EL, Williams CJ, Hyde TM, Caro
   Saito Y. Endocrine disorders and body fat distribution. Int J             JF. The hypothalamic leptin receptor in humans. Identi®cation
   Obes Suppl 1991; 15/2: 37±40.                                             of incidental sequence polymorphisms and absence of the db/
13 Suzuki R, Watanabe S, Hirai Y, Akiyama K, Nishide T,                      db mouse and fa/fa rat mutations. Diabetes 1996; 19: 992±994.
   Matsushima Y, Murayama H, Ohshima H, Shinomiya M,                    21   Schwarz MW, Peskind E, Raskind M, Boyko EJ, Porte D Jr.
   Shirai K, Saito Y, Yoshida S, Saisho H. Abdominal wall fat                Cerebrospinal ĀÆuid leptin levels: Relationship to plasma levels
   index, estimated by ultrasonography, for assessment of the                and to adiposity in humans. Nature Med 1996; 2: 589±593.

Fat mass and leptin

  • 1.
    International Journal ofObesity (1997) 21, 536±541 ß 1997 Stockton Press All rights reserved 0307±0565/97 $12.00 Serum leptin concentration is associated with total body fat mass, but not abdominal fat distribution H Shimizu1, Y Shimomura2, R Hayashi2, K Ohtani1, N Sato1, T Futawatari2 and M Mori1 1 The First Department of Internal Medicine, Gunma University School of Medicine, and 2 Gunma Prefectural College of Medical Sciences, Gunma, Japan OBJECTIVE: The obese (ob) gene encodes leptin which inhibits appetite and stimulates thermogenesis. Serum leptin concentrations are determined by total body fat mass, but the inĀÆuence of visceral fat accumulation and other metabolic factors have not been clinically determined. METHODS: We determined the correlations between serum leptin concentrations and the total body fat mass, abdominal fat mass, abdominal fat distribution (estimated by ultrasound), and circulating metabolic factors in 104 Japanese healthy subjects (11 men and 93 women). In addition, the effect of food restriction (30 kcal/kg desired body weight/day) for four weeks on serum leptin concentrations were also examined in 30 women. RESULTS: There was a signiĀ®cant correlation between serum leptin concentrations and total body fat mass (r ˆ 0.708, P ` 0.0001), the percentage of body fat (r ˆ 0.561, P ` 0.001), and the body mass index (BMI, r ˆ 0.630, P ` 0.001). Serum leptin concentrations were correlated with the abdominal wall preperitoneal and subcutaneous fat pad thickness, but not the abdominal wall fat index (AFI). Serum leptin concentrations were also correlated with serum immunoreactive insulin (IRI), but not glucose, or free fatty acid (FFA) concentrations. The weight loss after food restriction for four weeks signiĀ®cantly (P ˆ 0.016) reduced the serum leptin concentrations with a signiĀ®cant reduction of body fat mass, serum glucose, IRI and FFA concentrations. However, there was no signiĀ®cant correlation of the percentage change in serum leptin concentrations to that in body fat mass after food restriction. CONCLUSION: Serum leptin concentrations are well correlated with the total body fat mass in healthy subjects. Differences in abdominal fat distribution do not appear to be related to a difference in the in vivo leptin production from adipose tissue. Keywords: leptin; body fat; fat distribution; insulin; food restriction. Introduction In human studies, serum leptin concentrations have recently been reported to be correlated with the percentage of body fat, suggesting that most obese The obese (ob) gene was recently identiĀ®ed as being people may be insensitive to increased levels of involved in the regulation of energy balance in the anorexigenic peptide, leptin which was endogen- genetically obese mice.1 The ob gene encodes the ously overproduced from adipose tissues.11 On the protein, leptin, that plays an important role in the other hand, visceral fat mass is related to the elevation regulation of food consumption and body weight. of circulating metabolic factors such as insulin,12 Since leptin inhibits appetite and stimulates thermo- which may affect leptin production from the adipo- genesis in rodents,2±4 this peptide is believed to act as cytes.5,7,8 It is possible that there may be a difference a satiety factor in the hypothalamus. Recently, evi- in the leptin production between the visceral and dence has been accumulated that the ob gene expres- subcutaneous adipose tissues. However, whether the sion is modiĀ®ed by various kinds of humoral factors regional differences of visceral fat mass may affect such as insulin, glucocorticoids, estrogen, and cyto- serum leptin concentrations is still unknown in kines which involve the regulation of food intake.5±10 humans. However, an interrelation between the ob gene expres- In the present study, we determined correlations sion and circulating metabolic factors has not been between serum leptin concentrations and metabolic clinically determined. parameters of body fat adiposity, abdominal fat dis- tribution, and circulating metabolic factors in healthy Correspondence: Dr H Shimizu, 1st Department of Internal Japanese subjects who have no metabolic disorders. In Medicine, Gunma University School of Medicine, 3-39-15 addition, the effect of body weight loss after food Showa-machi, Maebashi, Gunma 371, Japan. Received 6 November 1996; revised 7 March 1997; accepted 12 restriction on serum leptin concentrations was inves- March 1997 tigated.
  • 2.
    Leptin and abdominalfat distribution H Shimizu et al 537 Subjects and methods Assays Circulating glucose and FFA concentrations were measured with an automatic analyzer using a glucose Subjects oxidase method and an enzymatic method, respec- The present study included 104 healthy Japanese tively. Serum leptin concentration was assayed with a subjects (11 men and 93 women, mean age: radioimmunoassay (RIA) kit, obtained from Linco 49.7 Ɔ 1.0 y old, and Body Mass Index (BMI): Research, Inc. (St. Charles, Mo, USA).2,12 The limit 23.9 Ɔ 0.3 kg/m2). No subject was receiving medica- of sensitivity for human leptin assay was 0.5 ng/ml. tions for any metabolic disorders. All subjects were Serum IRI concentration was also assayed with a fully informed as to the nature of the study and commercially available RIA kit (Phadeceph Insulin provided consent. The study was conducted in accor- Kit, Pharmacia Japan, Tokyo, Japan). dance with the provisions of the Declaration of Helsinki, as amended in Tokyo in 1975 and Venice 1989. The study was approved by the Institutional Statistical analysis Review Board of the Department of Medicine, Gunma All data were expressed as means Ɔ s.e. The correla- University, School of Medicine (Maebashi, Japan). tion was evaluated using the linear regression analy- In the second study which examined the effect of sis. The values before and after food restriction were food restriction for four weeks on serum leptin con- compared by means of paired t-test. A value of centrations, 30 women were randomly included from P ` 0.05 was considered to be statistically signiĀ®cant. all subjects in the Ā®rst study, and gave their informed consent to undergo food restriction. Results Study protocols All subjects included in the Ā®rst study were not Tables 1 and 2 show the simple correlation coefĀ®- requested to follow any particular diet prior to blood cients and statistical signiĀ®cance among serum leptin sampling. Blood specimens were collected from the concentrations, body fat mass, % body fat, body mass cubital vein in the early morning after overnight index (BMI), abdominal wall fat pad thickness, fast- fasting. Following immediate centrifugation, the ing glucose, serum IRI, FFA concentrations, and the obtained sera were stored at 7 70 C for the measure- P-values, respectively. As shown in Figure 1, there ment of serum leptin, immunoreactive insulin (IRI), were signiĀ®cant positive correlations between the glucose and free fatty acid (FFA) concentrations. serum leptin concentration and the BMI (r ˆ 0.630, Total body fat mass and the percentage of body P ` 0.001; Figure 1a), % body fat (r ˆ 0.561, weight (% body fat) were measured by bioelectric P ` 0.001; Figure 1b) and total body fat mass impedance analysis method (TBF-101, Tanita Inc., (r ˆ 0.708, P ` 0.001; Figure 1c), respectively. The Tokyo, Japan). Abdominal wall subcutaneous and strongest correlation was between total body fat mass preperitoneal fat pad thickness was estimated by and serum leptin concentration. using ultrasonography (SDL-310, Shimazu Industrial With regard to the abdominal wall fat distribution, Ltd., Tokyo, Japan), according to the method pre- serum leptin concentrations were signiĀ®cantly viously reported by Suzuki et al.13 The abdominal (P ` 0.001) correlated with both abdominal wall sub- wall fat index (AFI), which has been reported to be cutaneous (Figure 2a) and preperitoneal (Figure 2b) well correlated with visceral fat mass,13 was calcu- fat pad thickness, but not the AFI (Figure 2c). Thus, lated by dividing the maximum of abdominal wall serum leptin concentration may not be associated with preperitoneal fat thickness by the minimum of abdom- regional difference of abdominal fat distribution inal wall subcutaneous fat pad thickness. assessed with the AFI. Serum IRI concentrations To study the effect of body weight loss due to food were signiĀ®cantly correlated with serum leptin, and restriction, thirty healthy women (the average of age: glucose concentrations, total body fat mass, BMI, 48.4 Ɔ 1.8 y old, the average of the Body Mass Index preperitoneal fat pad thickness, and AFI, but not % (BMI): 25.1 Ɔ 0.5 kg/m2) received food restriction body fat, or subcutaneous fat pad thickness (Tables 1 therapy (30 kcal/kg desired body weight/day) for and 2). Serum FFA concentration was not correlated four weeks. The desired body weight was calculated with any of the factors measured in this study. according to the modiĀ®cation of Broca's calculation Table 3 shows the changes of all metabolic factors method (The Desired Body Weight (kg) measured before and at four weeks after the start of ˆ (Height (cm) 7 100) 6 0.9 (kg). The diet composi- food restriction in the second study. The food restric- tion was not changed during the whole observation tion for four weeks signiĀ®cantly (P ` 0.001) period after the start of food restriction. Changes in decreased the total body fat mass by 1.8 kg. As body fat mass, abdominal fat distribution, and circu- shown in Figure 3, food restriction signiĀ®cantly lating metabolic factors including serum leptin con- (P ˆ 0.016) reduced serum leptin concentration by centration were measured before and at four weeks 79% of its initial value. However, the % change of after the start of food restriction, as described above. total body fat mass by food restriction was not
  • 3.
    Leptin and abdominalfat distribution H Shimizu et al 538 Table 1 Relationships between parameters of serum leptin concentration, the total body fat mass, the percentage of body fat (% body fat), the body mass index (BMI), abdominal wall fat pad thickness, fasting glucose (FG), immunoreactive insulin (IRI) and free fatty acid (FFA) concentrations in 104 Japanese healthy subjects Leptin Body fat mass % body fat BMI Preperitoneal fat Subcutaneous fat Abdominal FG IRI FFA pad thickness pad thickness fat index Leptin 1.000 0.708 0.561 0.630 0.451 0.525 0.076 0.038 0.291 70.074 Body fat mass 1.000 0.818 0.883 0.563 0.595 0.080 0.217 0.330 70.058 % Body fat 1.000 0.760 0.466 0.526 0.005 0.133 0.043 70.015 BMI 1.000 0.520 0.537 0.083 0.189 0.350 70.020 Preperitoneal 1.000 0.327 0.651 0.065 0.313 70.105 fat pad thickness Subcutaneous fat pad thickness 1.000 70.435 0.013 0.105 70.124 Abdominal 1.000 0.129 0.241 0.021 fat index FG 1.000 0.260 0.128 IRI 1.000 0.006 FFA 1.000 Table 2 Statistical signi®cance of correlation coef®cients between parameters of serum leptin concentration, the total body fat mass, the percentage of body fat (% body fat), the body mass index (BMI), abdominal wall fat pad thickness, fasting glucose (FG), immunoreactive insulin (IRI) and free fatty acid (FFA) concentrations in 104 Japanese healthy subjects Body fat mass % body fat BMI Preperitoneal fat Subcutaneous fat Abdominal FG IRI FFA pad thickness pad thickness fat index Leptin P ` 0.0001 P ` 0.0001 P ` 0.0001 P ` 0.0001 P ` 0.0001 N.S. N.S. 0.0026 N.S. Body fat mass P ` 0.0001 P ` 0.0001 P ` 0.0001 P ` 0.0001 N.S. 0.0264 0.0006 N.S. % body fat P ` 0.0001 P ` 0.0001 P ` 0.0001 N.S. N.S. N.S. N.S. BMI P ` 0.0001 P ` 0.0001 N.S. N.S. 0.0002 N.S. Preperitoneal 0.0006 P ` 0.0001 N.S. 0.0011 N.S. fat pad thickness Subcutaneous fat pad thickness P ` 0.0001 N.S. N.S. N.S. Abdominal N.S. 0.0135 N.S. fat index FG 0.0075 N.S. IRI N.S. Figure 1 Correlations between serum leptin concentration and (a) body mass index (BMI); (b) percentage of body fat (% body fat); (c) total body fat mass in 104 healthy Japanese subjects. The closed circle represents each male value and the open circle represent one in female.
  • 4.
    Leptin and abdominalfat distribution H Shimizu et al 539 Figure 2 Correlations among serum leptin concentration and (a) abdominal subcutaneous; (b) preperitoneal fat thickness; (c) the abdominal fat index (AFI) in 104 healthy Japanese subjects. Closed circle represents each male value and the open circle represent one in female. Table 3 Effects of food restriction on serum leptin concentration, the total body fat mass, the percentage of body fat (% body fat), the body mass index (BMI), abdominal wall fat pad thickness, fasting glucose (FG), immunoreactive insulin (IRI) and free fatty acid (FFA) concentrations in 30 Japanese healthy subjects Before food restriction Four weeks after the start P-value of diet restriction Leptin (ng/ml) 12.48 Ɔ 1.48 9.85 Ɔ 1.21 0.0160 Total body fat mass (kg) 20.88 Ɔ 1.04 19.08 Ɔ 0.98 ` 0.0001 % body fat (%) 35.08 Ɔ 1.10 33.33 Ɔ 1.02 ` 0.0001 BMI (kg/m2) 25.09 Ɔ 0.53 24.34 Ɔ 0.54 ` 0.0001 Preperitoneal fat pad thickness (mm) 9.30 Ɔ 0.53 9.11 Ɔ 0.59 0.9068 Subcutaneous fat pad thickness (mm) 16.50 Ɔ 0.75 16.48 Ɔ 0.76 0.7873 Abdominal fat index 0.58 Ɔ 0.03 0.55 Ɔ 0.78 0.7130 FG (mg/dl) 92.73 Ɔ 2.23 87.30 Ɔ 1.71 ` 0.0001 IRI (mU/ml) 8.78 Ɔ 1.12 6.50 Ɔ 0.43 0.0308 FFA (mEq/L) 0.90 Ɔ 0.06 0.72 Ɔ 0.04 0.0032 signiĀ®cantly correlated with that of serum leptin obese subjects, the extent to which the results concentration (r ˆ 0.131). Fasting glucose, IRI and obtained herein apply to obese individuals is unclear. FFA concentrations were signiĀ®cantly reduced after In addition, we found that a reduction of 1.8 kg (9% food restriction (Table 3). However, neither abdom- of initial value) in total body fat mass by food inal wall preperitoneal, subcutaneous fat pad thickness restriction for four weeks was associated with a nor the AFI was signiĀ®cantly reduced by food restric- reduction of serum leptin concentrations. These data tion for four weeks. indicate that an increase of serum leptin concentration should reĀÆect the greater production of leptin from increased body fat mass. However, it is possible that the reduction of serum leptin concentration after food Discussion restriction may be inĀÆuenced by other effects of recent dietary manipulation, since there was no obvious correlation between the % changes in total body fat In the present study, we found strong correlations mass and serum leptin concentration. between serum leptin concentrations and the total The present study demonstrated that serum leptin body fat mass, % body fat, and BMI in healthy concentrations was not associated with a regional Japanese subjects who were of normal weight difference of abdominal wall fat mass, evaluated by (23.9 Ɔ 0.3 kg/m2). These results are consistent with the ultrasonography method. Although it has been previous observations by several investigators.10,14 reported that the AFI is a good indicator of visceral However, since the present studies did not include fat deposition,13 the present study demonstrated that
  • 5.
    Leptin and abdominalfat distribution H Shimizu et al 540 study, the reduction of body fat mass by food restric- tion for four weeks signiĀ®cantly reduced serum leptin concentration, although the abdominal wall fat pad thickness and the AFI were not changed. From those data, it was suggested that serum leptin concentration may be associated with the total body fat mass, rather than the increase of visceral fat mass in Japanese healthy subjects who are normal weight. The present data show that there was a strong correlation between circulating leptin concentration and total body fat mass, indicating that the increased fat mass is able to produce large amounts of leptin in obese subjects. Thus, there is no evidence that the metabolic, anorexigenic signal from adipose tissues to the hypothalamus (an increase of circulating leptin), which should regulate food intake, is deĀ®cient even in massively obese subjects. Recently, it was demon- strated that, in rodents, exogenously administered Figure 3 Changes in the serum leptin concentrations of 30 leptin acts on the hypothalamus to affect neuropeptide healthy Japanese subjects before and after the weight loss by Y mRNA expression, inhibiting food intake.18 There food restriction (30 kcal/kg desired body weight/day) for four weeks. Open circles and horizontal bars represent mean Ɔ s.e. is a possibility that the long-term, excessive produc- before and after food restriction for four weeks. Closed circles tion of leptin from an increased fat mass may result in represent serum leptin concentration before and after food a reduction of the sensitivity to circulating leptin in restriction for four weeks in each subject. the feeding center of the hypothalamus in obese subjects, for example down regulation of leptin recep- tors. Another possibility is the existence of a genetic both preperitoneal and subcutaneous fat pad thickness defect of leptin receptor function.19,20 In contrast, the were signiĀ®cantly correlated with serum leptin con- recent study which examined the cerebrospinal ĀÆuid : centration, while the AFI was not at all. This observa- plasma leptin ratio in obese subjects indicated that the tion indicated that the absolute value (fat pad reduced efĀ®ciency of brain leptin delivery among thickness) should reĀÆect abdominal fat mass more obese individuals with high plasma leptin levels than the AFI which has been reported to be well results in apparent leptin resistance.21 However, it is correlated with the V/S ratio, calculated from the CT unlikely that this observation can fully explain the scanning image. We would like to emphasize the discrepancy between high leptin concentration and contrast between the strong association of the AFI to hyperphagia in obese subjects, and further studies serum insulin concentration and the absence of any should be necessary to clarify this issue in humans. association between the AFI and serum leptin con- centration. This suggests that whereas intra-abdominal fat is a determinant of the fasting insulin concentra- Conclusion tion, it may not be a determinant of serum leptin concentration. It has recently been reported that ob mRNA expres- Serum leptin concentration well reĀÆects the total body sion varies from region to region in adipose tissues of fat mass in human subjects. Differences in the abdom- rodents and humans.15±17 The epididymal and perire- inal fat distribution are not related to any differences nal fat pads had higher ob mRNA levels than sub- in the in vivo leptin production from adipose tissues. cutaneous fat in the rat.15 Insulin infusion increased ob mRNA expression in epididymal and perirenal fat References pads, but not in the subcutaneous fat of the rat.16 In 1 Zhang Y, Proenca R, Maffei M, Barone M, Leopold L, humans, the ob mRNA expression increased in omen- Friedman JM. Positional cloning of the mouse obese gene tal fat cells from massively obese humans.14 In con- and its human homologue. Nature 1994; 372: 425±432. trast, another human study demonstrated that the ob 2 Pelleymounter MA, Cullen MJ, Baker MB, Hecht R, Winters mRNA level in the subcutaneous adipose tissue was D, Boone T, Collins F. Effect of the obese gene product on body weight regulation in ob/ob mice. Science 1995; 269: higher than those in the omental, retroperitoneal, and 540±543. mesenteric adipose tissue.17 The exact interrelation 3 Halaas JL, Gajawala KS, Maffei M, Cohen SL, Chait BT, between leptin production and regional fat distribution Rabinowitz D, Lallone R, Burley SK, Friedman JM. Weight- has not been clinically established in the abdomen. In reducing effects of the plasma protein encoded by the obese the present data, serum leptin concentration was gene. Science 1995; 269: 543±546. 4 Weigle DS, Bukowski TR, Foster DC, Holderman S, Kramer correlated with both subcutaneous and preperitoneal JM, Lasser G, Loften-Day CE, Prunkard DE, Raymond C, fat pad thickness, but not the AFI, which is thought to Kujiper JL. Recombinant ob protein reduces feeding and body be well related to visceral fat mass. In the second weight in the ob/ob mouse. J Clin Invest 1995; 96: 2065±2070.
  • 6.
    Leptin and abdominalfat distribution H Shimizu et al 541 5 Saladin R, Do Vos P, Guerre-Millo M, Leturque A, Girard J, ratio of visceral fat to subcutaneous fat in the abdomen. Am J Staels B, Auwerx J. Transient increase in obese gene expres- Med 1993; 95: 309±314. sion after food intake or insulin administration. Nature 1995; 14 Maffei M, Halaas J, Ravussin E, Pratley RE, Lee GH, Zhang 377: 527±529. Y, Fei H, Kim S, Lallone R, Ranganathan S, Kern PA, 6 Murakami T, Iida M, Shima K. Dexamethasone regulates Friedman JM. Leptin levels in human and rodent: measure- obese expression in isolated adipocytes. Biochem Biophys ment of plasma leptin and ob RNA in obese and weight- Res Commun 1995; 214: 1260±1267. reduced subjects. Nature Med 1995; 1: 1155±1161. 7 Kolaczynski JW, Nyce MR, Considine RV, Boden G, Nolan 15 Hamilton BS, Paglia D, Kwan AY, Deitel M. Increased obese JJ, Henry R, Mudaliar SR, Olefsky J, Caro JF. Acute and mRNA expression in omental fat cells from massively obese chronic effect of insulin on leptin production in humans. humans. Nature Med 1995; 1: 953±956. Studies in vivo and in vitro. Diabetes 1996; 45: 699±701. 16 Zheng D, Jone JP, Usala SJ, Dohm GL. Differential expres- 8 Gagogo-Jack S, Fanelli C, Paramore D, Brothers J, Landt M. sion of ob mRNA in rat adipose tissues in response to insulin. Plasma leptin and insulin relationships in obese and nonobese Biochem Biophys Res Commun 1996; 218: 434±437. humans. Diabetes 1996; 45; 695±698. 17 Masuzaki H, Ogawa Y, Isse N, Satoh N, Okazaki T, Shige- 9 Slieler LJ, Sloop KW, Surface PL, Kriauciunas A, LaQuier F, moto M, Mori K, Tamura N, Hosoda K, Yoshimasa Y, Jinhami Manetta J, Bue-Valleskey J, Stephens TW. Regulation of H, Kawada T, Nakao K. Human obese gene expression. expression of ob mRNA and protein by glucocorticoids and Adipocyte-speci®c expression and regional differences in the cAMP. J Biol Chem 1996; 271: 5301±5304. adipose tissue. Diabetes 1995; 44: 855±858. 10 Grunfeld C, Zhao C, Fuller J, Pollock A, Moser A, Friedman J, 18 Schwartz MW, Baskin DG, Bukowski TR, Kujiper JL, Foster Feingold KR. Endotoxin and cytokines induce expression of D, Lasser G, Prunkard DE, Porte D Jr, Woods SC, Seeley RJ, leptin, the ob gene product, in hamsters. A role for leptin in the Weigle DS. Speci®city of leptin action on elevated blood anorexia of infection. J Clin Invest 1996; 97: 2152±2157. glucose levels and hypothalamic neuropeptide Y gene expres- 11 Considine RV, Sinha MK, Heiman ML, Kriaucuinas A, sion in ob/ob mice. Diabetes 1995; 45: 531±535. Stephens TW, Nyce MR, Ohannesian JP, Marco CC, McKee 19 Tartaglia LA, Dembski M, Weng X, Deng N, Culpepper J, LJ, Bauer TL, Caro JF. Serum immunoreactive-leptin concen- Devos R, Richards GJ, Camp®eld LA, Clark FT, Deeds J. trations in normal-weight and obese humans. New Engl J Med Identi®cation and expression cloning of a leptin receptor, OB- 1996; 334: 292±295. R. Cell 1995; 83: 1263±1271. 12 Yoshida S, Inadera H, Ishikawa Y, Shinomiya M, Shirai K, 20 Considine RV, Considine EL, Williams CJ, Hyde TM, Caro Saito Y. Endocrine disorders and body fat distribution. Int J JF. The hypothalamic leptin receptor in humans. Identi®cation Obes Suppl 1991; 15/2: 37±40. of incidental sequence polymorphisms and absence of the db/ 13 Suzuki R, Watanabe S, Hirai Y, Akiyama K, Nishide T, db mouse and fa/fa rat mutations. Diabetes 1996; 19: 992±994. Matsushima Y, Murayama H, Ohshima H, Shinomiya M, 21 Schwarz MW, Peskind E, Raskind M, Boyko EJ, Porte D Jr. Shirai K, Saito Y, Yoshida S, Saisho H. Abdominal wall fat Cerebrospinal ¯uid leptin levels: Relationship to plasma levels index, estimated by ultrasonography, for assessment of the and to adiposity in humans. Nature Med 1996; 2: 589±593.