Download as PDF, PPTX
![5 MINUTE TOUR OF GRBS SWIFT-AMI UPDATE WHAT’S NEXT
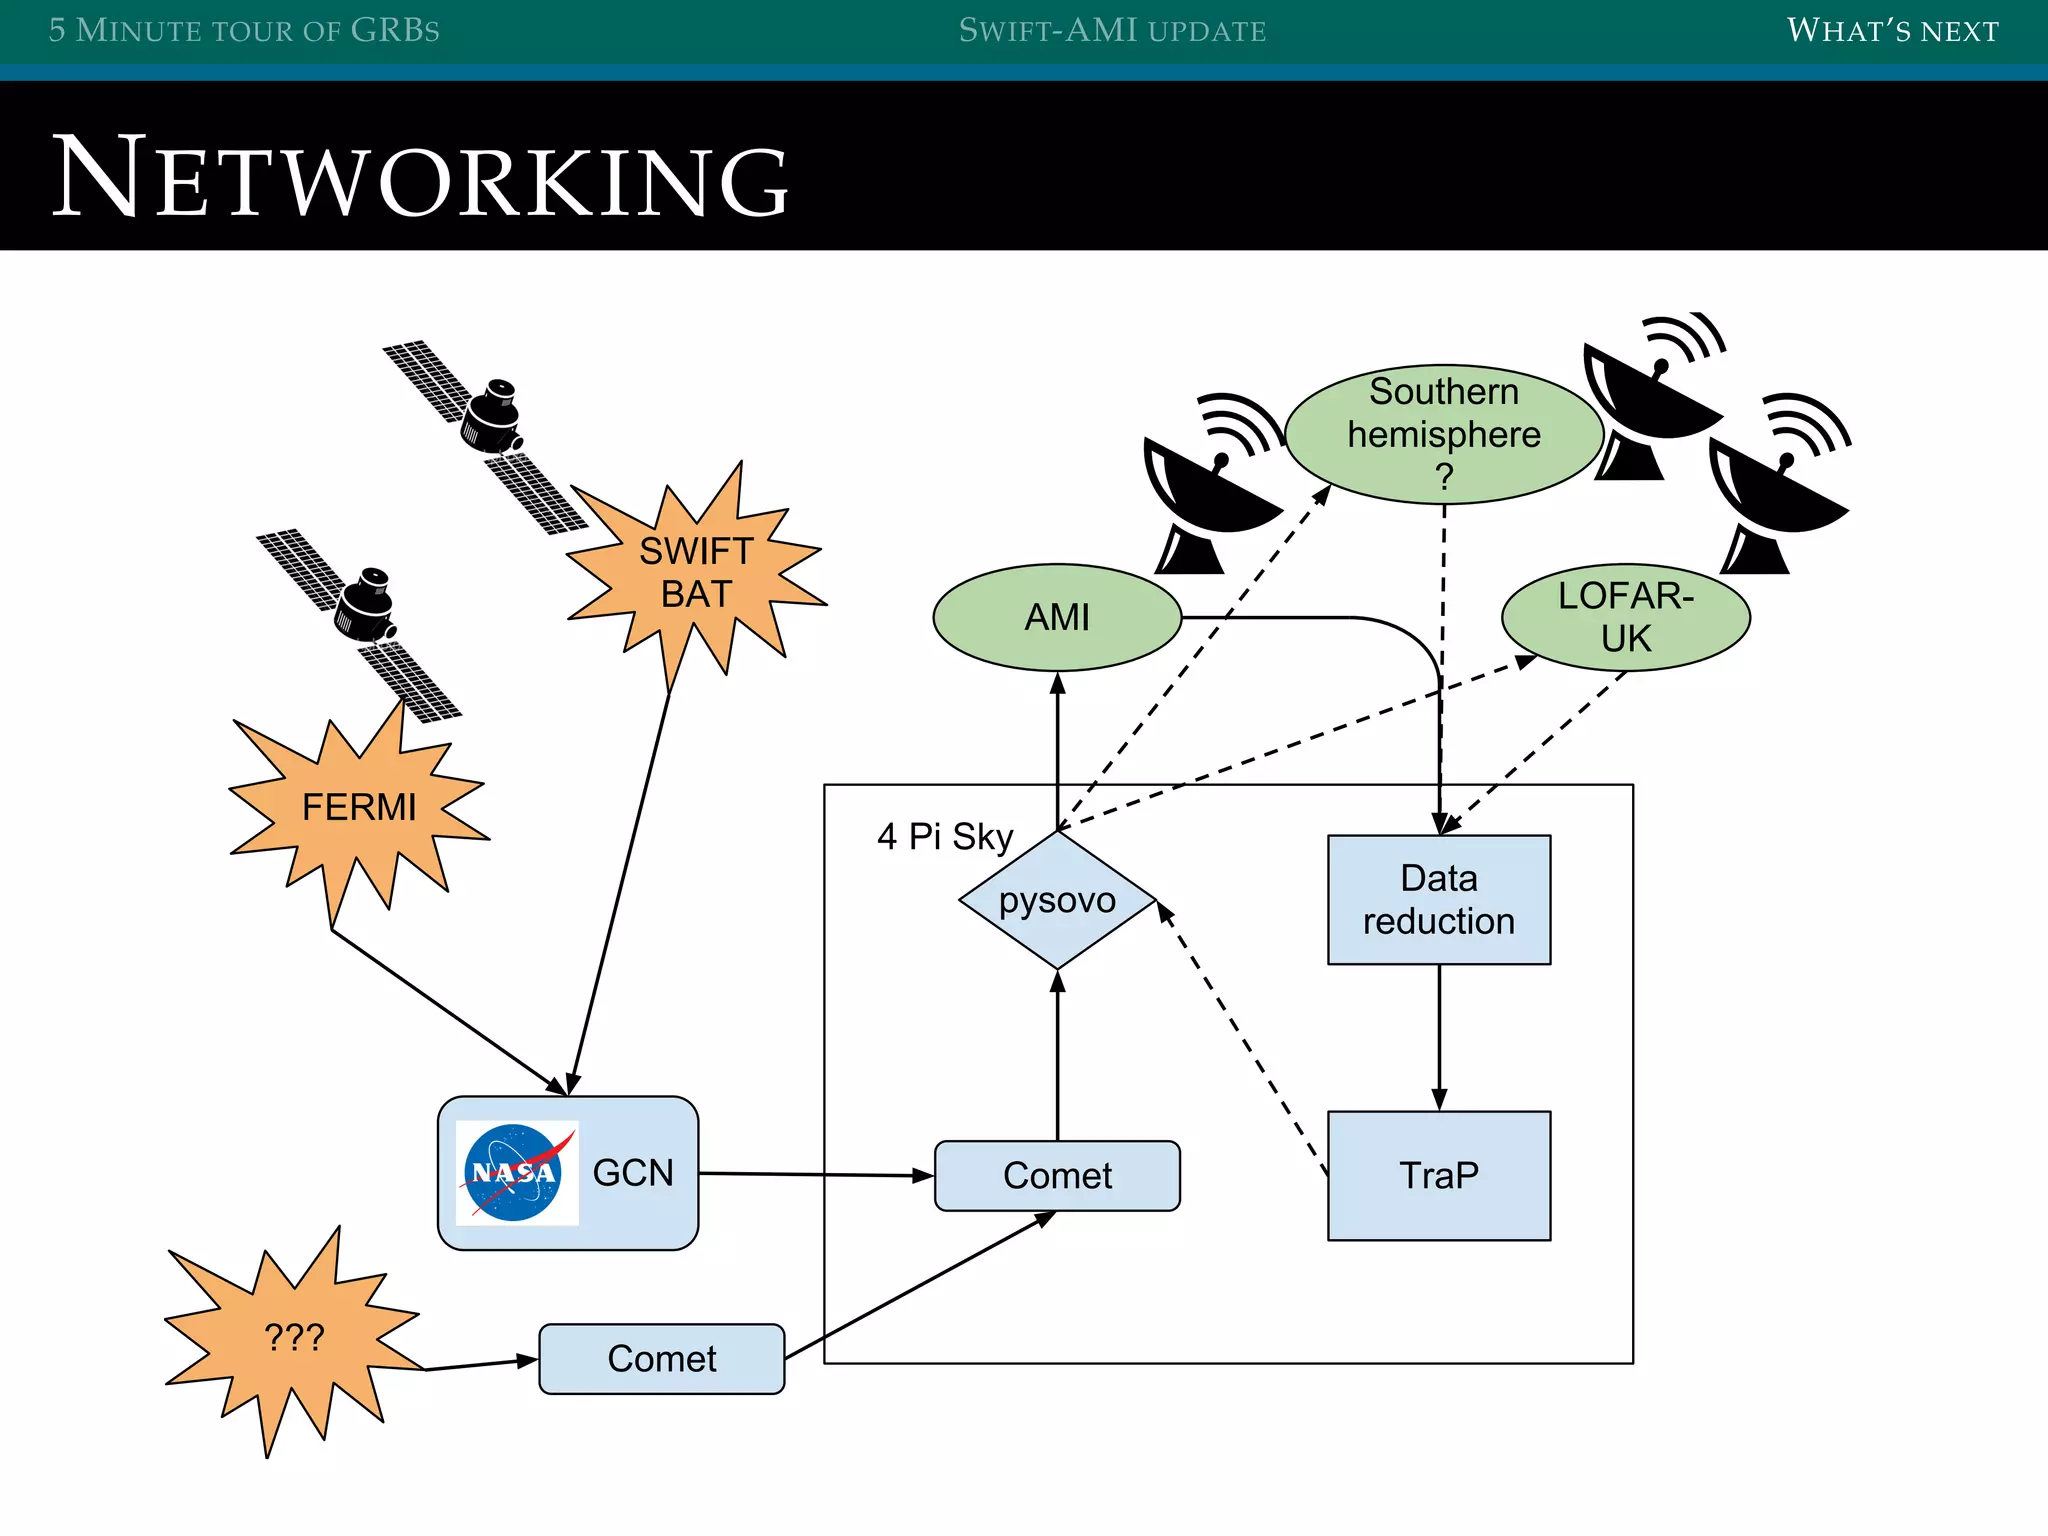
NETWORKING
[Transient] astronomy
currently follows the “second
grade soccer system” -
everyone chases the same ball.](https://image.slidesharecdn.com/fastradiofollowup-141116112733-conversion-gate01/75/Fast-radio-follow-up-26-2048.jpg)

The document discusses a meeting presentation on fast radio bursts (FRBs) and gamma-ray bursts (GRBs) by Tim Staley at the University of Southampton. It outlines updates on the Swift-Ami project, emphasizing advancements in data reduction and the system's effective responses. The presentation also highlights the need for improved collaboration in transient astronomy and introduces a new follow-up prioritization and scheduling system currently in development.


![La colación [D: OJALA SE SUBA AHORA T-T]](https://cdn.slidesharecdn.com/ss_thumbnails/lacolacin-140414202152-phpapp02-thumbnail.jpg?width=640&height=640&fit=bounds)