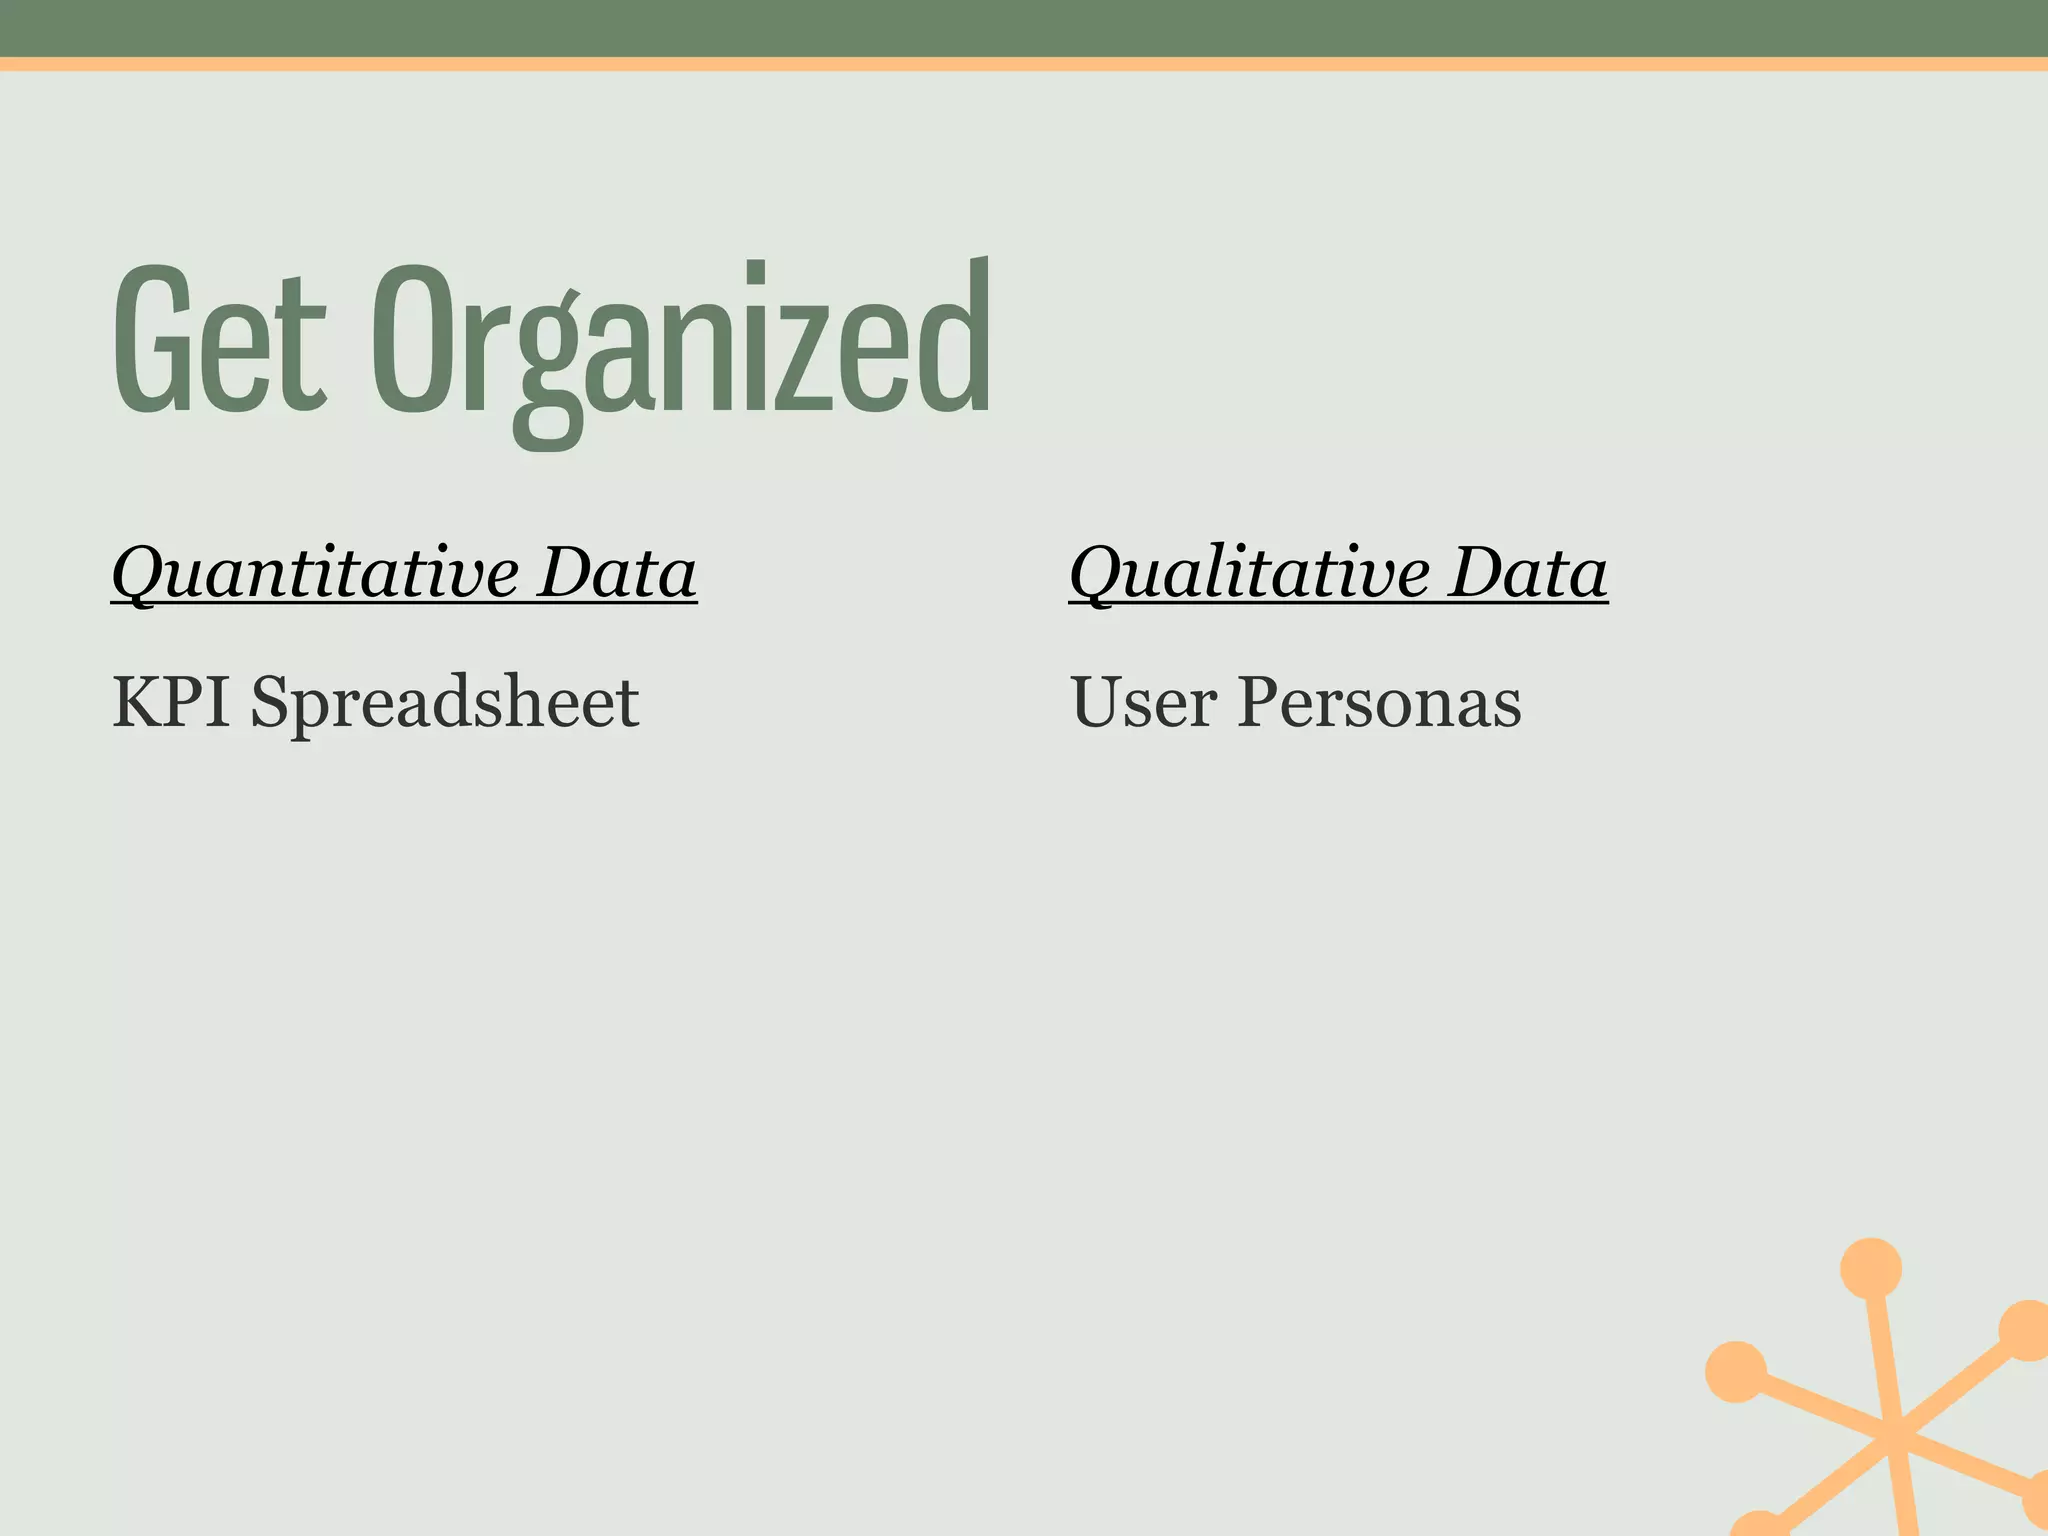
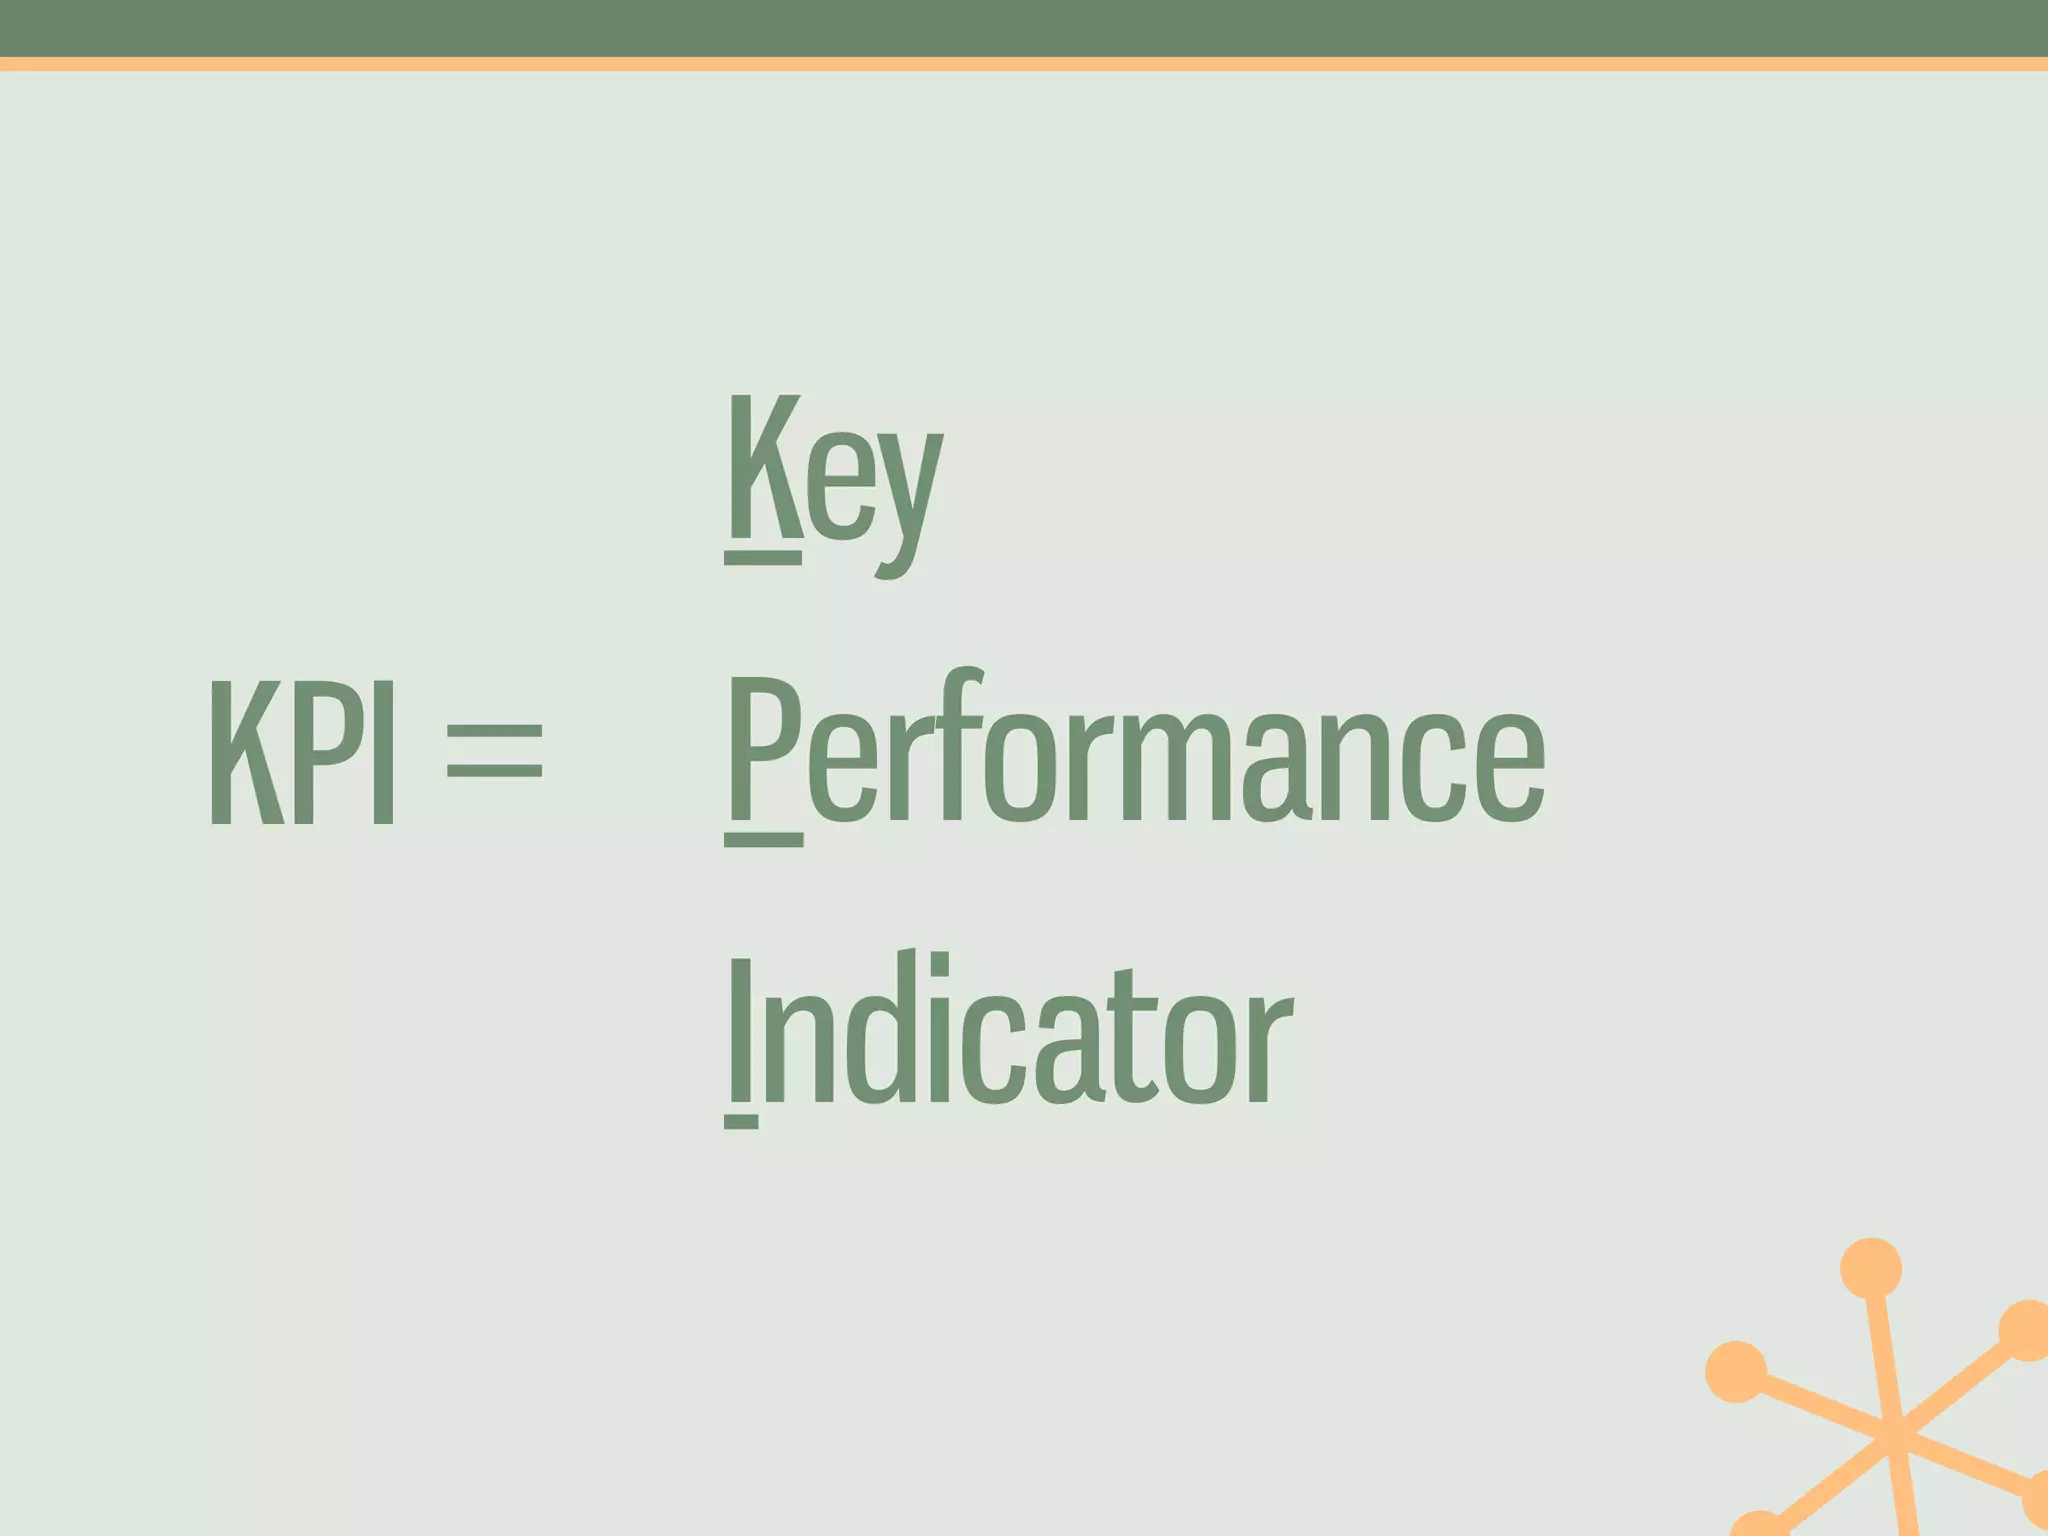
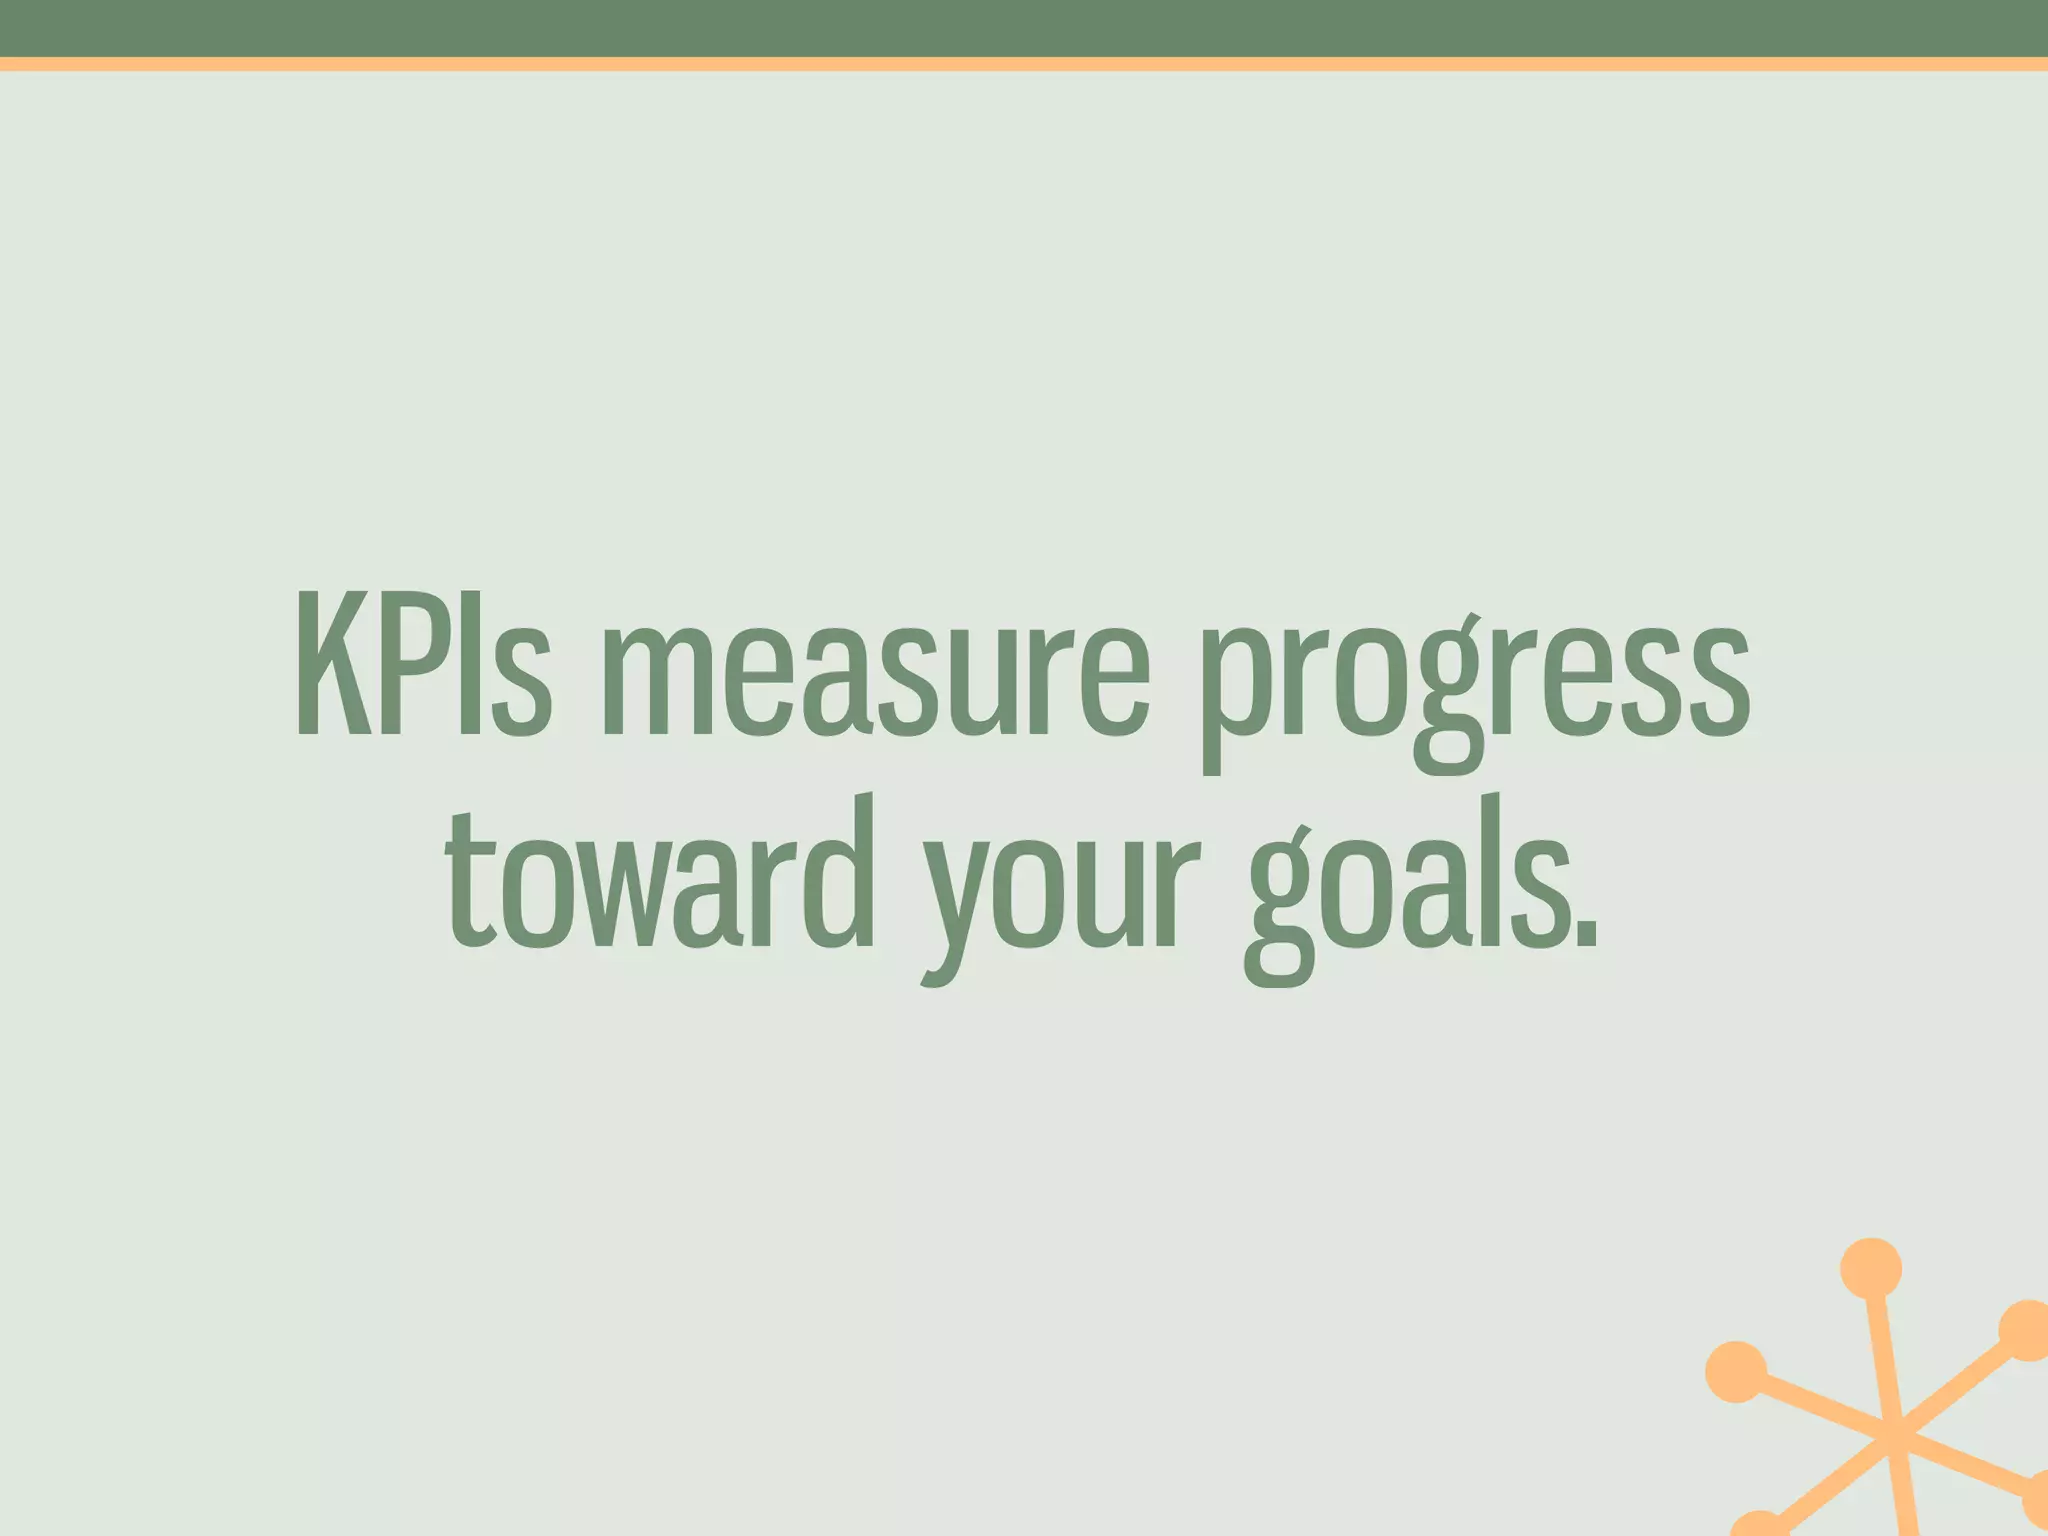
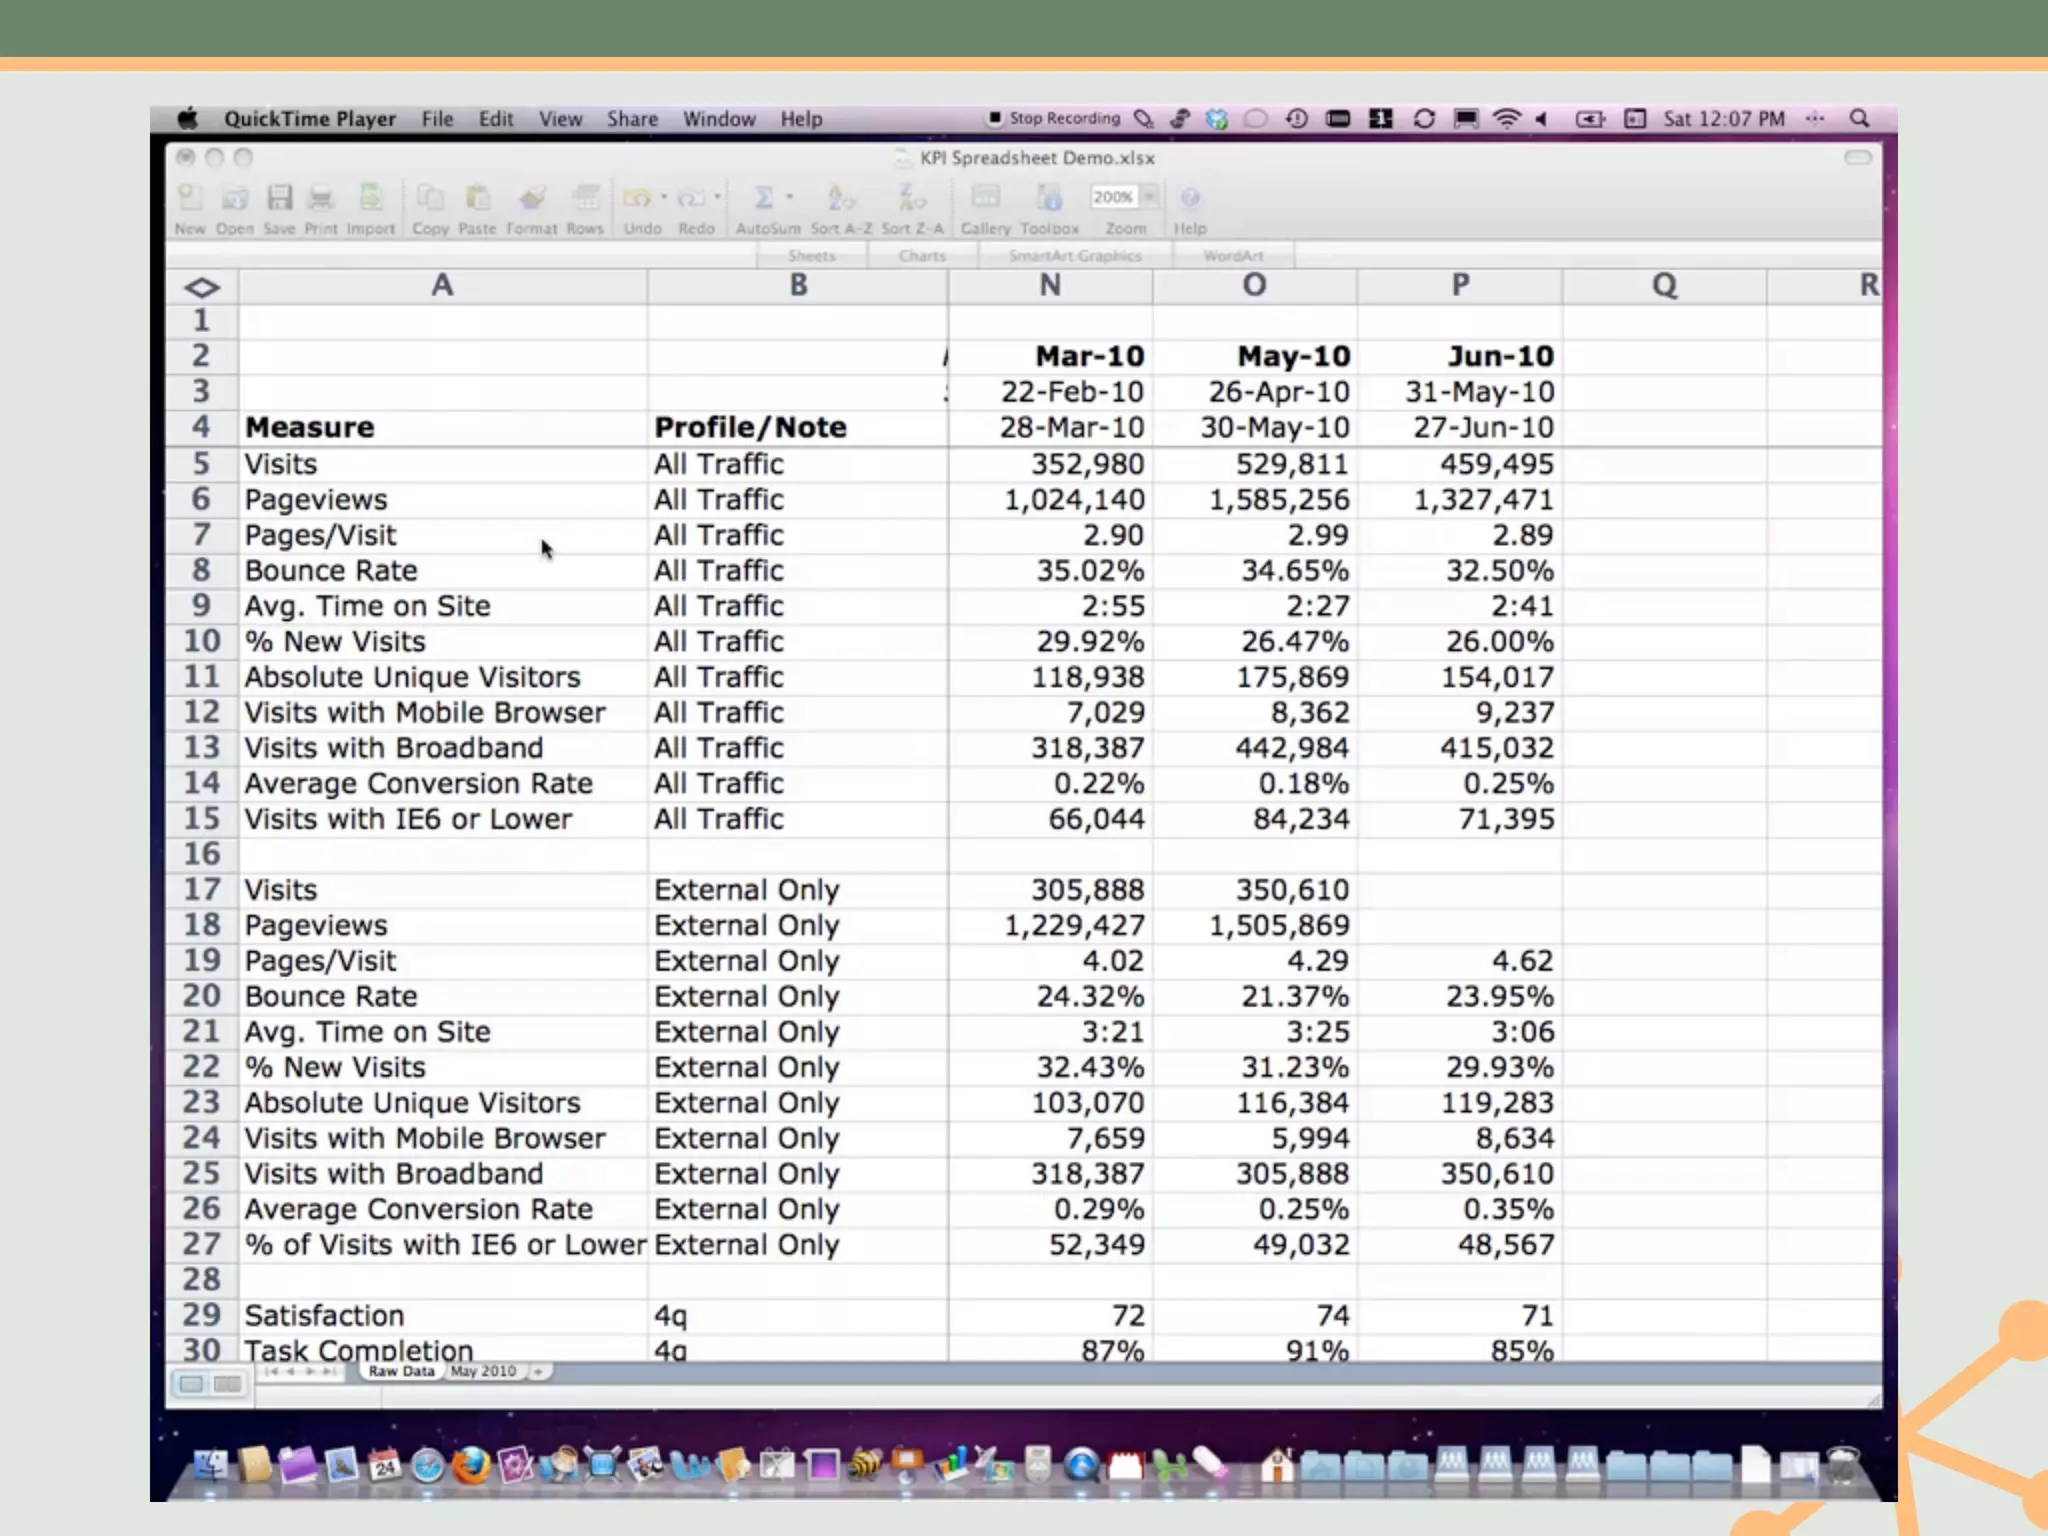
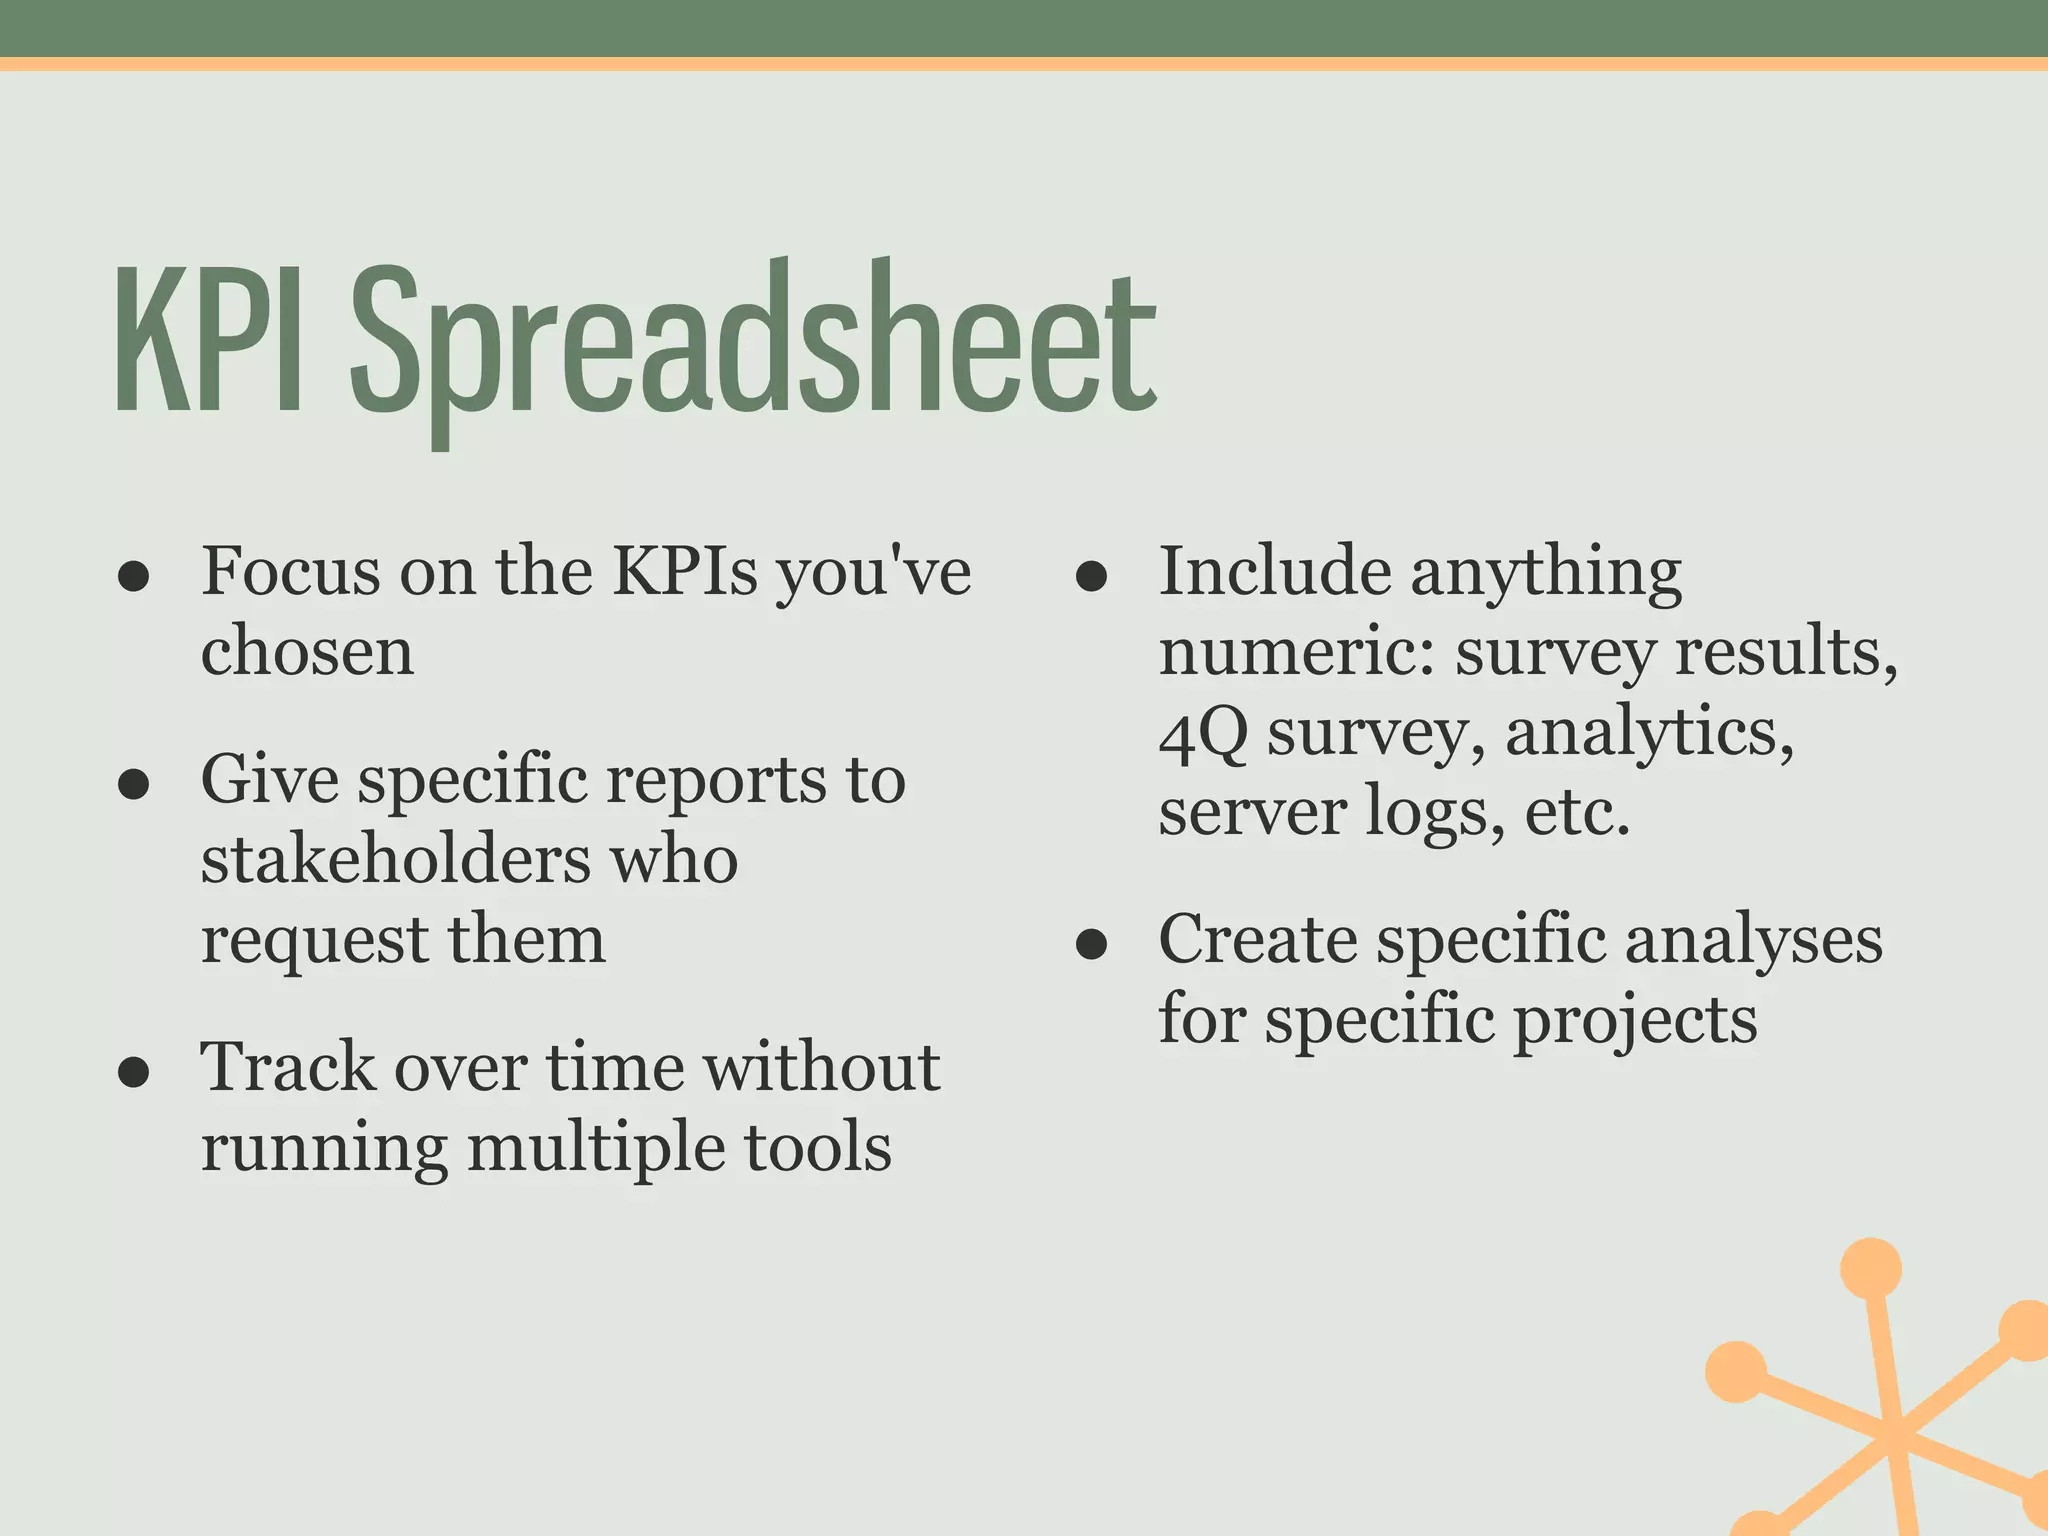
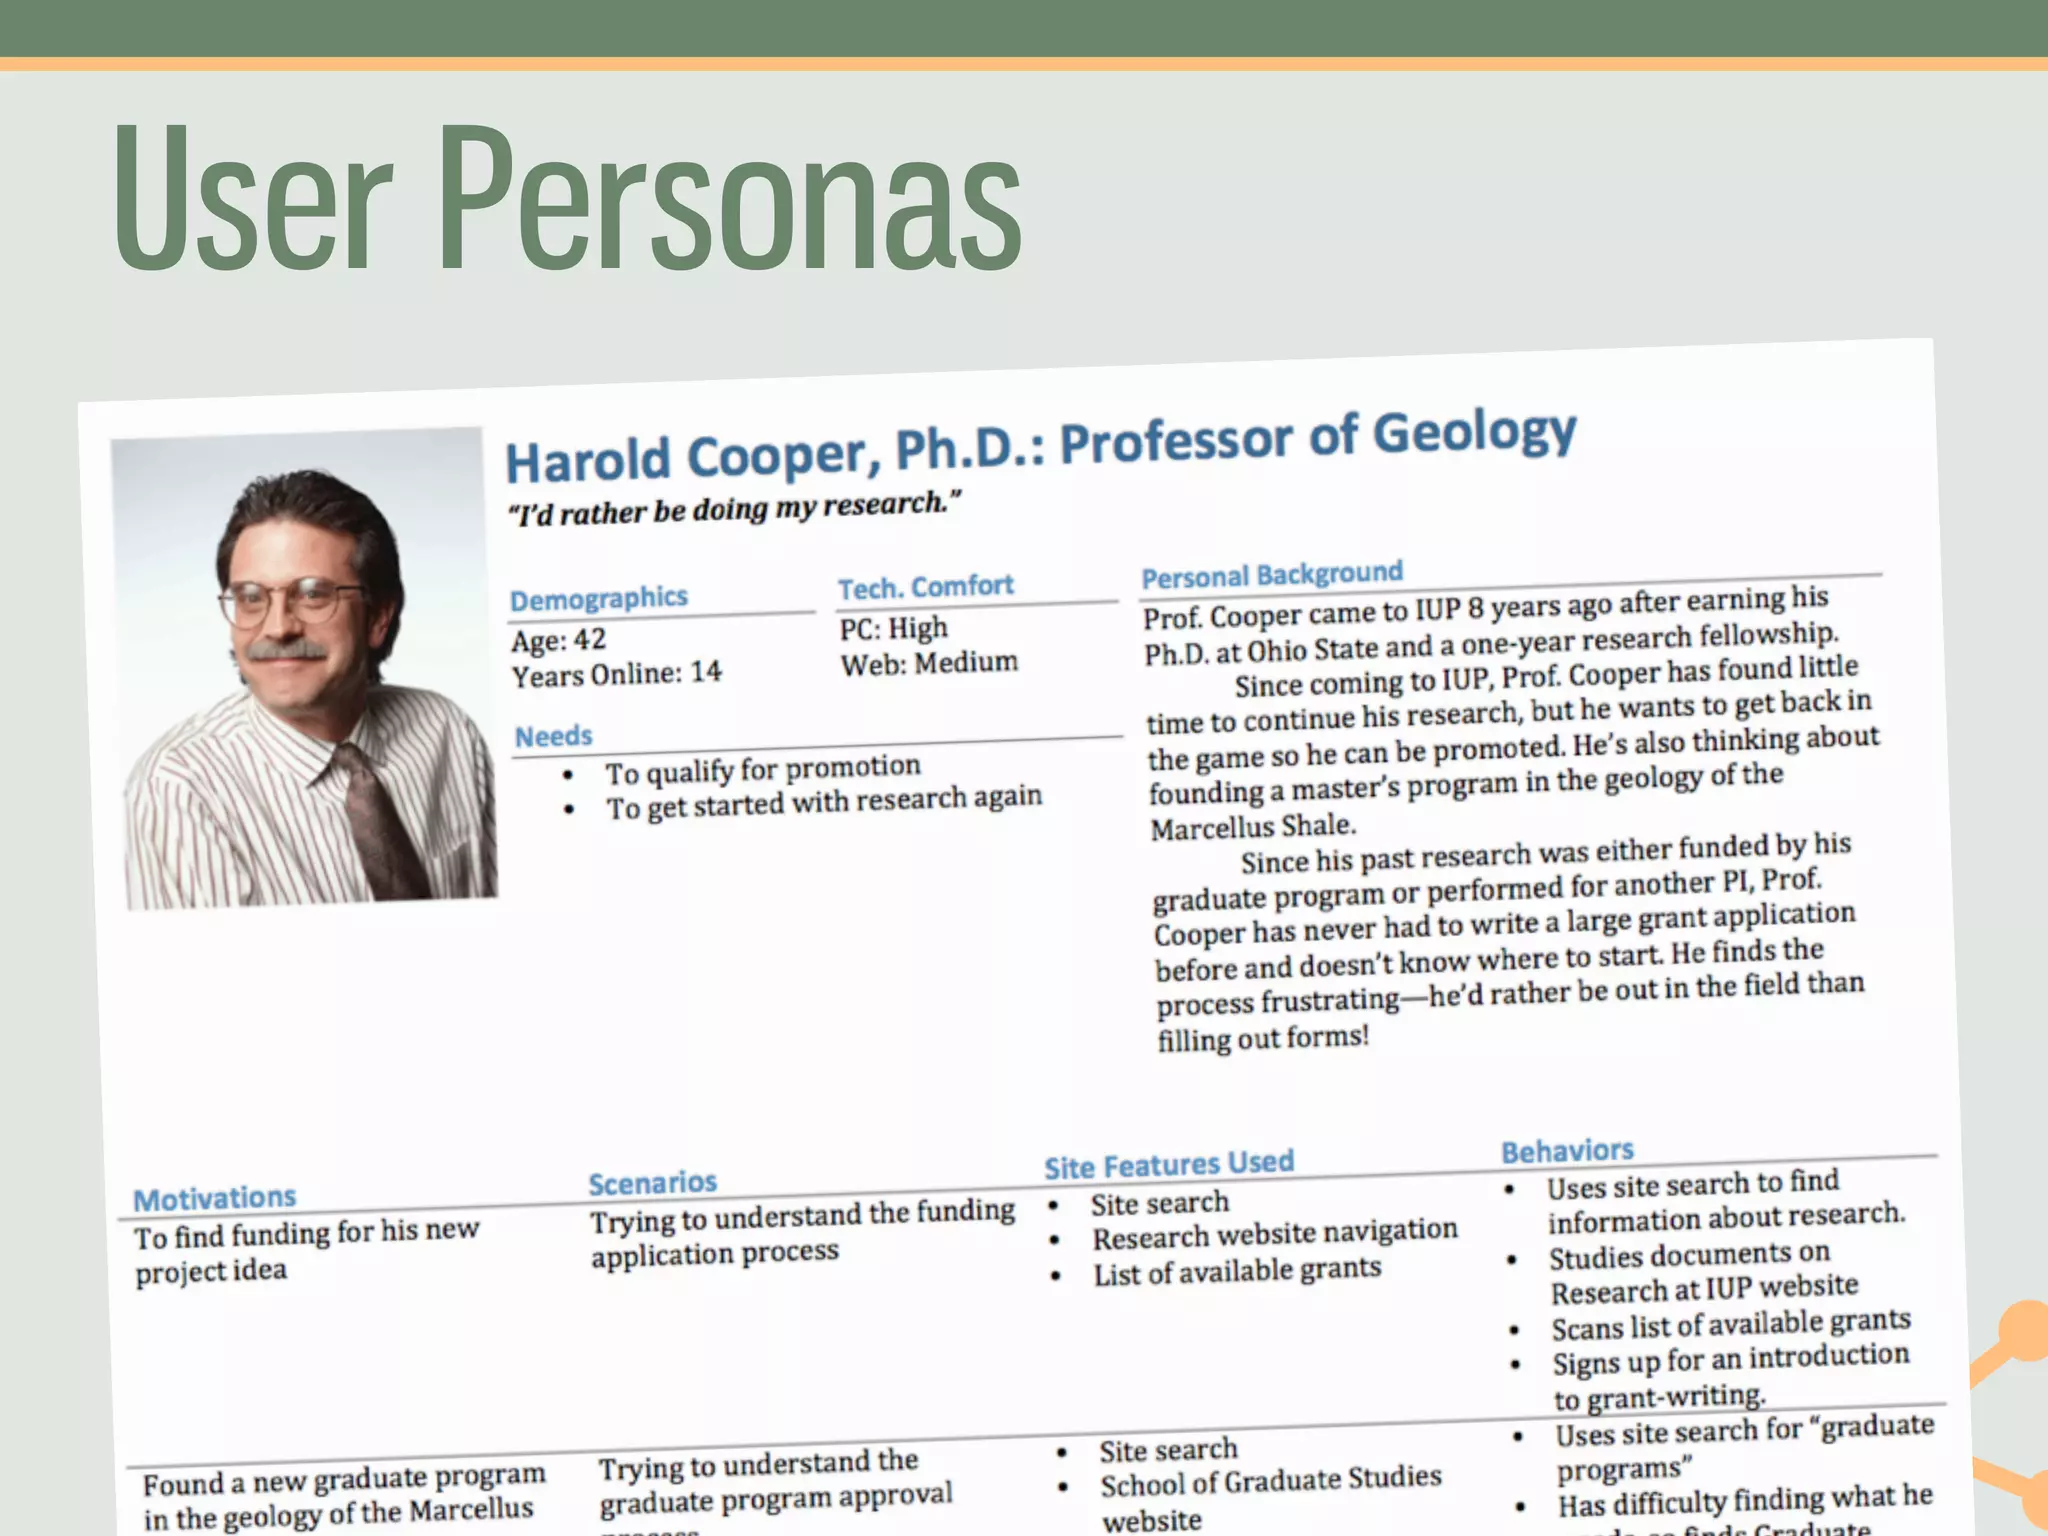
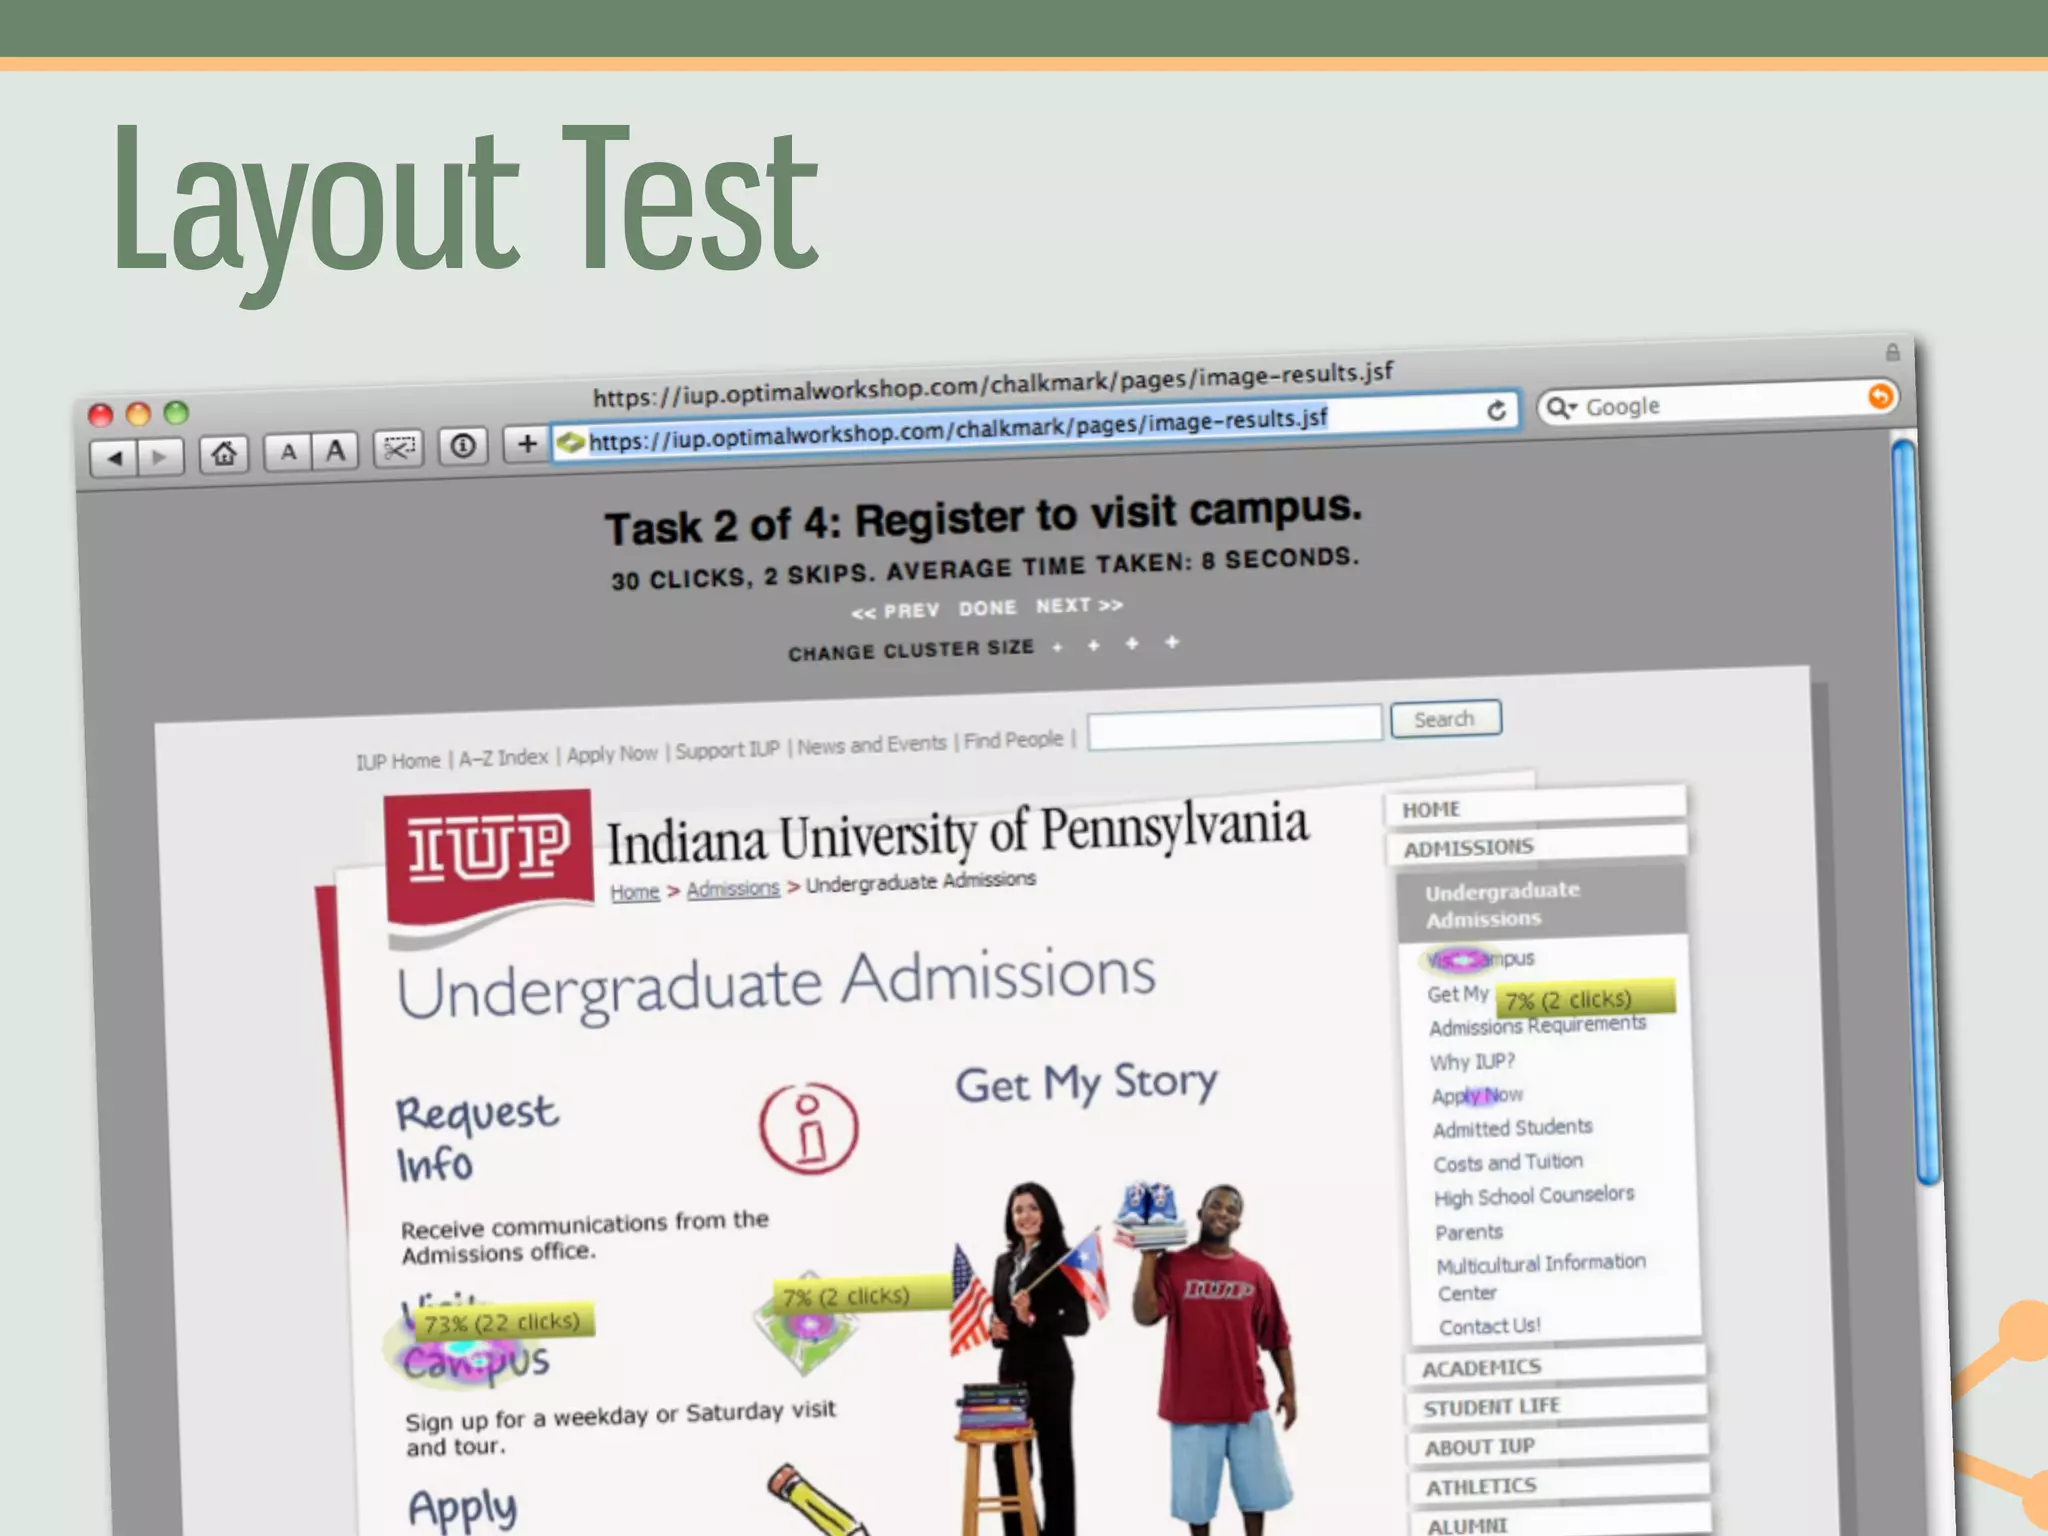
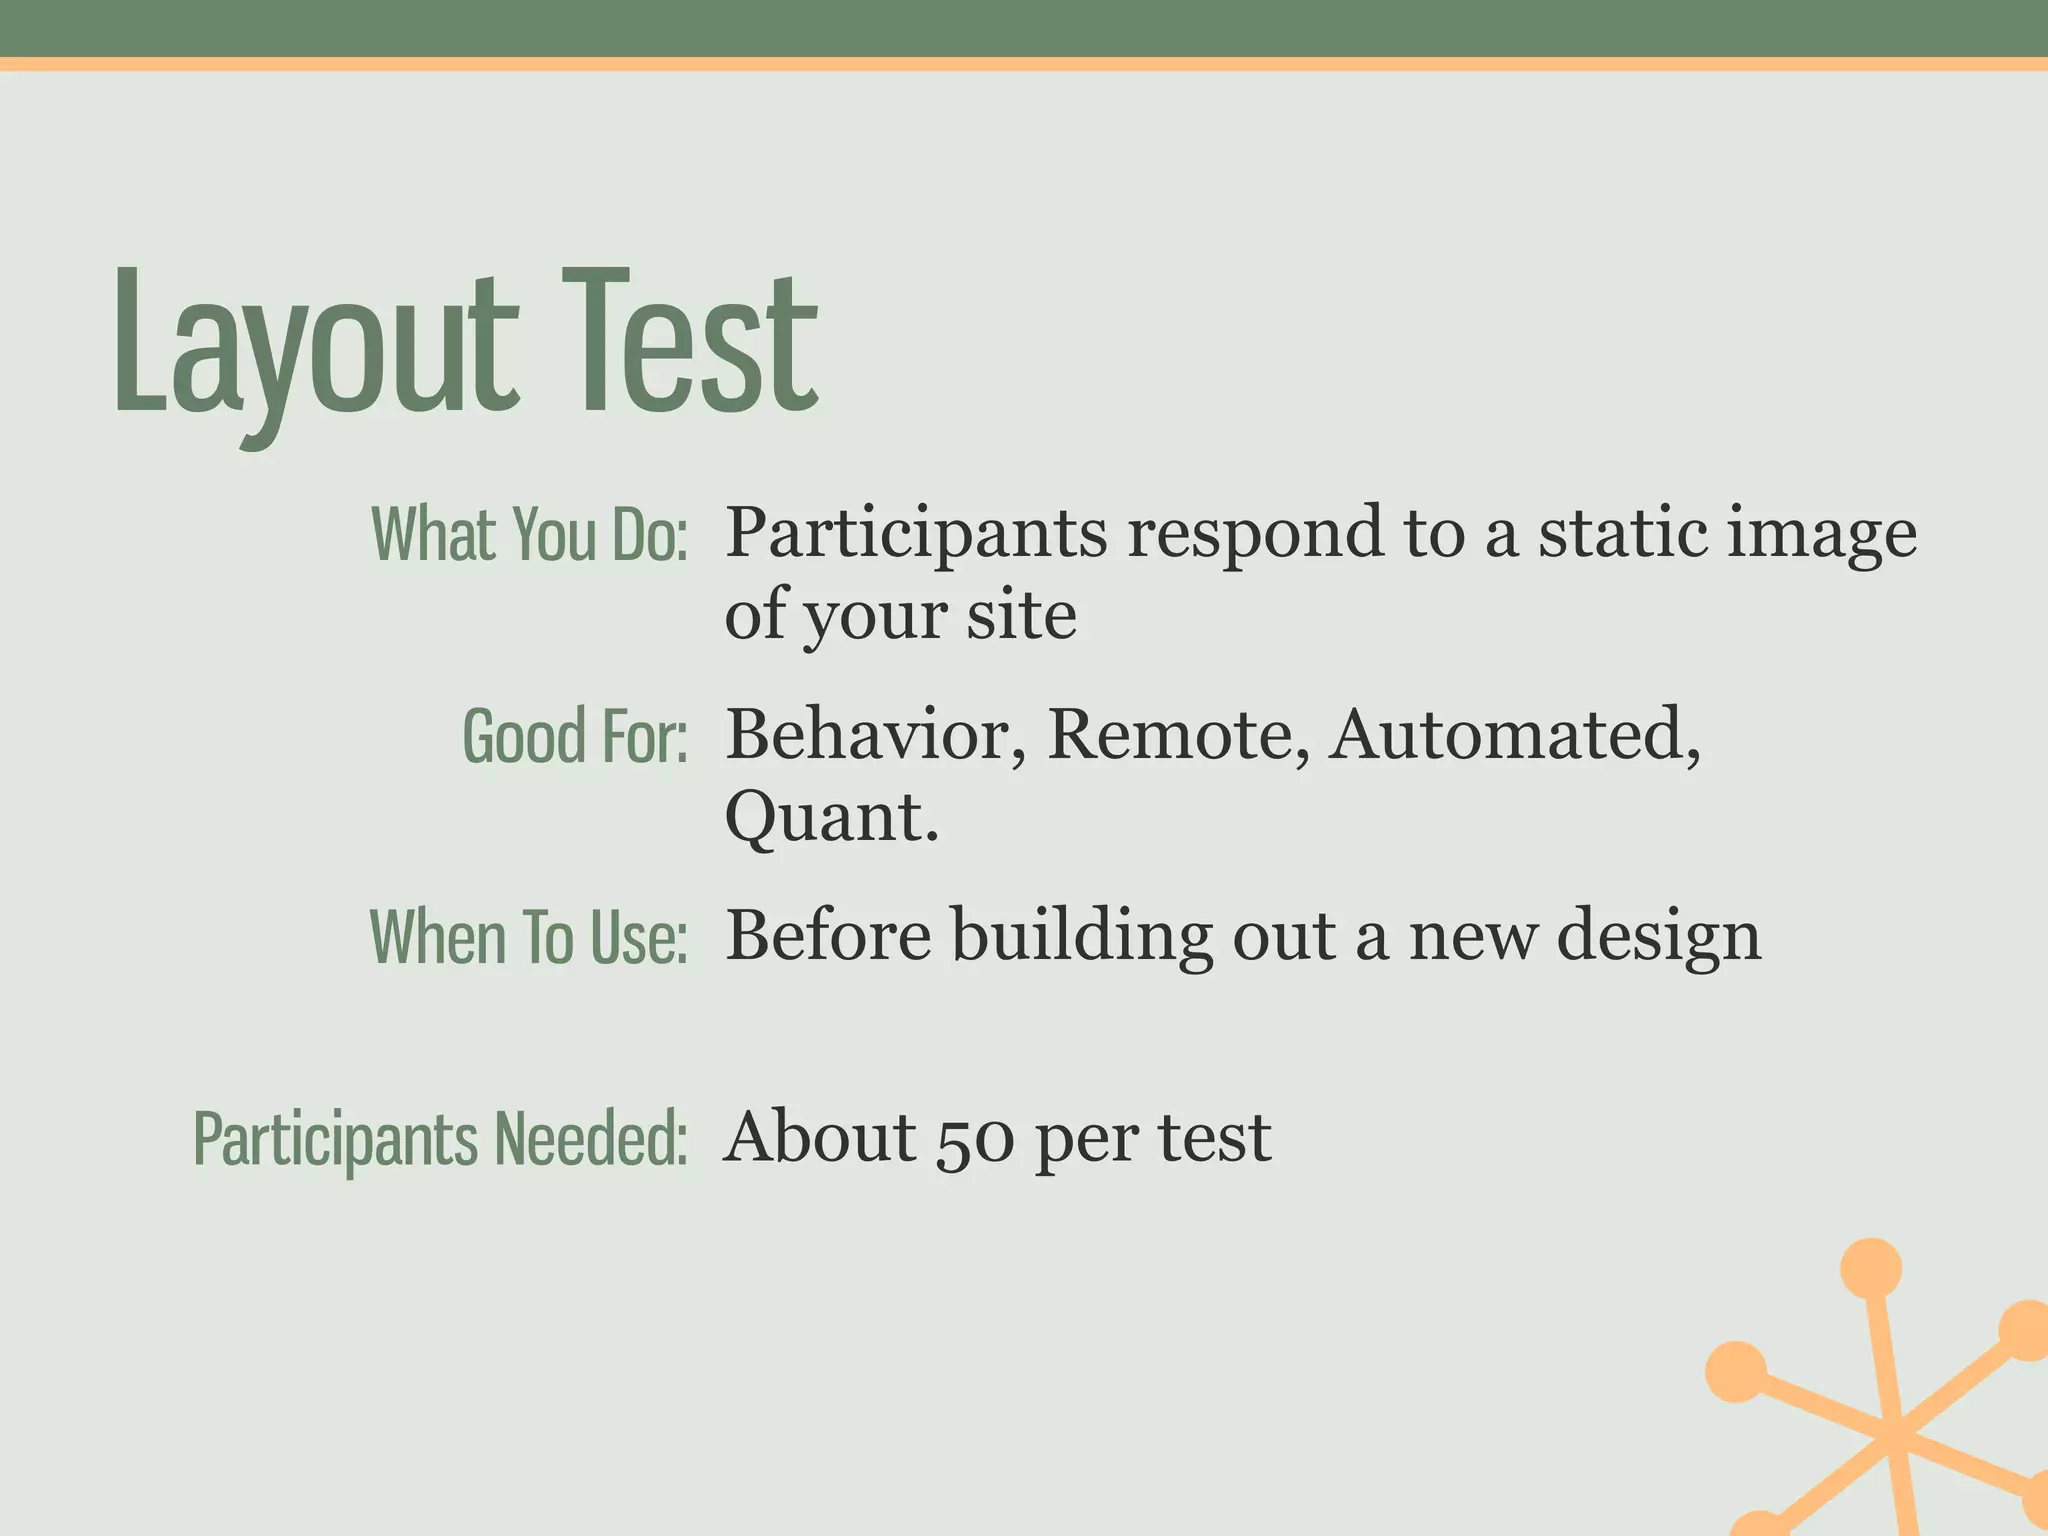
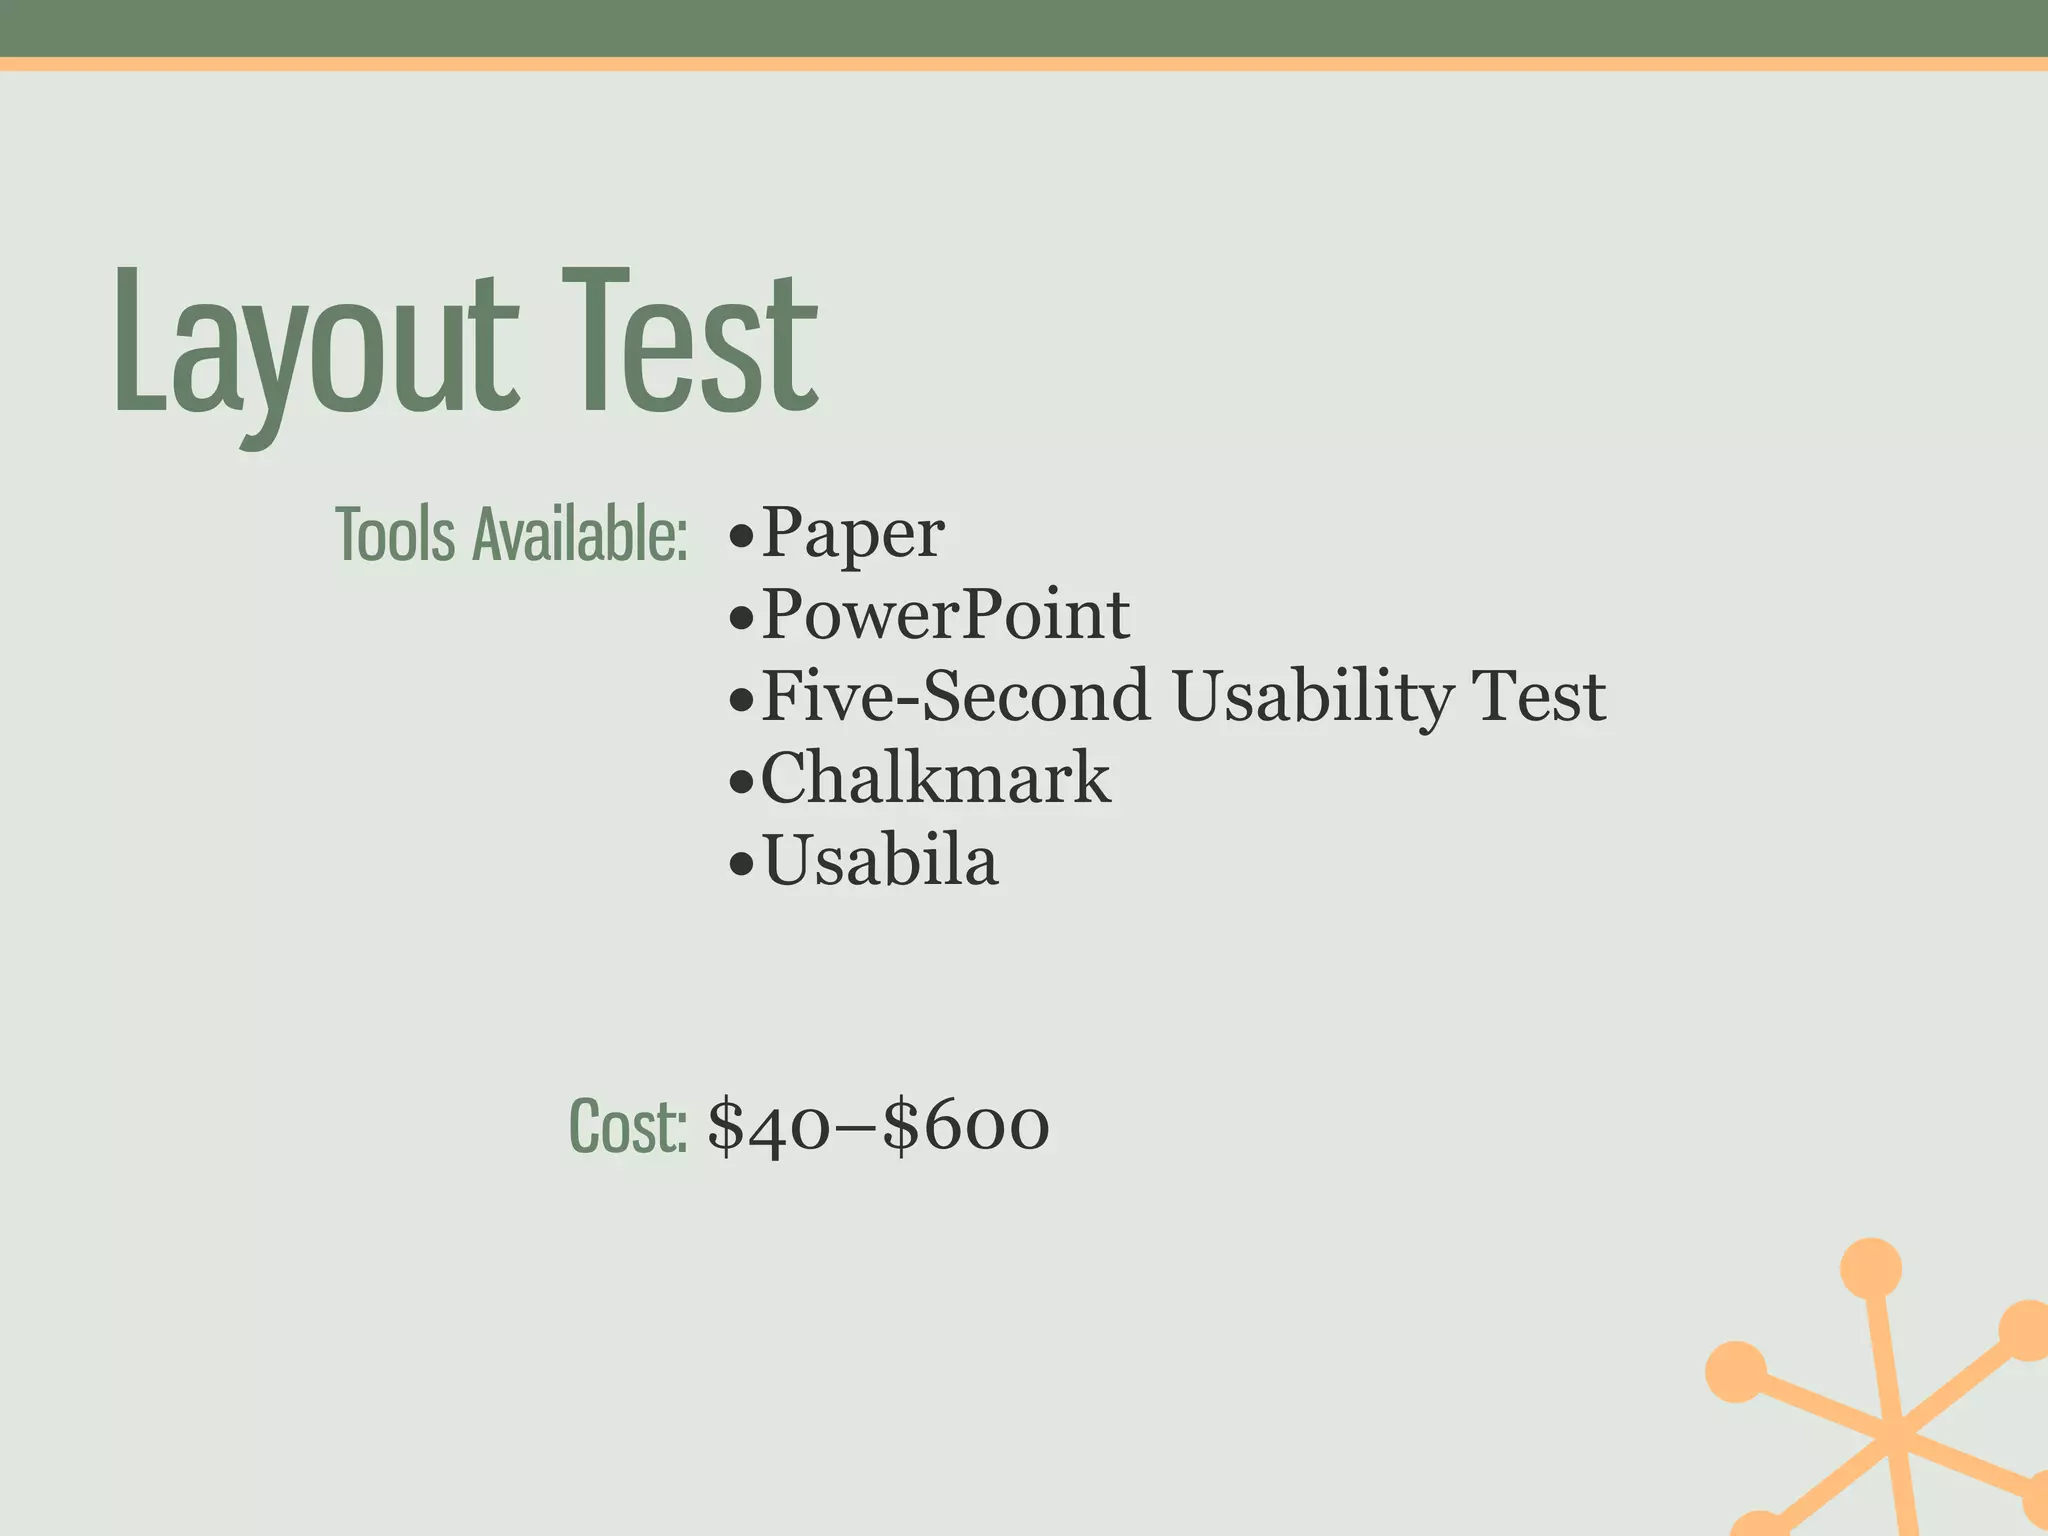
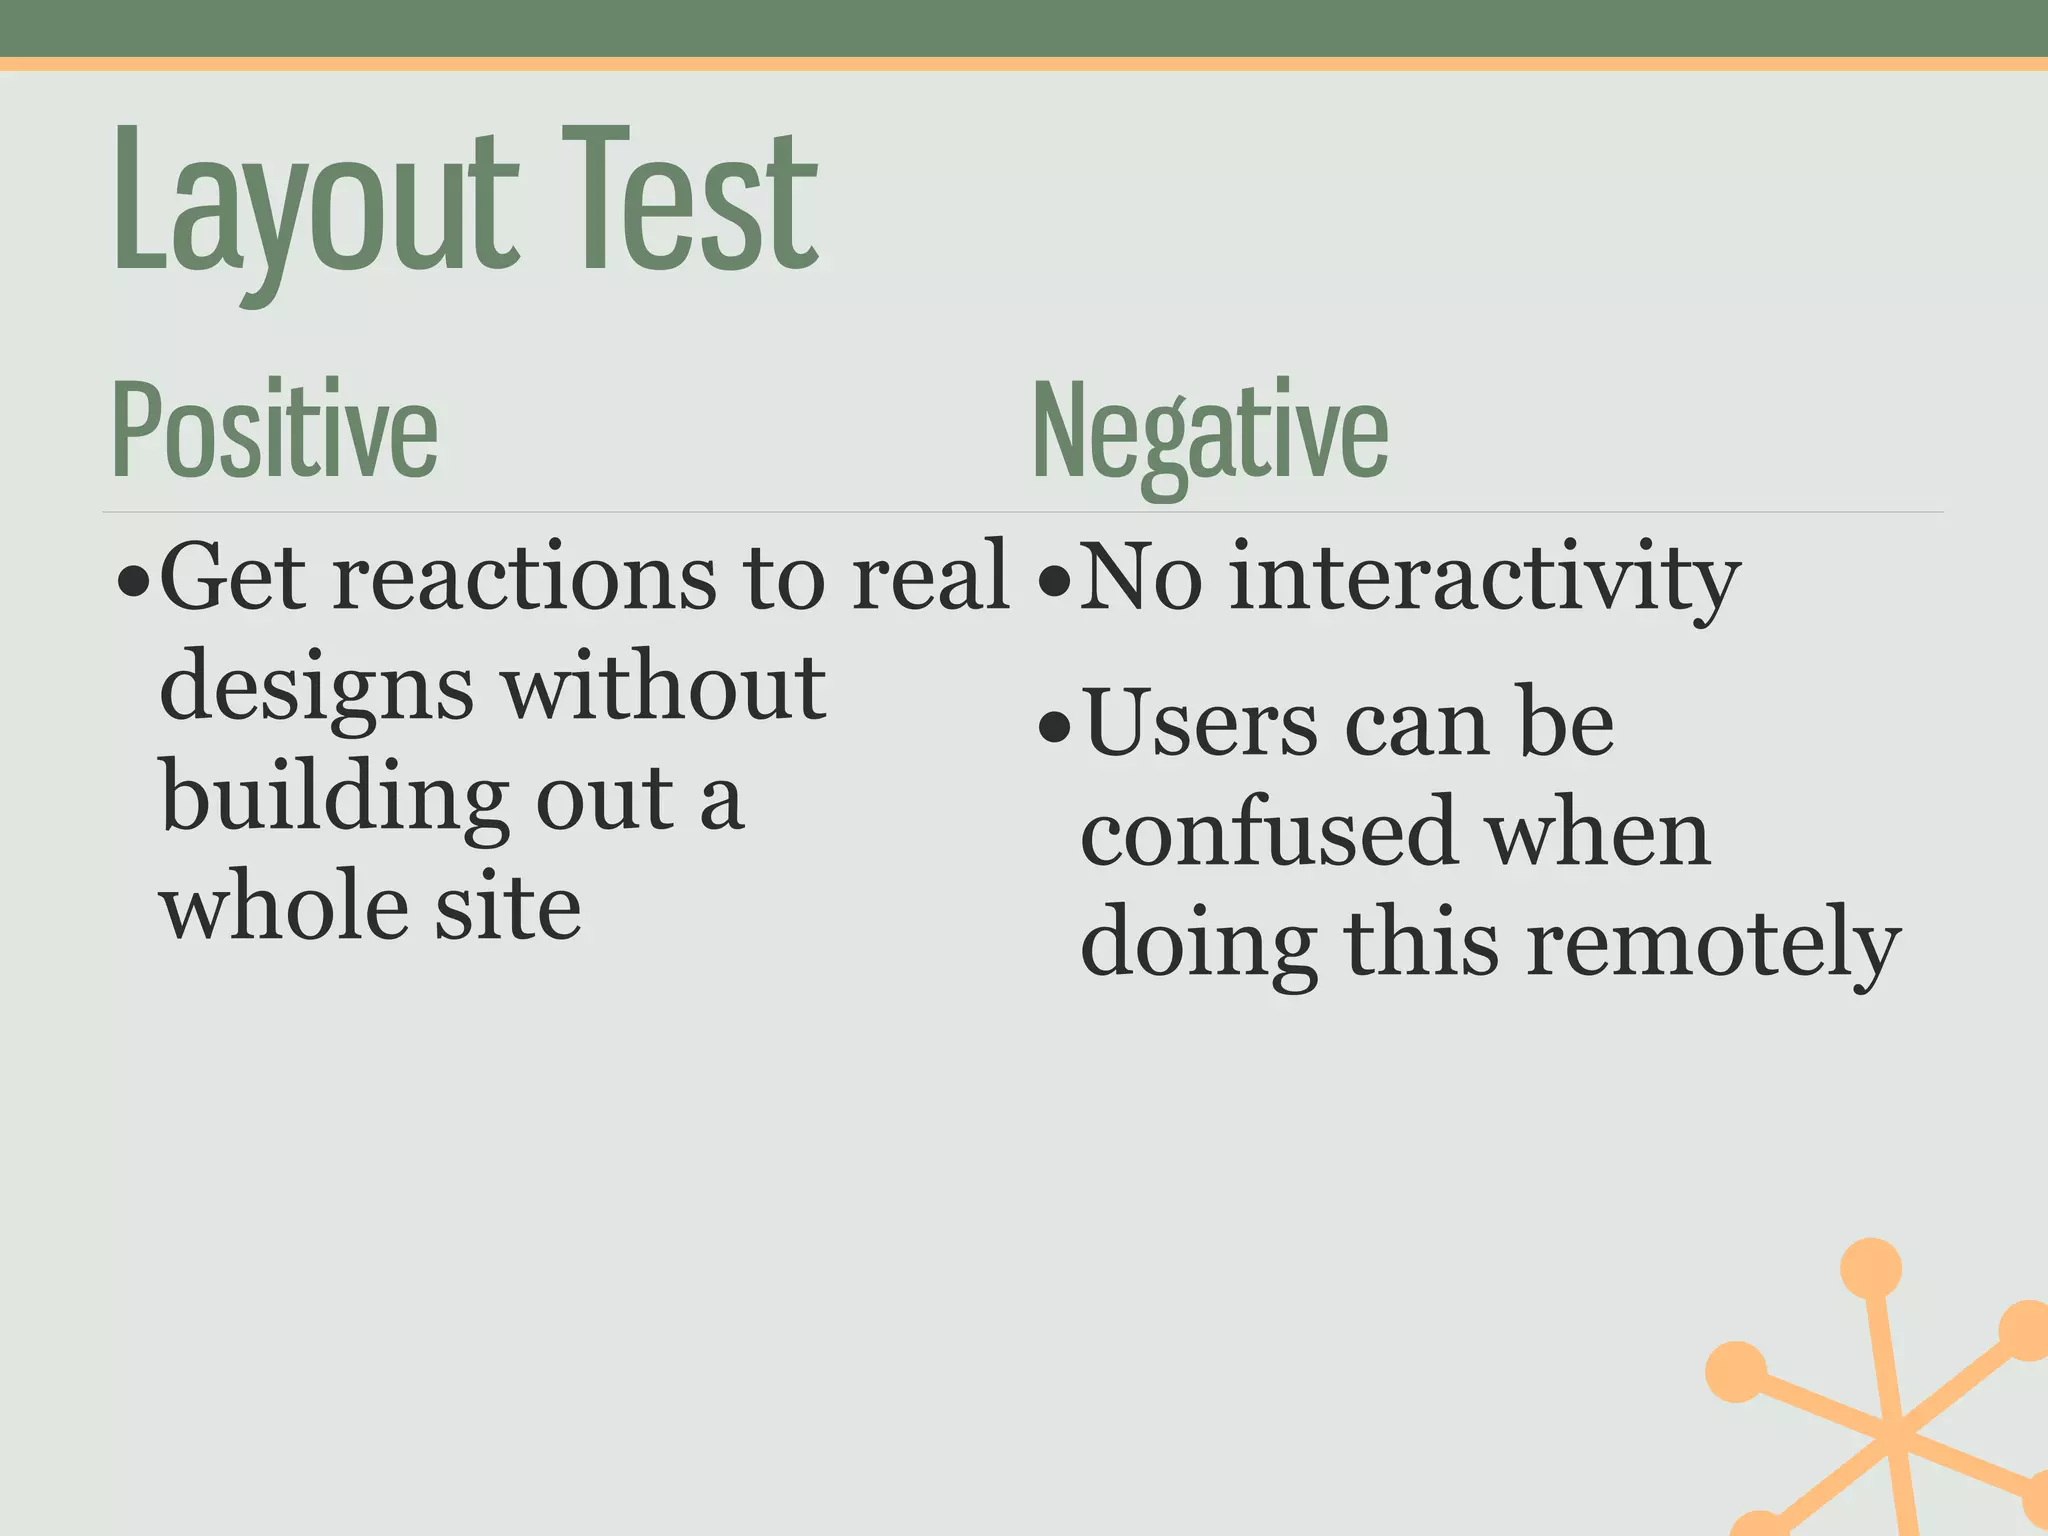
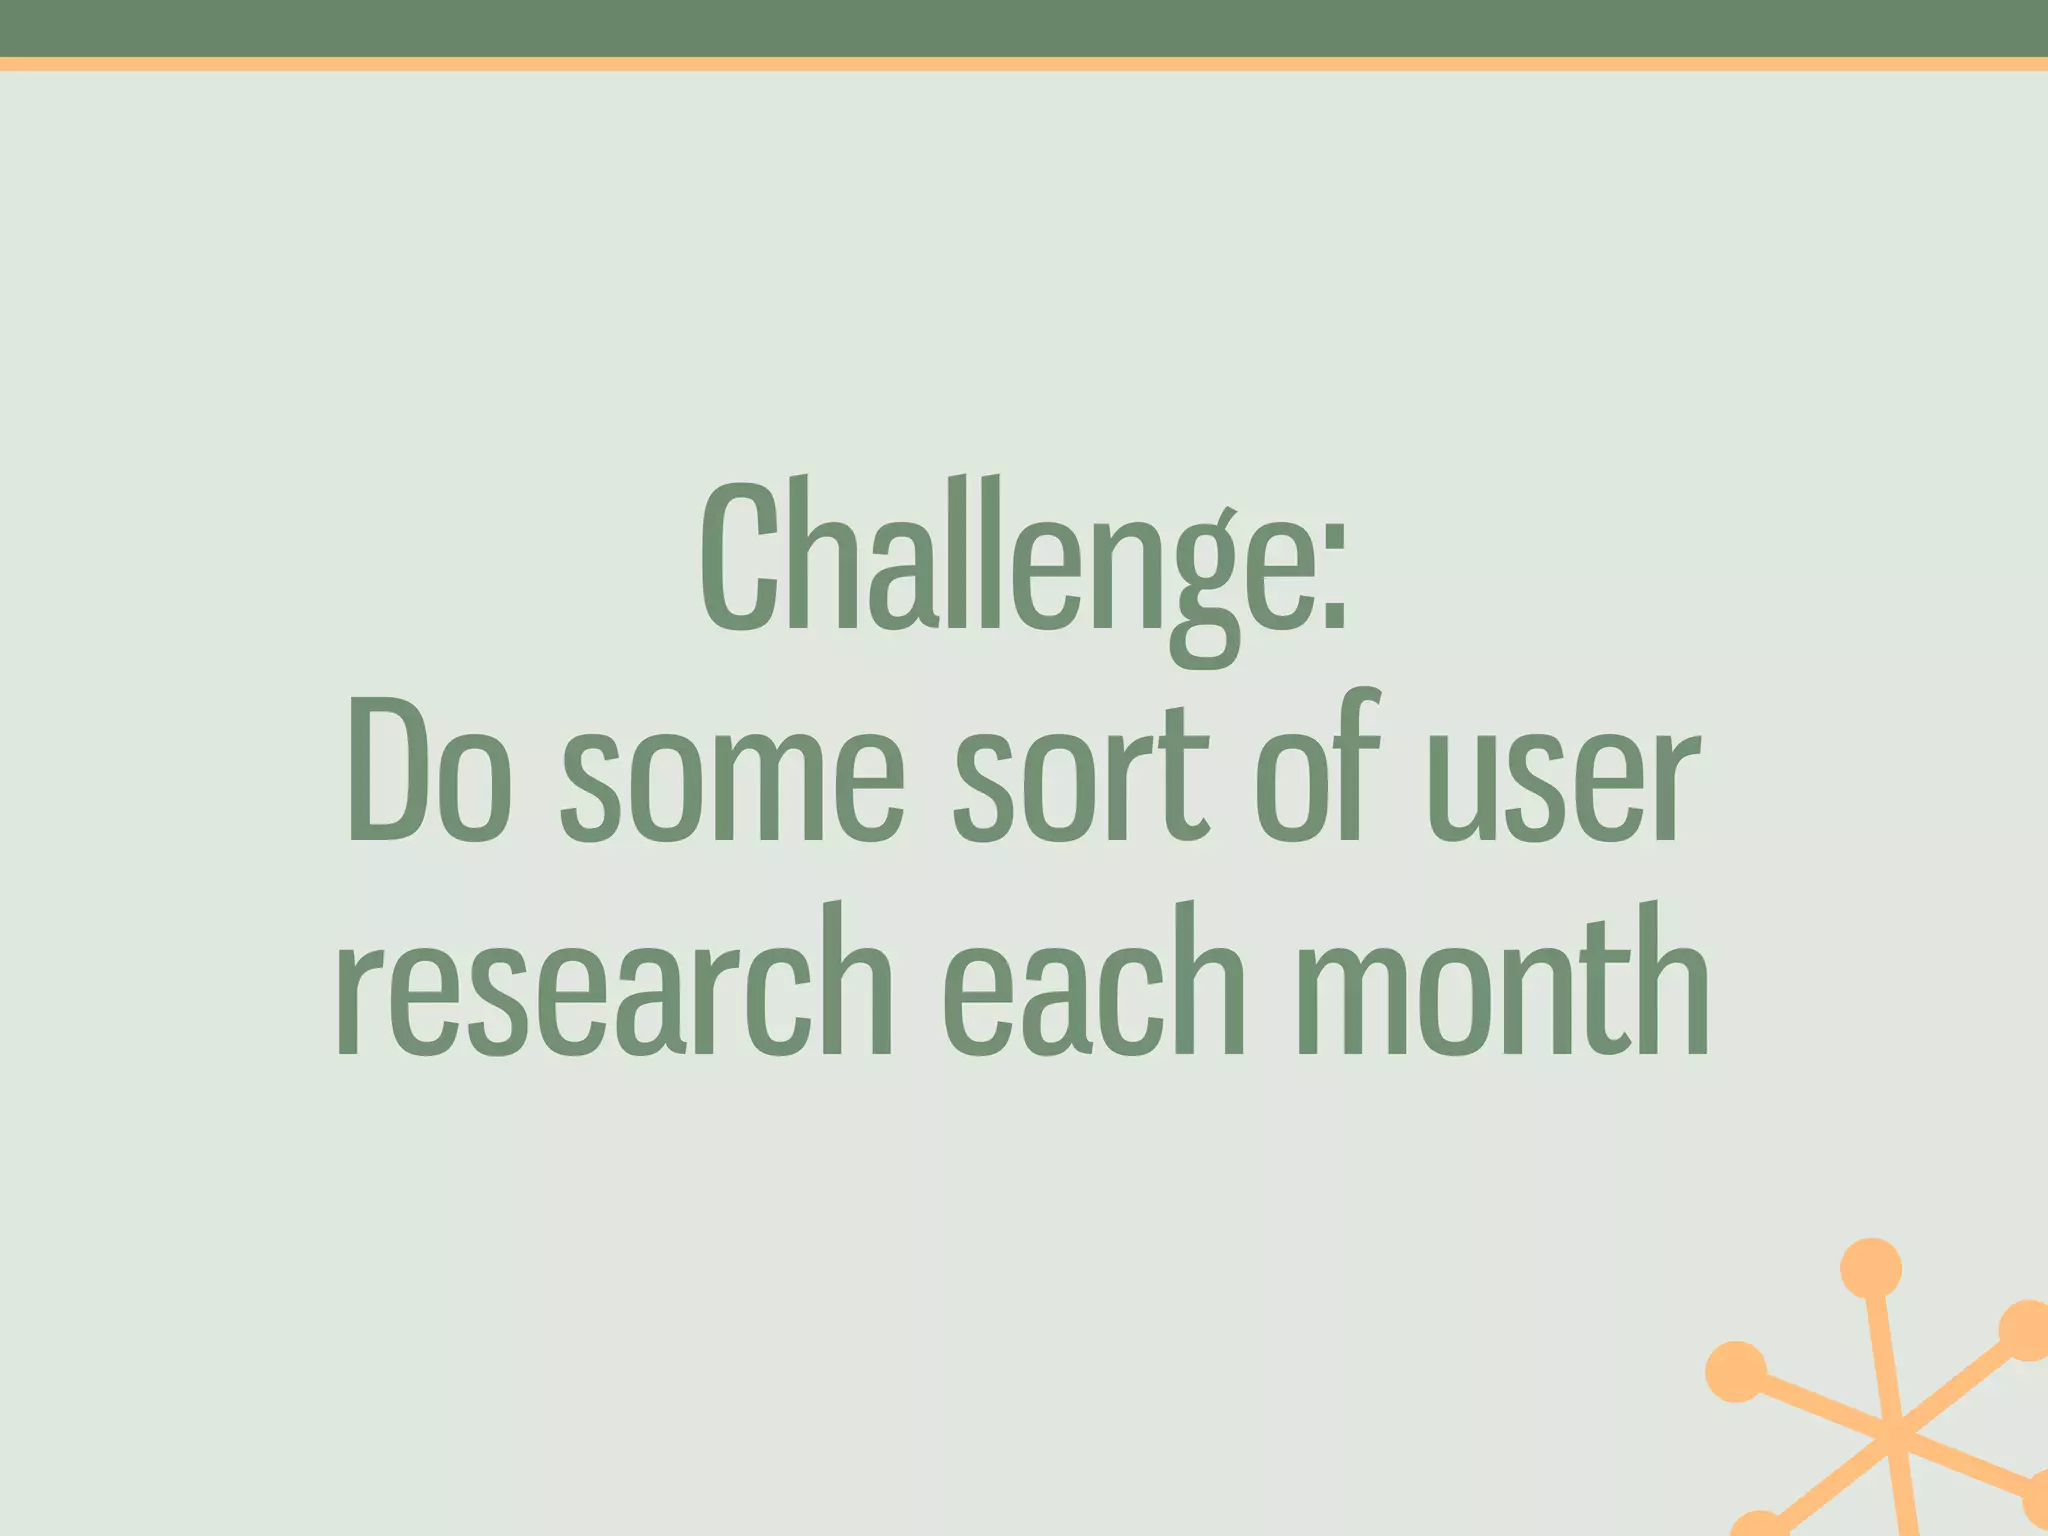
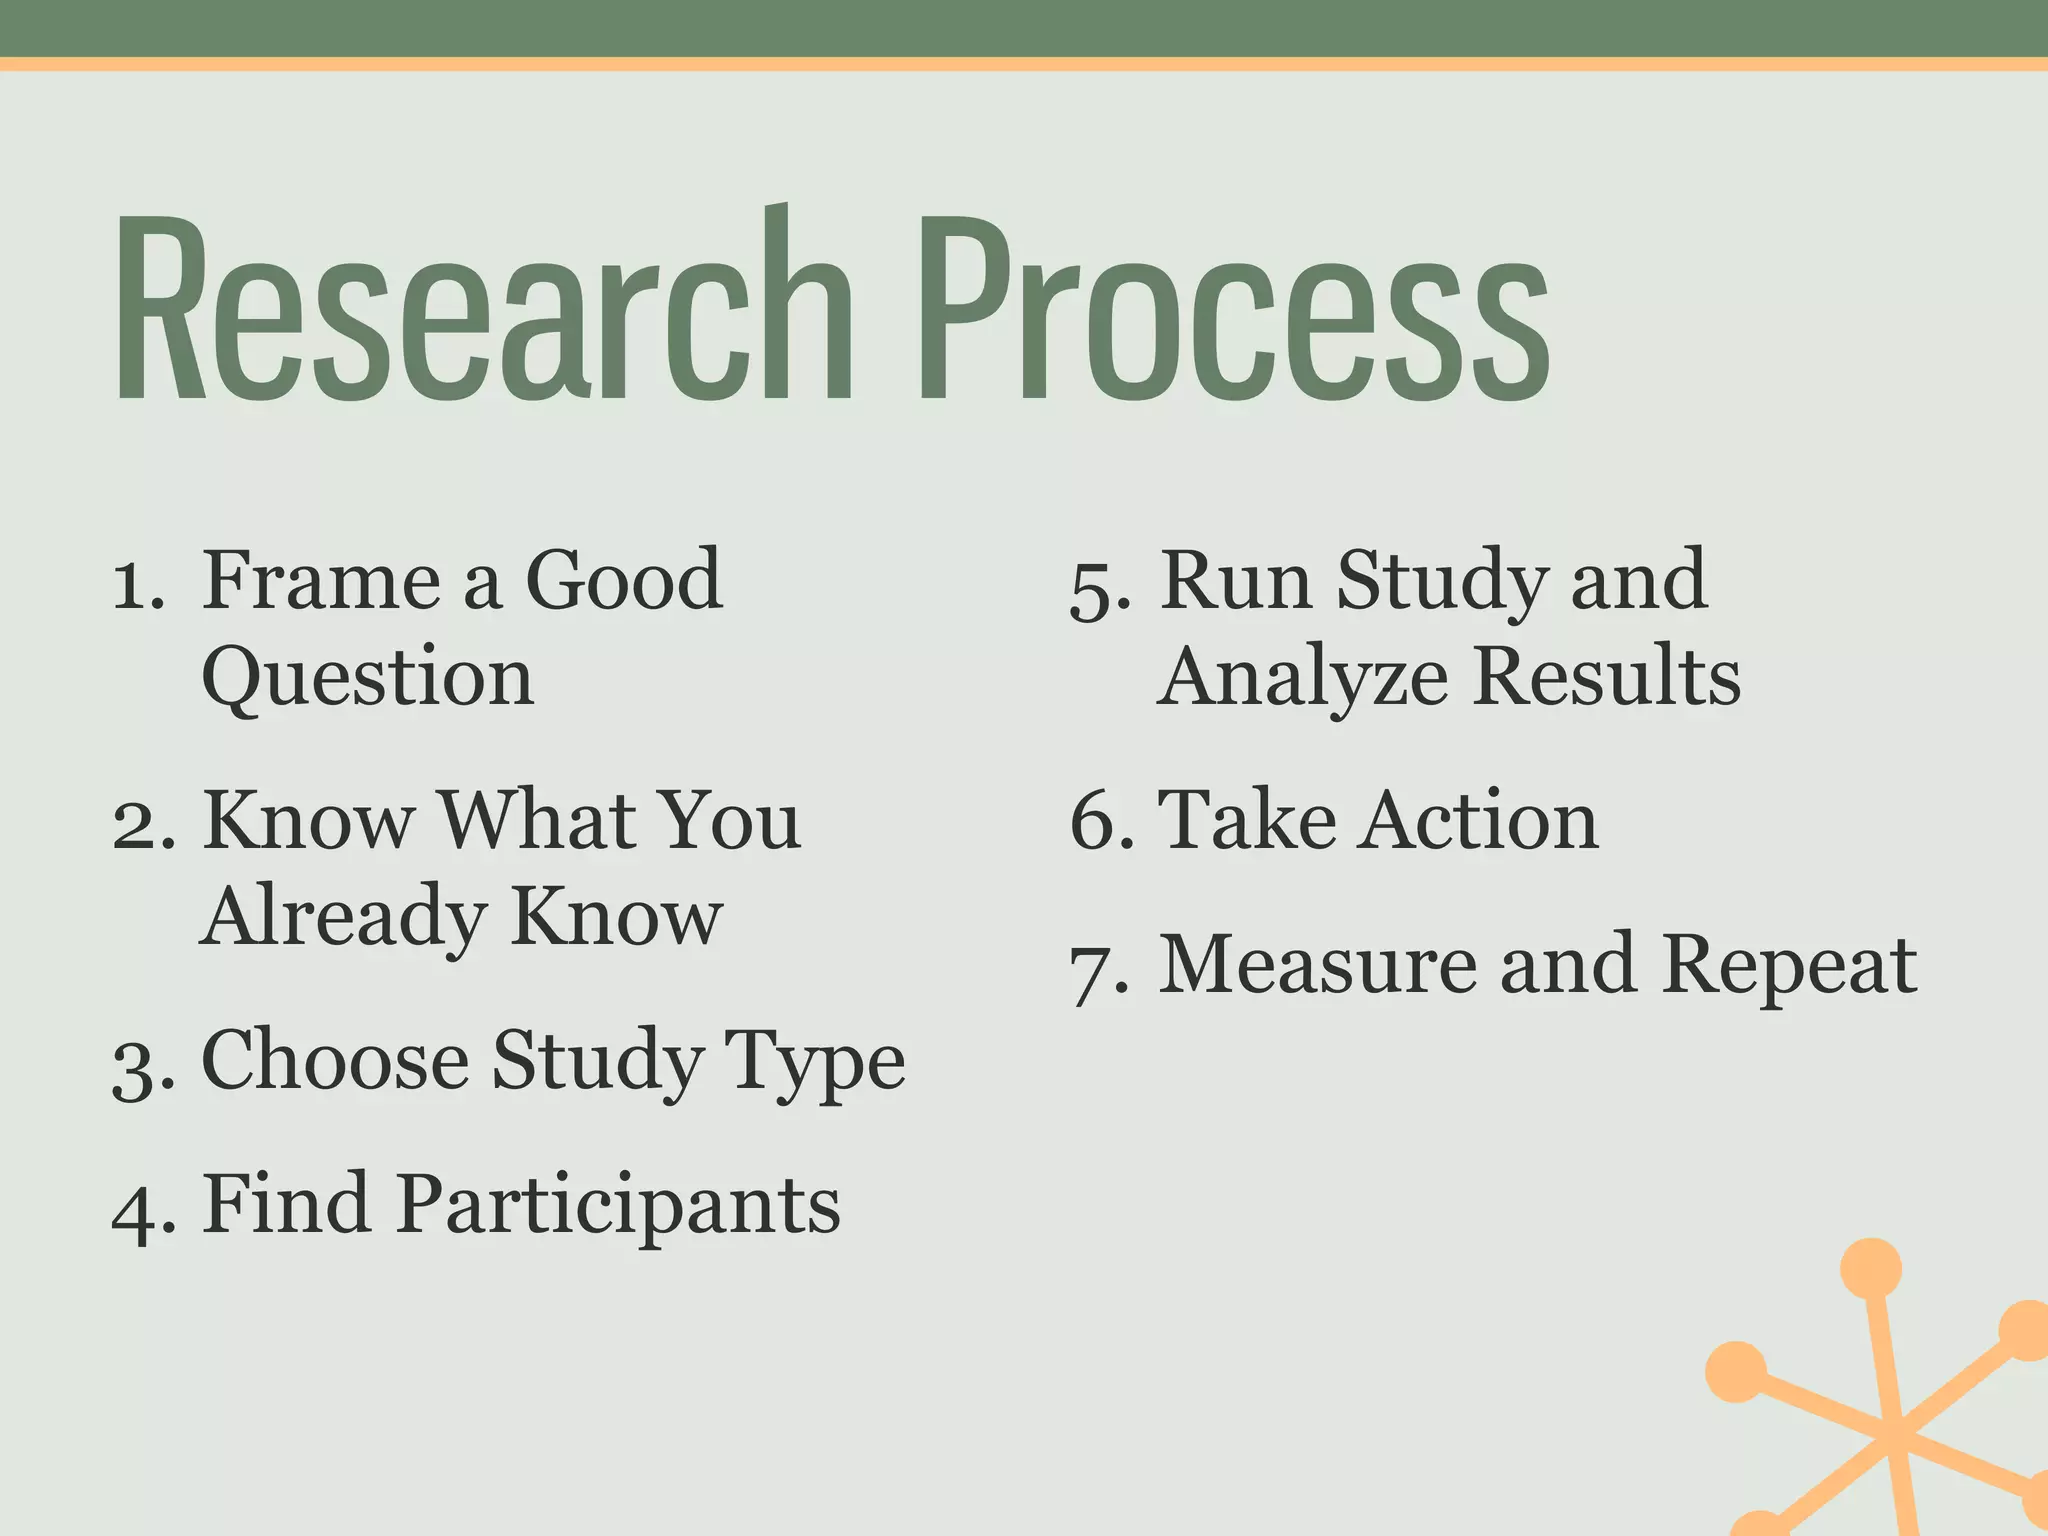
Fast, Cheap, and
   Actionable
 Creating an Affordable User
     Research Program
Michael Powers
Director of Web Services
On the Web
• museyroom.com
• twitter.com/mjpowers
• www.slideshare.net/michaelpowers
• www.linkedin.com/in/mjpowers
What kinds of
 user research
have you done?
It all started with a
    usability test
Today
• Getting Permission for Research
• A Process for User Research
• Inventory of Actionable User Research You
  Can Do Fast and Cheap
User Research Study
          ↓
User Research Program
0      Getting
    Permission
Don’t Ask
“We don’t want
“a research
“study.”
“A research study?
“Look, just make a red box on
 the home page, and put this
 text in there.
“I just need to make sure
 students don’t miss it.”
Nobody wants a
research study.
Nobody wants a website.
What We Really Want
• Applicants
• Successful Students
• Academic Research
• Donations
Create a Research
Culture
• Do a usability test and invite
  stakeholders to watch
• Make research part of every project
• Apply previous research to new projects
• Show results early and often
Research Process
1. Frame a Good        5. Run Study and
   Question               Analyze Results
2. Know What You       6. Take Action
   Already Know
                       7. Measure and Repeat
3. Choose Study Type
4. Find Participants
1         Frame a
    Good Question
Good questions are related
      to your goals
“Students can’t find
 stuff on our
 website.”
Focusing a Question
 How can we   • Can students find
 decrease       information about
 attrition?     support services?
              • Can students find
                out what’s
                happening on
                campus?
“The admissions
 website needs
 work.”
Focusing a Question
 How can we get   1. Can prospectives find
                    our list of majors?
 more/more          Our tuition
 qualified          information?
 applicants?      2. Can prospectives
                    register for a visit?
                  3. Can prospectives
                     successfully apply on
                     line?
Goal-related questions lead
 to faster, cheaper, more
 actionable user research
2   Know What You
      Already Know
What Do You Already Know?
• Best Practices    • Server Logs
• Published Studies • Analytics
• Data about Your   • Past Studies
  Institution and
  Students
Get Organized
Quantitative Data   Qualitative Data
KPI Spreadsheet     User Personas
Key
KPI = Performance
      Indicator
KPIs measure progress
  toward your goals.
KPI Spreadsheet
•   Focus on the KPIs you've   •   Include anything
    chosen                         numeric: survey results,
                                   4Q survey, analytics,
•   Give specific reports to       server logs, etc.
    stakeholders who
    request them               •   Create specific analyses
                                   for specific projects
•   Track over time without
    running multiple tools
KPI Spreadsheet
Available on museyroom.com
User Personas
Include Scenarios
                         Site Features
 Motivation Scenario     Used          Behaviors
 Find the Checks to see •Site Search •Looks for
 school     if her major                “Pre-
 with the is available •Undergrad       Law”
 right pre-                Admissions major,
 Law                       Website      does not
 program                                find it.
 for me                  •Academics
                           Link
User Personas
•   Fiction—but a useful        •   Helps bring new team
    fiction                         members up to speed

•   Puts what you've learned
    into a format you can
    share with your team
    and clients


•   If it is wrong, team or
    clients will let you know
Use these two tools to track
       your progress
         over time.
3   Choose Study
            Type
If you’ve never done one, do
     a usability test first.
Focus
Groups
Some Types of User Research
• Usability Test   • Navigation Test
• Surveys          • Layout Test
• Pop-up Survey    • A/B Test
• KJ Session
• Card Sort
Some Types of User Research
• Usability Test   • Card Sort
• Surveys          • Navigation Test
• Pop-up Survey    • Layout Test
• KJ Session       • A/B Test
Usability Test


          Photo source: http://www.flickr.com/photos/l-i-n-k/3654390818/
Analytics
Survey
Pop-Up Survey
Pop-up Survey
      What You Do: Ask site visitors questions about their
                  experience on a particular page or the
                  whole website.
         Good For: Capturing user intent; settling
                  arguments about what belongs where
      When To Use: When you have a question to answer,
                  or all the time
Participants Needed: Calculate your sample size:
                  http://www.surveysystem.com/
                  sscalc.htm
Pop-up Survey
  Tools Available: •4Q Survey
                •iPerceptions
                •CrowdScience
                •Roll your own


          Cost: •$0–$10,000+
4Q Survey Questions
1. Based on today's visit, how would you rate your site
   experience overall?
2. Which of the following best describes the primary purpose
   of your visit?
3. Were you able to complete the purpose of your visit today?
4. Comment
  •   If yes: What do you value most about the website?
  •   If no: Please tell us why you were not able to fully
      complete the purpose of your visit today
“I am always able to   “I can never easily
find what I am          find what I'm
looking for. The
website is really      looking for, if I can
easy to use.”          find it at all.”
Coding Comments
• Visual Design        • Navigation Positive
  Positive
                       • Navigation Negative
• Visual Design
  Negative
                       • Content Quality
                         Positive
• Usability Positive   • Content Quality
• Usability Negative     Negative
637,'809':-%&-'*(##%+,';+<'
                   NF,)/+O)-./"
               (:L8")/2"M*:/58"
                  J+8I)4"K:8+,/""
                         @8)34:"
                    1+/2"A:.=4:"
2(405-'


                9./5:/5"HI)4+56"
                                                                                                        (:,)-*:"
                    <+5:"<:)F>G"
                                                                                                        A.8+-*:"
          ;@A"B:38+5:C"/./D9E<"
              <=:>+?>"=),:08+5:"
            7)8"9./5:/5";"(::2"
          ()*+,)-./01+/2)3+4+56"

                                    !"   #!"     $!"    %!"   &!"   '!!"   '#!"   '$!"    '%!"   '&!"
                                               !"#$%&'()'*(##%+,-'.%+/(+0+1'230-'2(405'
67'57"3#4'5&"8'9":&*;&"/#00*12"
                               <#&2"%#&'()*=>+,*-.()*=>"?1@"
                   SK1.40T.234#
               -?Q=#.47#R/?4:=#
                  O0=N.9#P?=014##
                         E=.89?#
                    6047#F?3B9?#
3#4'5&"


                >34:?4:#MN.90:;#
                    A0:?#A?.KCL#                                                             -?1.2/?#

          @EF#G?8=0:?H#434I>JA#                                                              F3=02/?#

              AB?C0DC#B.1?5=0:?#
            <.=#>34:?4:#@#-??7#
          -./01.23456047.8090:;#

                                    !"# $!"# %!"# &!"# '!"# (!"# )!"# *!"# +!"# ,!"# $!!"#
                                                 !"#$"%#&'()*+,*-.()*"/#00*12&"
Action
• Changed our yearly goals to spend more time
  on these issues
Card Sort


      Photo Source: http://www.flickr.com/photos/rosenfeldmedia/3343501403/
Card Sort
      What You Do: Give participants cards with website
                   topics on them, then ask them to put
                   them into piles that make sense to
                   them
        Good For: Understanding the mental models of
                   your users
         When To Use: When creating or improving your
                      information architecture/navigation
 Participants Needed: 15 face to face
                      50 online
Card Sort
   Tools Available: •Index cards
                 •OptimalSort (remote)
                 •WebSort (remote)
                 •xSort


           Cost: $40-$600
Open                        Closed
•   Users stack cards       • Give users header
    then                      cards
•   Give each pile a name   • They assign cards to
                              the header cards
Where do we put
  counseling?
Action
• Complete restructuring of the Student Life
  section of our website
• Move counseling websites out of “Health” and
  into “Support”
One Subsite,
Before and After
               Change between      Compared to
              Comparison Periods    Whole Site

Pageviews           76%              140%

Unique
                    81%              142%
Pageviews

Bounce Rate         -21%              27%
KJ Session


        Photo Source: http://www.flickr.com/photos/drewm/370231088/
Navigation Test
Navigation Test
         What You Do: Give participants a proposed site
                      structure/navigation and let users
                      drill down to find different things.
            Good For: Verifying an IA in a more realistic
                      way (not everything is visible);
                      finding problem areas
         When To Use: To verify a new information
                      architecture
 Participants Needed: 50
Navigation Test
   Tools Available: •Treejack


           Cost: $150–$700
Action
• Rearranged Admissions Site navigation to
 • Combine repeated material
 • Put “Costs and Tuition” higher in the site
    tree
Layout Test
Layout Test
       What You Do: Participants respond to a static image
                    of your site
          Good For: Behavior, Remote, Automated,
                    Quant.
       When To Use: Before building out a new design

 Participants Needed: About 50 per test
Layout Test
   Tools Available: •Paper
                    •PowerPoint
                    •Five-Second Usability Test
                    •Chalkmark
                    •Usabila

           Cost: $40–$600
Layout Test
Positive              Negative
•Get reactions to real •No interactivity
 designs without       •Users can be
 building out a        confused when
 whole site            doing this remotely
A/B Test
4           Find
    Participants
The Right Number of
Participants
• Different methods have different requirements
• Plan to recruit more than you need
• But don’t test more than you need
The Right Kind of Participants
• Steve Krug: “Recruit loosely and grade on a
  curve”
• Good advice, but when possible try to recruit
  participants that are more like your users
• For instance: faculty and students see your
  website very differently
Finding Participants
• People you know        • On your website (link
                           on homepage or pop-
• Students, faculty, and up)
  staff at your school
• Local high schools     • Recruitment tools
                           like Ethnio
  (talk to a guidance
  counselor)
Photo source: http://en.wikipedia.org/wiki/File:Ethnio_recruit_ad.png
Offer a prize
5    Run Study and
    Analyze Results
Keep track of results in KPI
spreadsheet and personas
6   Take Action
Share results and proposed
solutions with stakeholders
7   Measure and
         Repeat
Share results
Challenge:
Do some sort of user
research each month
Research Process
1. Frame a Good        5. Run Study and
   Question               Analyze Results
2. Know What You       6. Take Action
   Already Know
                       7. Measure and Repeat
3. Choose Study Type
4. Find Participants
More Information
 museyroom.com

 twitter.com/mjpowers

 www.slideshare.net/michaelpowers

Fast, Cheap, and Actionable: Creating an Affordable User Research Program

  • 1.
    Fast, Cheap, and Actionable Creating an Affordable User Research Program
  • 2.
  • 3.
    On the Web •museyroom.com • twitter.com/mjpowers • www.slideshare.net/michaelpowers • www.linkedin.com/in/mjpowers
  • 4.
    What kinds of user research have you done?
  • 5.
    It all startedwith a usability test
  • 10.
    Today • Getting Permissionfor Research • A Process for User Research • Inventory of Actionable User Research You Can Do Fast and Cheap
  • 11.
    User Research Study ↓ User Research Program
  • 12.
    0 Getting Permission
  • 13.
  • 14.
    “We don’t want “aresearch “study.”
  • 15.
    “A research study? “Look,just make a red box on the home page, and put this text in there. “I just need to make sure students don’t miss it.”
  • 16.
  • 17.
  • 18.
    What We ReallyWant • Applicants • Successful Students • Academic Research • Donations
  • 19.
    Create a Research Culture •Do a usability test and invite stakeholders to watch • Make research part of every project • Apply previous research to new projects • Show results early and often
  • 20.
    Research Process 1. Framea Good 5. Run Study and Question Analyze Results 2. Know What You 6. Take Action Already Know 7. Measure and Repeat 3. Choose Study Type 4. Find Participants
  • 21.
    1 Frame a Good Question
  • 22.
    Good questions arerelated to your goals
  • 23.
    “Students can’t find stuff on our website.”
  • 24.
    Focusing a Question How can we • Can students find decrease information about attrition? support services? • Can students find out what’s happening on campus?
  • 25.
  • 26.
    Focusing a Question How can we get 1. Can prospectives find our list of majors? more/more Our tuition qualified information? applicants? 2. Can prospectives register for a visit? 3. Can prospectives successfully apply on line?
  • 27.
    Goal-related questions lead to faster, cheaper, more actionable user research
  • 28.
    2 Know What You Already Know
  • 29.
    What Do YouAlready Know? • Best Practices • Server Logs • Published Studies • Analytics • Data about Your • Past Studies Institution and Students
  • 30.
    Get Organized Quantitative Data Qualitative Data KPI Spreadsheet User Personas
  • 31.
  • 32.
    KPIs measure progress toward your goals.
  • 35.
    KPI Spreadsheet • Focus on the KPIs you've • Include anything chosen numeric: survey results, 4Q survey, analytics, • Give specific reports to server logs, etc. stakeholders who request them • Create specific analyses for specific projects • Track over time without running multiple tools
  • 36.
  • 37.
  • 40.
    Include Scenarios Site Features Motivation Scenario Used Behaviors Find the Checks to see •Site Search •Looks for school if her major “Pre- with the is available •Undergrad Law” right pre- Admissions major, Law Website does not program find it. for me •Academics Link
  • 41.
    User Personas • Fiction—but a useful • Helps bring new team fiction members up to speed • Puts what you've learned into a format you can share with your team and clients • If it is wrong, team or clients will let you know
  • 42.
    Use these twotools to track your progress over time.
  • 43.
    3 Choose Study Type
  • 44.
    If you’ve neverdone one, do a usability test first.
  • 46.
  • 47.
    Some Types ofUser Research • Usability Test • Navigation Test • Surveys • Layout Test • Pop-up Survey • A/B Test • KJ Session • Card Sort
  • 50.
    Some Types ofUser Research • Usability Test • Card Sort • Surveys • Navigation Test • Pop-up Survey • Layout Test • KJ Session • A/B Test
  • 51.
    Usability Test Photo source: http://www.flickr.com/photos/l-i-n-k/3654390818/
  • 52.
  • 53.
  • 54.
  • 55.
    Pop-up Survey What You Do: Ask site visitors questions about their experience on a particular page or the whole website. Good For: Capturing user intent; settling arguments about what belongs where When To Use: When you have a question to answer, or all the time Participants Needed: Calculate your sample size: http://www.surveysystem.com/ sscalc.htm
  • 57.
    Pop-up Survey Tools Available: •4Q Survey •iPerceptions •CrowdScience •Roll your own Cost: •$0–$10,000+
  • 59.
    4Q Survey Questions 1.Based on today's visit, how would you rate your site experience overall? 2. Which of the following best describes the primary purpose of your visit? 3. Were you able to complete the purpose of your visit today? 4. Comment • If yes: What do you value most about the website? • If no: Please tell us why you were not able to fully complete the purpose of your visit today
  • 60.
    “I am alwaysable to “I can never easily find what I am find what I'm looking for. The website is really looking for, if I can easy to use.” find it at all.”
  • 61.
    Coding Comments • VisualDesign • Navigation Positive Positive • Navigation Negative • Visual Design Negative • Content Quality Positive • Usability Positive • Content Quality • Usability Negative Negative
  • 62.
    637,'809':-%&-'*(##%+,';+<' NF,)/+O)-./" (:L8")/2"M*:/58" J+8I)4"K:8+,/"" @8)34:" 1+/2"A:.=4:" 2(405-' 9./5:/5"HI)4+56" (:,)-*:" <+5:"<:)F>G" A.8+-*:" ;@A"B:38+5:C"/./D9E<" <=:>+?>"=),:08+5:" 7)8"9./5:/5";"(::2" ()*+,)-./01+/2)3+4+56" !" #!" $!" %!" &!" '!!" '#!" '$!" '%!" '&!" !"#$%&'()'*(##%+,-'.%+/(+0+1'230-'2(405'
  • 63.
    67'57"3#4'5&"8'9":&*;&"/#00*12" <#&2"%#&'()*=>+,*-.()*=>"?1@" SK1.40T.234# -?Q=#.47#R/?4:=# O0=N.9#P?=014## E=.89?# 6047#F?3B9?# 3#4'5&" >34:?4:#MN.90:;# A0:?#A?.KCL# -?1.2/?# @EF#G?8=0:?H#434I>JA# F3=02/?# AB?C0DC#B.1?5=0:?# <.=#>34:?4:#@#-??7# -./01.23456047.8090:;# !"# $!"# %!"# &!"# '!"# (!"# )!"# *!"# +!"# ,!"# $!!"# !"#$"%#&'()*+,*-.()*"/#00*12&"
  • 64.
    Action • Changed ouryearly goals to spend more time on these issues
  • 65.
    Card Sort Photo Source: http://www.flickr.com/photos/rosenfeldmedia/3343501403/
  • 66.
    Card Sort What You Do: Give participants cards with website topics on them, then ask them to put them into piles that make sense to them Good For: Understanding the mental models of your users When To Use: When creating or improving your information architecture/navigation Participants Needed: 15 face to face 50 online
  • 67.
    Card Sort Tools Available: •Index cards •OptimalSort (remote) •WebSort (remote) •xSort Cost: $40-$600
  • 69.
    Open Closed • Users stack cards • Give users header then cards • Give each pile a name • They assign cards to the header cards
  • 71.
    Where do weput counseling?
  • 74.
    Action • Complete restructuringof the Student Life section of our website • Move counseling websites out of “Health” and into “Support”
  • 75.
    One Subsite, Before andAfter Change between Compared to Comparison Periods Whole Site Pageviews 76% 140% Unique 81% 142% Pageviews Bounce Rate -21% 27%
  • 76.
    KJ Session Photo Source: http://www.flickr.com/photos/drewm/370231088/
  • 77.
  • 78.
    Navigation Test What You Do: Give participants a proposed site structure/navigation and let users drill down to find different things. Good For: Verifying an IA in a more realistic way (not everything is visible); finding problem areas When To Use: To verify a new information architecture Participants Needed: 50
  • 79.
    Navigation Test Tools Available: •Treejack Cost: $150–$700
  • 83.
    Action • Rearranged AdmissionsSite navigation to • Combine repeated material • Put “Costs and Tuition” higher in the site tree
  • 84.
  • 85.
    Layout Test What You Do: Participants respond to a static image of your site Good For: Behavior, Remote, Automated, Quant. When To Use: Before building out a new design Participants Needed: About 50 per test
  • 86.
    Layout Test Tools Available: •Paper •PowerPoint •Five-Second Usability Test •Chalkmark •Usabila Cost: $40–$600
  • 87.
    Layout Test Positive Negative •Get reactions to real •No interactivity designs without •Users can be building out a confused when whole site doing this remotely
  • 91.
  • 92.
    4 Find Participants
  • 93.
    The Right Numberof Participants • Different methods have different requirements • Plan to recruit more than you need • But don’t test more than you need
  • 94.
    The Right Kindof Participants • Steve Krug: “Recruit loosely and grade on a curve” • Good advice, but when possible try to recruit participants that are more like your users • For instance: faculty and students see your website very differently
  • 95.
    Finding Participants • Peopleyou know • On your website (link on homepage or pop- • Students, faculty, and up) staff at your school • Local high schools • Recruitment tools like Ethnio (talk to a guidance counselor)
  • 96.
  • 97.
  • 98.
    5 Run Study and Analyze Results
  • 99.
    Keep track ofresults in KPI spreadsheet and personas
  • 100.
    6 Take Action
  • 101.
    Share results andproposed solutions with stakeholders
  • 102.
    7 Measure and Repeat
  • 103.
  • 104.
    Challenge: Do some sortof user research each month
  • 105.
    Research Process 1. Framea Good 5. Run Study and Question Analyze Results 2. Know What You 6. Take Action Already Know 7. Measure and Repeat 3. Choose Study Type 4. Find Participants
  • 106.
    More Information museyroom.com twitter.com/mjpowers www.slideshare.net/michaelpowers