This document provides a 3-sentence summary of the key points from the passage:
The document is an introduction to a book titled "Fans & Ventilation: A Practical Guide" which provides practical information about fans, ventilation systems and related equipment. The author, Bill Cory, has over 50 years of experience in the ventilation and fan industries and intends for the book to be a useful reference for anyone working with fans. The book covers topics such as fan design, selection, installation and how these impact performance from a practical perspective.


![OLOI OCCHI
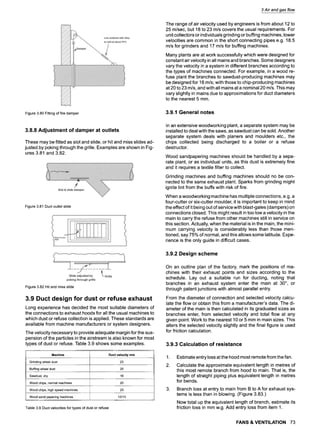
~ ~ ~ ~o~omOCCHi
V E N T I L A Z I O N E ""," ~ ~ , .,
• ,.
L I ] ~ i i i ~ . i 1 lz 11 i ~ : ~ 1 ~. - ' - ~/, • -
/-i . _ 1
Z~ZZ2~,
...... n,l --i~
BOLDROCCHI s.r.I. - Viale Trento e Trieste, 93 - 20046 Biassono- Milan - ITALY
http://www.boldrocchi.it- mailto" boldrocchi@boldrocchi.it- phone" +39 039 2202.1 - fax" +39 039 2754200](https://image.slidesharecdn.com/fans-220730192231-85fdb985/85/Fans-pdf-17-320.jpg)


![1Fan history, typesand characteristics
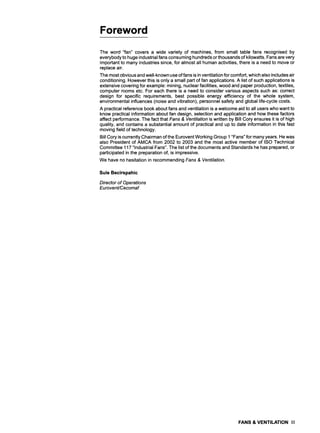
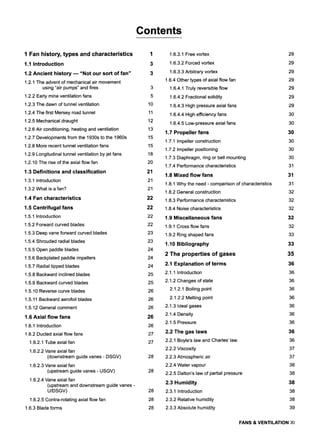
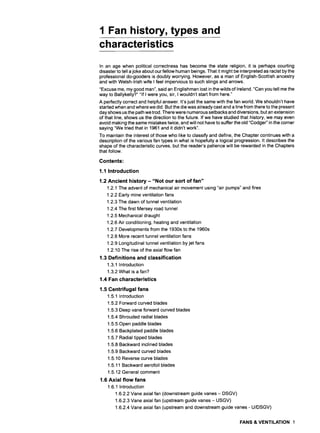
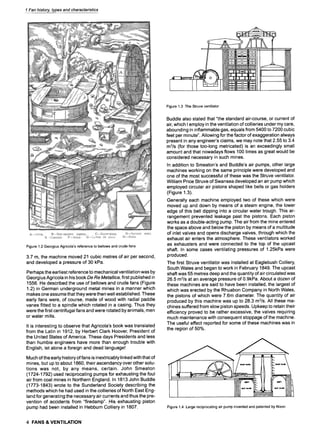
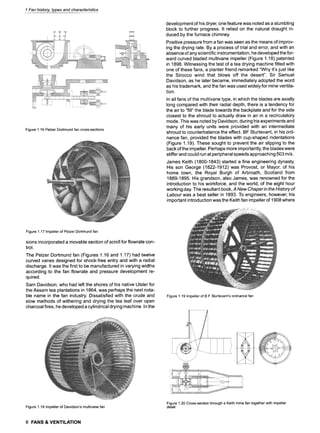
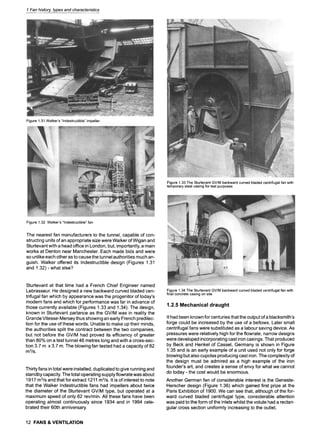
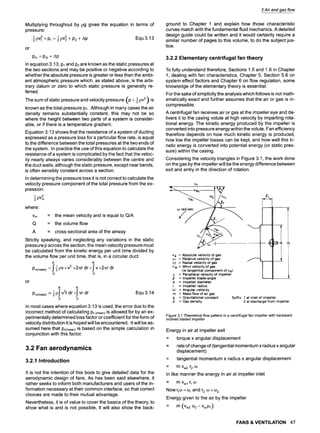
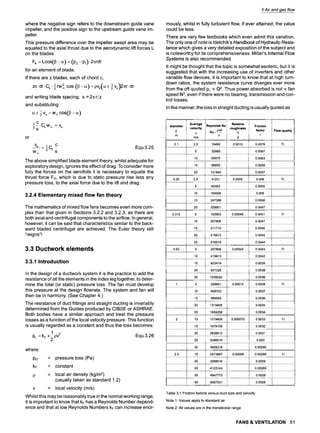
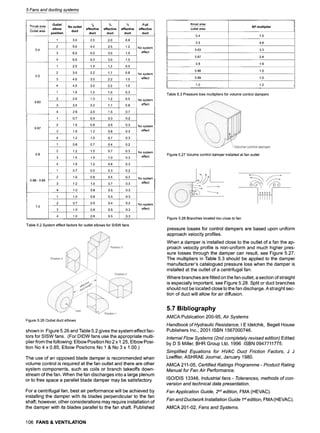
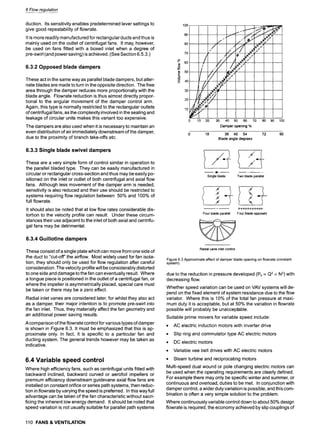
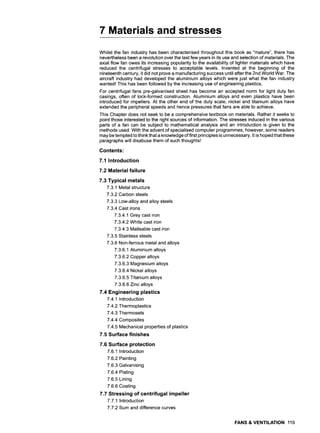
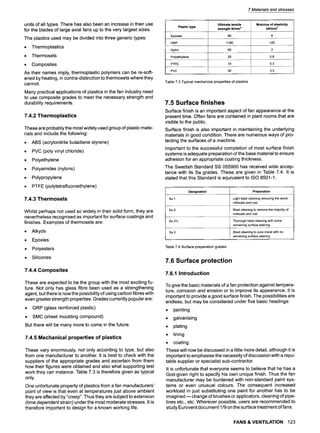
Figure1.38TheBlackmanpropellerfan prototype
was waxing lyrical in its description. The long extract that
follows, is interesting for its language, if nothing else:
Fresh air by electricity
Of the many beneficent purposes to which electricity is ap-
plied, none can be more conducive to the comfort and
health of the community than its use for driving ventilating
fans; and it is with pleasure that we observe the rapidly in-
creasing number of electrically driven fans that are being in-
stalled for the removal of all kinds of disagreeable fumes,
such as the appetising(? ) odours that arise from the kitchen,
and the unhealthy products of gas burners [incandescent
and otherwise]. Enquiries made at the London office of the
Blackman Ventilating Company, (the name had soon been
shortened) and an inspection of some of the installations of
their well-known fans, has convinced us that a wide field is
being opened up, and one that will form a valuable addition
to the central load.
Not only in the larger public buildings such as the Houses of
Parliament, the Stock Exchange, Hotels Cecil, Metronome,
Holborn Restaurant, etc. are electric Blackmans (note the
use of a name- just like Hoover) freely used for ventilating
the dining and smoking rooms, kitchens, and billiard rooms,
but many leading club-houses, hotels and private resi-
dences are thus fitted.
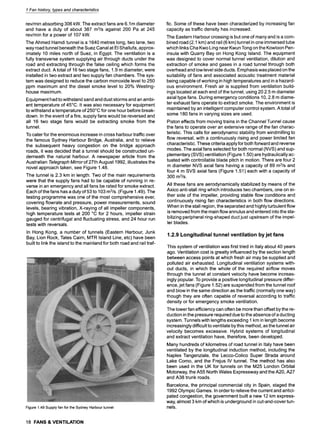
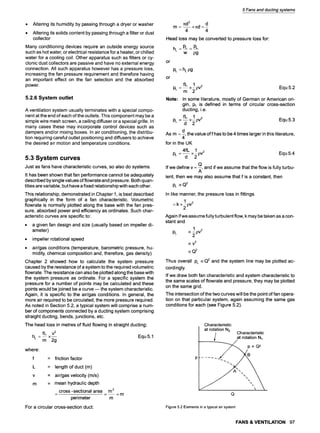
The wood cut (Figure 1.39) shows the electric Blackman
with peripheral motor, as fixed to the upperpart of a window.
A considerable number of these latter are at work, some of
them on windows of the most highly finished rooms in Lon-
don, and the effect is in every way satisfactory.
The stuffiness which was once a characteristic of the apart-
ments on board ship is in many cases a thing of the past-
electric fans are fixed in the dining saloons, drawing fresh
air through them and forcing it away when practicable
through the cooks' galleys, thus preventing the odours of
cooking from penetrating various parts of the vessel, and
preventing many an attack of mal de mer, the sleeping
apartments are also ventilated.
It is interesting to note that Messrs Siemens Brothers have
six Blackman fans, direct coupled to Siemens motors, on
board their cable ship The Faraday, and on its late trip up
the Amazon, although the voyage was a most trying one,
yet not a single case of yellow fever occurred, and the crew
were able to take their meals in the dining saloons, and
sleep in their berths, while on previous similar occasions
they were driven to eat and sleep on deck.
Speaking of ship ventilation reminds us that the Czar of
Russia has followed the example of Her Majesty the Queen
by having his magnificent yacht ventilated in this way.
Early development of heating, ventilation and air conditioning
was held back by the lack of authentic design data. Not only
Figure1.39TheelectricBlackmanwithperipheralmotor
was it impossible to calculate the heating or cooling load, but lit-
tle was known of equipment capacity, so that they could not be
matched.
To proceed beyond the empirical methods, closely guarded by
the few companies in the trade, it was necessary to develop the
scientific principles involved. Thus was born the American So-
ciety of Heating and Ventilating Engineers which had its first an-
nual meeting in 1895. It was followed by the Institution of Heat-
ing and Ventilating Engineers (UK)in 1897. In 1904 the
American Society of Refrigerating Engineers was founded
whilst the Swedish Heating, Ventilating and Sanitary Engineers
Association commenced operations in 1909. All these organi-
zations were active from the start in producing performance
standards and in publishing records of research and
applicational experience.
The expression "air conditioning" is believed to have been first
used by S. W. Cramer who presented a paper on humidity con-
trol of textile mills to the National Cotton Manufacturers Associ-
ation (USA) in 1907. The measurement and control of the mois-
ture content of textiles was known as "conditioning" in the trade,
so that the means of circulating humid air to achieve the desired
textile moisture content was a natural extension.
Air conditioning was recognised as a branch of engineering in
1911 when Dr Willis H. Carrier presented his two papers Ratio-
nal Psychometric Formulae and Air Conditioning Apparatus to
the American Society of Mechanical Engineers. From thereon
the use of fans for the air conditioning and ventilation of build-
ings was rapid. Until that time very large buildings had to have a
"light well" at their centre so that not only could all rooms have
access to natural light, but they could also be ventilated by
opening the windows.
Now architects were released from this consideration. It is
tempting to think that skyscrapers could not have reached their
present size without fans. By the mid 1920s there were many
centrifugal fan manufacturers producing standardized ranges
of forward and backward curved types. Selection by multi-rat-
ing tables was common but it was H F Hagen of the B F
Sturtevant Co. of Massachusetts who was the first to devise an
ingenious graphical method under US Patent No. 1358107.
14 FANS & VENTILATION](https://image.slidesharecdn.com/fans-220730192231-85fdb985/85/Fans-pdf-47-320.jpg)
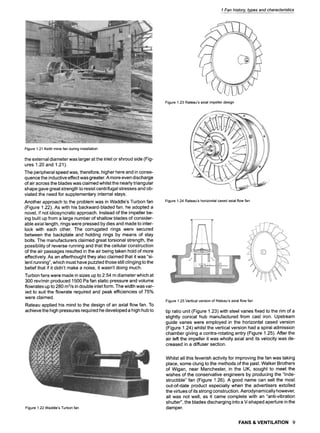
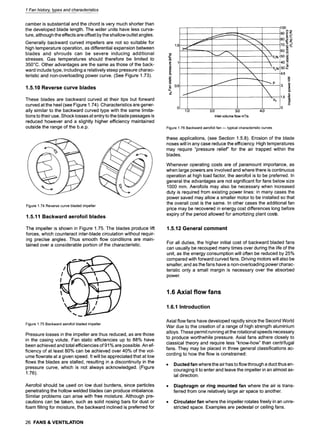
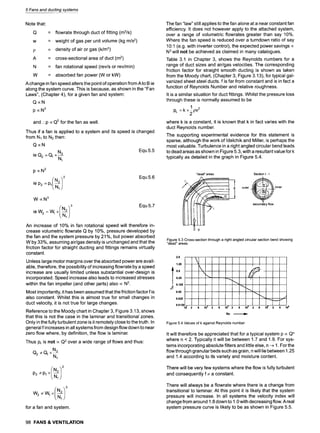
![Flowrate can be as high as 2.5 times that of the same size of
backward-bladed fan. This is now seen to be not necessarily an
advantage since casing losses, which are a function of velocity,
will therefore be about six times a great. Thus even with an im-
peller total efficiency approaching the theoretical optimum of
about 92%, the overall fan total efficiency would still be down to
about 75%.
Such fans are now only used where space is at a premium, as
they will be the most compact. Due to their smaller size they are
usually cheaper, although the differences are much reduced
with the greater possibility for automated manufacture of back-
ward bladed fans. Nevertheless thescope for improvement has
been appreciated and current designs achieve static efficien-
cies of 63% and total efficiencies of 71% at even lower speeds.
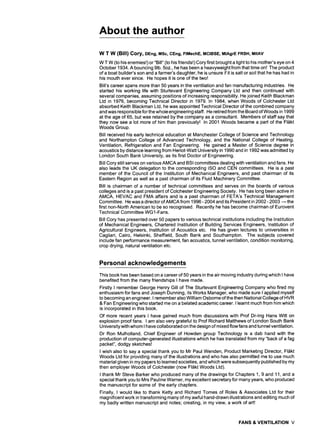
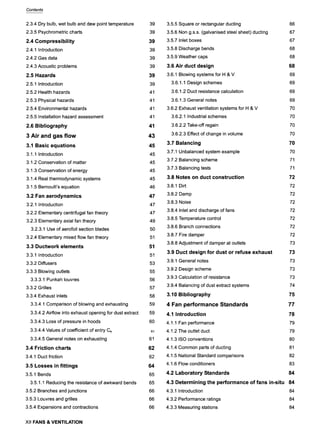
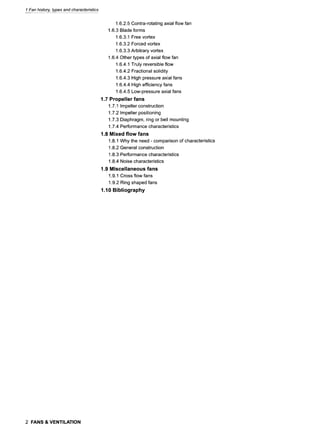
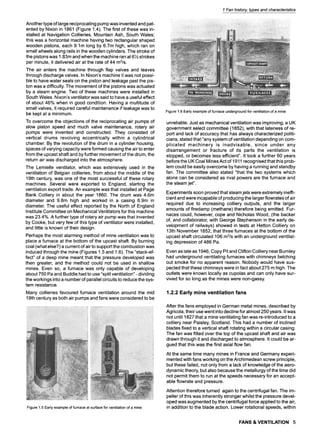
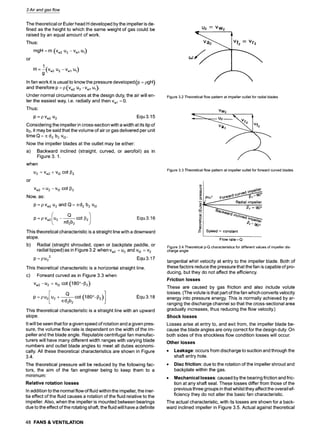
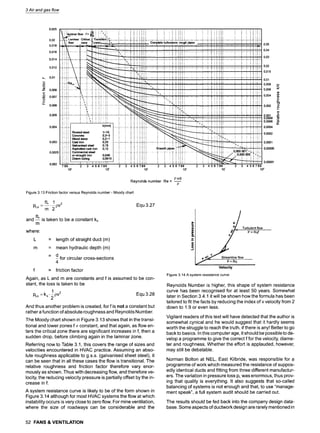
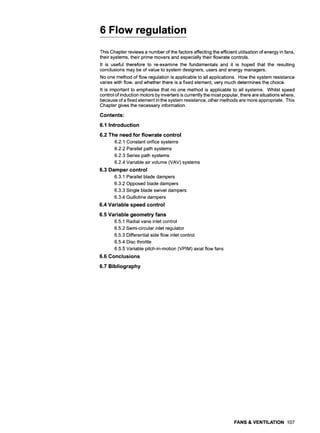
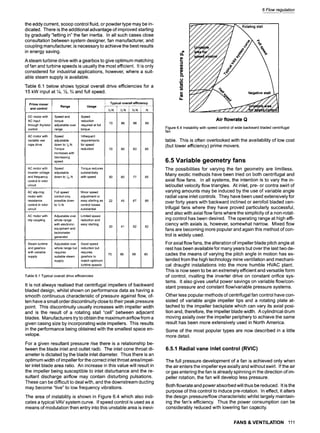
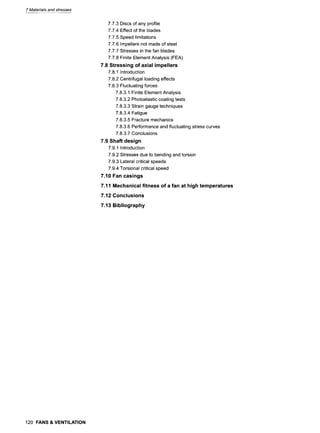
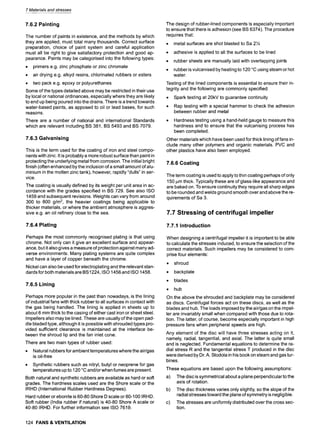
It will be noted that the performance curve has discontinuities
due to stall and/or recirculation (see Figure 1.61 ). A large mar-
gin over the absorbed power is necessary where the system re-
sistance cannot be accurately determined, or where it is subject
to variation, to take account of the rising power characteristic.
0.75 '
I o,~~'---------
._o i ~ i >
= 025-
0 .__._.~. i-""
0 1 2 3 4 5 6
Inlet volume flow m~/s
v"
80
7o~
60
.o
50 t-
40
-3 =~
0 E
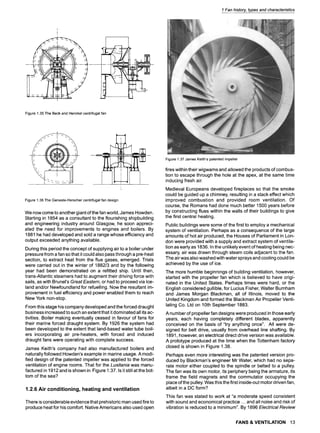
Figure1.61Forwardcurvedfan --typical characteristiccurves
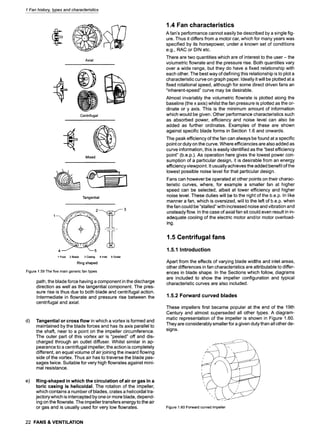
The impeller has a large number of shallow blades in widths
from 0.25 to 0.5D and runs at lower tip speed for the duty. Struc-
tural considerations have in the past limited the pressure devel-
opment to about 1 kPa, but the narrower widths are now suit-
able for pressures up to 14 kPa.
Apart from low-pressure ventilation requirements, these fans
are widely used for mechanical draught on shell-type boilers, oil
burners, furnace recirculation etc.
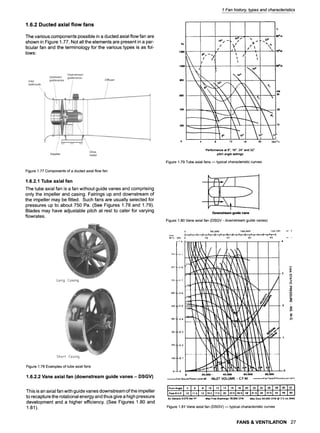
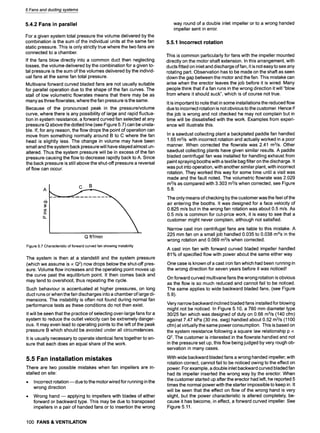
1.5.3 Deep vane forward curved blades
These blades are considerably stronger than the conventional
forward curved, being triangulated. They can thus run at higher
speeds developing high pressure. A more detailed impeller
drawing is shown in Figure 1.62, which perhaps explains why
there is some reduction in flowrate. Nevertheless a more stable
pressure/flowrate curve is produced (Figure 1.63) albeit with a
moderate peak efficiency.
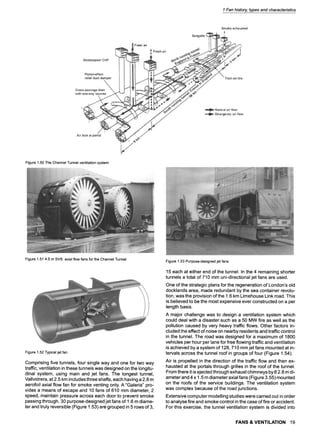
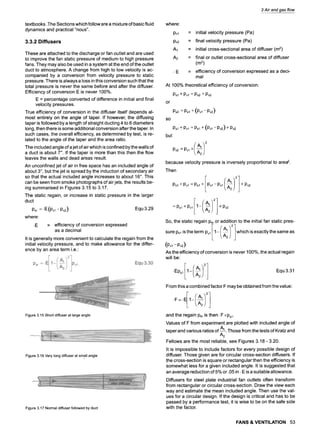
1.5.4 Shrouded radial blades
This useful design is represented diagrammatically in Figure
1.64 and can handle free flowing dust-laden air or gas. The im-
pellers have the ability to deal with higher burdens than the
backward inclined type. They are somewhat more efficient (up
to 65% static) than the open paddle and also able to run at
higher rotational speeds and thus develop higher pressures.
The blades are inherently strong, as centrifugal forces have no
1 Fan history, types and characteristics
>
Figure1.62Deepvaneforwardcurvedimpellers
OUTLET VELOCITY
ftimin 500 600 700 800 9001000 2000 3000 4000 5000
' "'" ,' ,' I~,','"<"*"'"','=%;;"*':"?i j~i~ 1h ~; '~i~' i:~' r,,;,i',,;,i" " ," ',' ',' >,' '," '? '," ",' .,,..~l.;,;,, .,,.;,
m~ot.):- _3 4, -~ 7 , , 2O
t05
100
!
_1 95
Iti
90
85
FAN PERFORMANCE ...... , ......... , ,, .... H:!!~!:!~::I!::L{I:'I~~. m
7.0
l,<mli.~;,, ~+~ ~,<,
<.... ~
............. = . . . . ,_,~~! ~!~!~!~! ,
_____..._,,, ,.,
~~::!H::~:~i~:~::H"`:§ (:.......
u f-,~:I}:I,~M,~,'; I ~", ~; ~i ~§ -------;--.- .........~../t~4:::F:V::PMiiil~'~ :100
i ,m I-,'-H-P,-~!Htt-i~~{~'#t.-t/./...t..~| ~'~i|I 80
i|ltll=lill i i t tl l l , l t l f l i l l ~ ~ i k ; ~ -~A.. , -~L~.~L%,L.~CI~C.LI~.I.~IllM.III
,J)?ii:
.....
,,
........ ..........~ ~ m ~ i _ x ~ ~ i ~ ~ 6o
!1t tl Ili1ll ~ " "~.~~".t/"<l
~~l, t.'.,l'iT'r,i
I--H|-~I!I!ll- ~ 7 4 . - . I - ~ 4 ~ 5o
IIi,II!!IIIII!IlII~IIIZIilIIIlIi~ I M I kl , ( l ~ t . Z k ~ " . ~ ~ ~'40 =
IIl]}l:llIlI t; I:i: ~ ~
II!~;'IIIIIII Il II IIJiJ~I~R...~._IL.j_._.LI.._..~./...[I...~..I....L~...I~~
~ H-ii!ttt{tlt:tl 3o
~oi1ii,IIl1Itt
0.6 Pf-{:t-{t7 --:-:-Z~:~~-t/]V:7/~+; :::"f~--V-V{---VF+,o F+++~:-I::~:-/:~:~:,;~
ft~;min4 " 5 6 7 8 9 10 " 20 30 40 10
m~"h 7 8 9 10 20 30 40 50 60
INLET VOLUME QI (xl000)
Figure1.63Deepvaneforwardcurvedfan -- typicalcharacteristiccurves
bending effect. They are also simple and in sizes up to 900 mm
can be easily flanged for rivetting and spot welding.
Blades are largely self-cleaning and are easily cleaned. Such
fans are suitable for moderate free-flowing granular dust bur-
dens.
Figure 1.64 Shrouded radial impellers
FANS & VENTILATION 23](https://image.slidesharecdn.com/fans-220730192231-85fdb985/85/Fans-pdf-56-320.jpg)
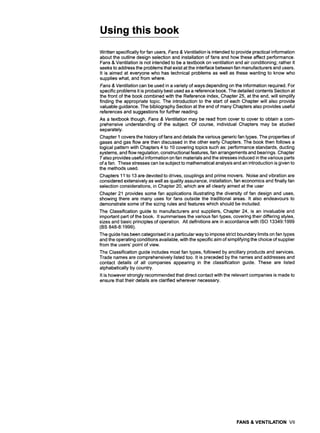
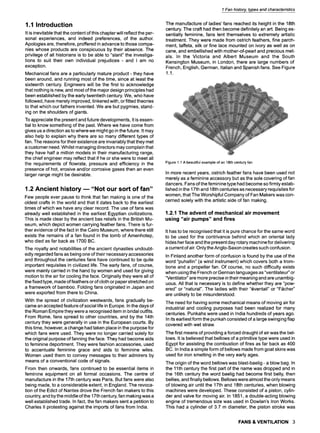
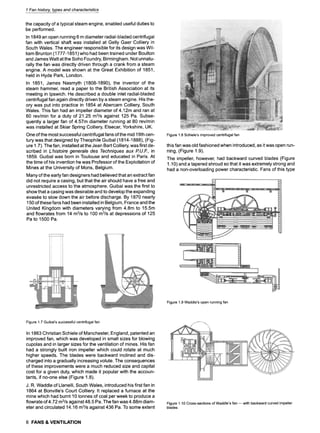
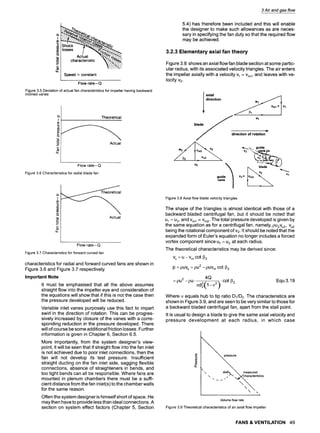
![1 Fan history, types and characteristics
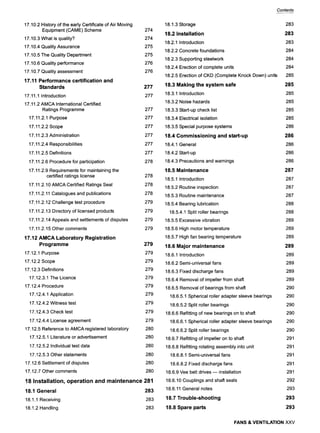
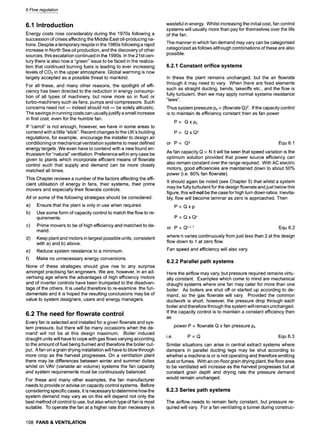
Figure 1.94 Examples of bellmouth or ring mounting
This is because the vena contracta is expanded and less veloc-
ity pressure is required for a given volume flow. Moderate pres-
sure performance is also helped, but high pressure develop-
ment is impaired. If the rounding is enlarged into a true
bellmouth and a short tunnel formed around the impeller, the
fan becomes in effect an axial fan, and is better served by an
aerofoil section impeller.
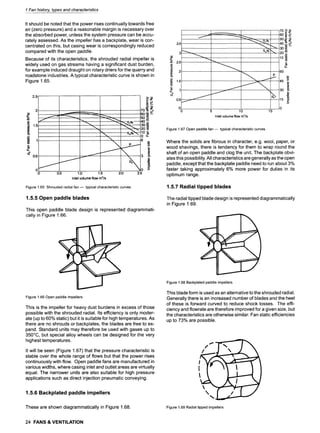
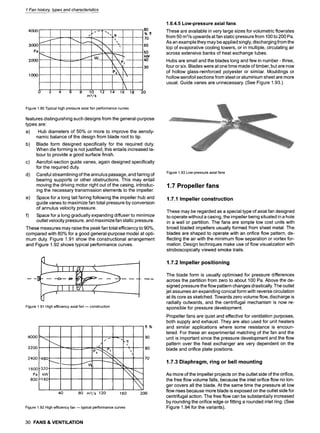
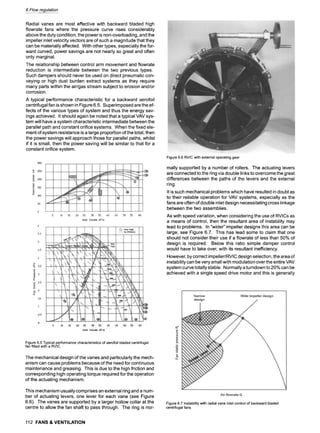
1.7.4 Performance characteristics
The impellers of propeller fans are almost invariably mounted
on the shaft of the driving motor. The air flow cools the motor,
which can be totally enclosed to keep out dust. The impeller
power rises rather sharply if the volume flow is drastically re-
stricted, and the motor could be over-heated, particularly if on
the downstream side, where centrifugal flow starves it of cool-
~ ~." !
150 ~"~'~'~ ~ .... 500
,,,
50
L
0,4 0,8 1,2
Psk ......
', ....
1,6 2.0 2.4
E
400
rh3ts
Effect on Ps of omitting inlet ring shown thus: - - -
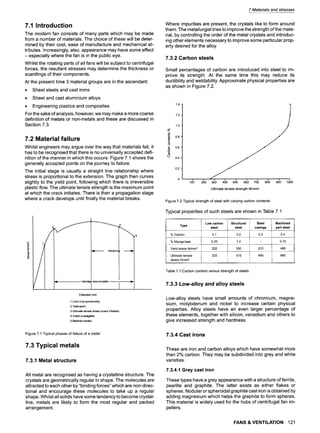
Figure 1.95 Typical performance curves of ring mounted propeller fan
Free flow | Restricted flow
normal projection t " increasedprojection
~8oI ,, ..... ] "~ .050
24o ~ " ~._ . t
,, %17
200Pai . ~ ~,~ ,~ ~'. 40
"~-,~ ""~' '30
120 ~ ~ ~.._.__ ,~, ~k~ 3
W, '~ kW
80 ~" 2
,
401 , I
, EX_
0 1 2 3 4 5 6 7 I 3 m3/s
Effects on Ps of increasing downstream projection of impeller shown thus: - -
Figure 1.96 Typical performance curves of plate mounted propeller fan
ing air. However, propeller fans are not often used in systems
where such excessive resistance could arise. Typical perfor-
mance curves are shown in Figures 1.95 and 1.96.
1.8 Mixed flow fans
1.8.1 Why the need - comparison of characteristics
The suitability of a particular type of fan for a duty depends more
on the relationship between the performance parameters than
on their absolute values. This is especially true where there are
limits to the size of the unit, and/or where the maximum speed is
specified. In Section 1.3.2 the concepts of specific speed and
diameter are discussed, and it is noted that there is an area for
mixed flow fans between the two traditional types. This type has
not been commercially available to any extent until recently
For HVAC applications, there is a region for which neither cen-
trifugal nor axial fan is ideal but for which a mixed flow fan can
be designed. For the centrifugal fan to be of an acceptable size
it has to be selected at efficiencies away from its peak; the axial
fan has to have a high hub to tip ratio and/or has to be
multi-staged to achieve the pressure.
Mixed flow fans should not be confused with in-line radials.
Their casing diameter is generally smaller and they run at a
speed intermediate between axials and centrifugals.
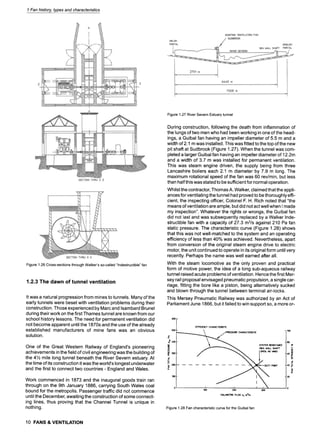
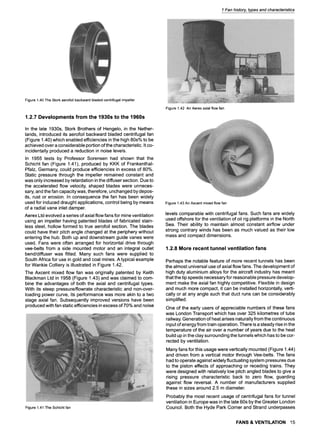
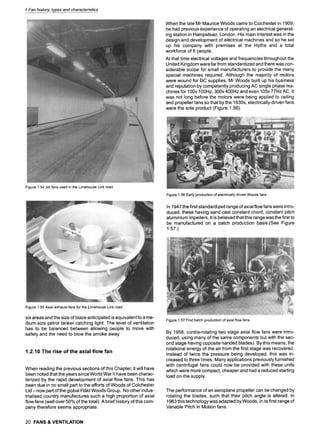
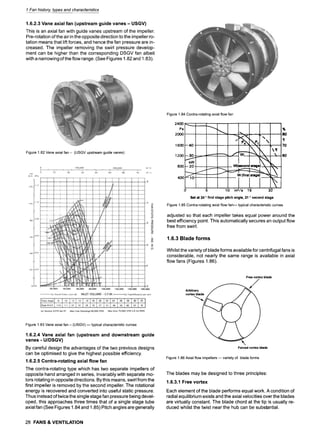
1.8.2 General construction
The main elements of a true mixed flow fan are seen by refer-
ence to Figures 1.97 and 1.98, similar to a vee belt driven vane
axial or in-line radial. The major difference is in the impeller,
which is generally of fabricated construction. Both the front
shroud and backplate are at an angle, so that the air follows a
Figure 1.97 Typical belt driven mixed flow fan
Figure 1.98 Cross-section through belt driven mixed flow fan
FANS & VENTILATION 31](https://image.slidesharecdn.com/fans-220730192231-85fdb985/85/Fans-pdf-64-320.jpg)
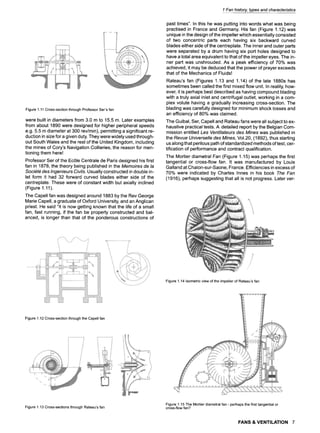
![1 Fan history, types and characteristics
path somewhere between axial and centrifugal flow. It will be
noted that the casing isjust slightly larger than the impeller out-
side diameter.
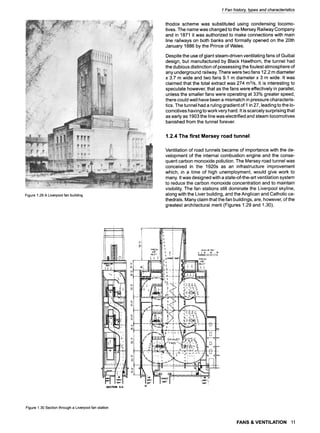
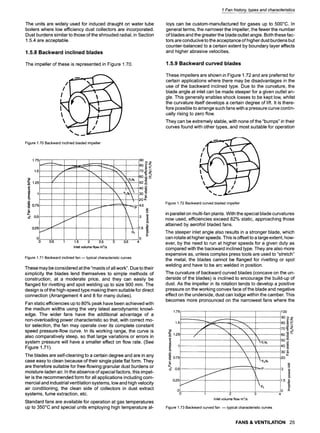
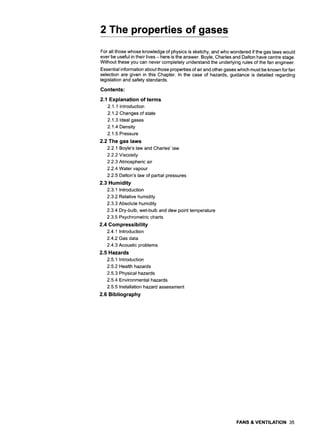
1.8.3 Performance characteristics
Performance is intermediate between an axial and centrifugal
of the same impeller diameter. A non-stalling characteristic is
achieved and the power/flowrate curve is non-overloading.
Pressures up to 2 kPa are possible with standard construction.
A typical performance curve is shown in Figure 1.99.
, m---~e
. . . . :: ::i §
~!!i~....~,-.-~
.........
:. ~ ~ .......
~ ..-,~: +
~~ 1 ......
~-i......
~i
~ ~ ....
-~"
i i "
................
~ectOr~vePedetmance q,/ - VOI...UME FLON m3/.~
................. ~...............
L__.~ .................
~..i.......~ ......~ _ ~ , ~ ,~_~S,._~,.~..#.....~...~..~.~.~
F;~N DYNP.MIC PRESSURE
.... ~ ~__.~ ............ ~.... ,, .... ~ . :.,
...................... : ........................ , .......... ~:. .......... , ........... ~ ........... , .................. '.:~. ........... ,. ................
OUTLET VELOC1TY
RIR DENSITY 1.2 kg/m ~ MOMENT OF INE:R~I~ G. I kgm~
...... ..........
~:
.
.
.
.
.
.
.
.
.
.
.
.
.
.
.
.
.
#.:..~,=~:-~~.-/.; .
.
.
.
.
.
.
.
.
.
.
.
.
.
~......~ ...........
........
.,:, .............. :..
Figure 1.99 Typical performance curves m Mixed flow fans
1.8.4 Noise characteristics
The linear sound power level for this fan is intermediate be-
tween an axial and centrifugal if all are selected for best effi-
ciency and the same duty. The centrifugal generally has a fall-
ing noise spectrum with frequency, whilst the axial peaks in the
octave band containing the blade passing frequency. A mixed
flow fan has a noise spectra somewhat similar to the centrifugal
except that there is a marked reduction in the 63 and 125 Hz
bands making silencing more easy.
1.9 Miscellaneous fans
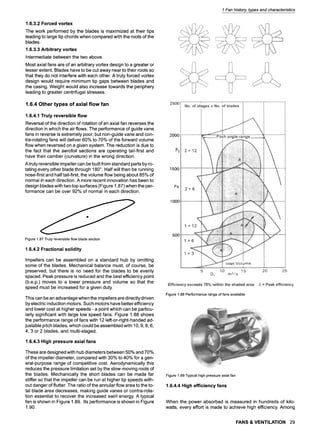
1.9.1 Cross flow fans
The fluid path through the impeller is in a direction essentially at
right angles to its axis both entering and leaving the impeller at
its periphery. The impeller otherwise resembles a multivane for-
ward curved centrifugal but has no side entries. Flow is induced
by a vortex formed within the impeller.
Apart from structural considerations, there are no limitations on
width so that it may be used to give a wide stream from a small
diameter e.g., as in a unit heater. See Figures 1.100 and 1.101.
32 FANS & VENTILATION
f
Figure 1.100 Cross-flow fan
LG: antictockwise rotation
RD:clockwiserotation
Figure 1.101 Rotation of cross flow fans
Bladed Fan Rotor
S~kmc~
Vane
Self P
Gram
Air Out
Inlet Port
/ " ", " AIr out
./ 9
Air In
Inlet
Pipe
Cover
1.5
r162
!
W
Eo.s
a.
n
0
TSO0
T1200
f . I ............... I . J ]
10 20 30 40 50
Flow - m31h
Figure 1.102 Toroidal fan, airflow pattern and performance curve](https://image.slidesharecdn.com/fans-220730192231-85fdb985/85/Fans-pdf-65-320.jpg)
![1 Fan history, typesand characteristics
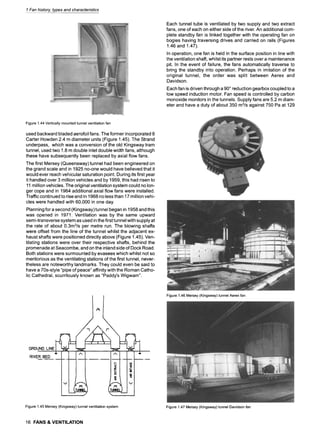
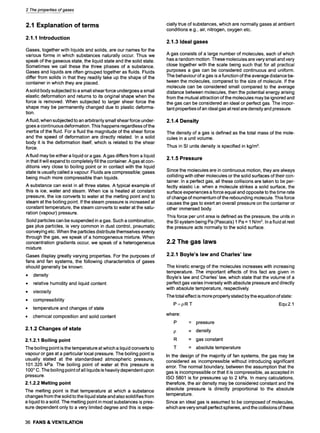
1.9.2 Ring shaped fans
The circulation of air in the toric casing is helicoidal. Rotation of
the impeller, which has a number of blades, creates this
helicoidal trajectory, which is intercepted by one or more blades
depending on the flowrate.
The impeller transfers its energy to the air or gas in the manner
shown in Figure 1.102 and is best used for very low flows at high
pressure albeit at only a moderate efficiency.
1.10 Bibliography
The Fan Museum, 12 Crooms Hill, Greenwich, London SE10
8ER, UK, Tel: 020 8305 1441
De re Meta//ica, Georgius Agricola, Courier Dover Publications,
Paperback version, 1912, ISBN 0486600068
The Fan: Including the Theory and Practice of Centrifugal and
Axial Fans, Charles H. Innes, Manchester Technical Publish-
ing Co., 1904. vi, 252, [4]pp.
Rational Psychrometric Formulae, Paper by Dr Willis Carrier,
(ASME, 1911).
Apparatus For Treating Air, U.S. Patent No. 808897 issued
January 1906.
ISO/DIS 13348 Industrial fans m Tolerances, methods of con-
version and technical data presentation.
Eurovent 1/1 - 1984 Fan Terminology.
AMCA Standard 210/ASHRAE Standard 51, Laboratory Meth-
ods of Testing Fans for Rating.
ISO/TC 117 Industrial fans: Standardization in the field of fans
used for industrial purposes including the ventilation of build-
ings and mines.
FANS & VENTILATION 33](https://image.slidesharecdn.com/fans-220730192231-85fdb985/85/Fans-pdf-66-320.jpg)


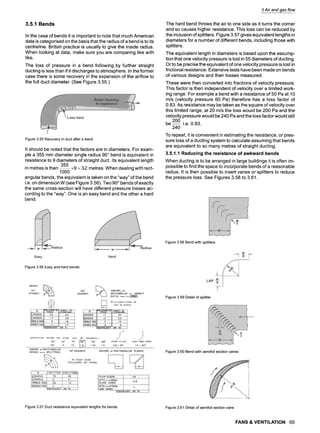
![3.1 Basic equations
3.1.1 Introduction
Fan engineering has, over the years, developed a certain mys-
tique in the development of its "Laws" and basic equations. It
should however be recognised that, as with other specialities,
Newton's Laws of Motion are followed and the subject, in reality,
is merely a branch of Applied Mechanics. Delving into the sub-
ject a little more deeply, we may deduce that the great majority
of design work and of the operation of fans is encompassed by
the Mechanics of Fluids. It is therefore imperative that we un-
derstand some of the basic concepts of air and gas flow and
their applications as outlined in the following Sections.
3.1.2 Conservation of matter
Conservation of matter or the continuity equation is merely a
mathematical statement that, during a flow process, matter is
neither created nor destroyed.
Thus the mass flow in a fluid element (assuming no leakage to
outside) remains constant i.e.,
PlAtVl = P2A2v2 Equ 3.1
where:
pl
1:)2
A1
A2
Vl
v2
= air or gas density at position 1 (kg/m3)
= air or gas density at position 2 (kg/m3)
= cross-sectional area at position 1 (m2)
= cross-sectional area at position 2 (m2)
= air or gas velocity at position 1 (m/s)
= air or gas velocity at position 2 (m/s)
In the particular case of flows where the pressures are less than
about 2.0 kPa, air and many other gases may be treated as if
they were incompressible. Thus pl = p2 i.e., the density of the
air/gas remains constant and
Alv1= A2v2 Equ 3.2
3.1.3 Conservation of energy
The principle of the conservation of energy is encapsulated
within the First Law of Thermodynamics, which states that, in a
non-nuclear process, energy cannot be created or destroyed.
We may also say that when a system undergoes a thermody-
namic process, the net heat supplied is equal to the net work
done. This law is based on the work of Joule, who found by ex-
periment a "mechanical equivalent of heat".
3.1.4 Real thermodynamic systems
In a real system there are inevitably losses such that the con-
version process is less than 100% efficient.
The Second Law of Thermodynamics therefore states that:
It is impossible for a system to produce net work in a ther-
modynamic cycle if it only exchanges heat with sources
/sinks at a single fixed temperature.
This Law is based on a principle proposed by Clausius. He
stated that heat flows unaided from hot to cold but cannot flow,
unassisted, from cold to hot. Lord Kelvin used the proposal to
show that work may be completely transformed into heat. How-
ever, only a proportion of heat could be transformed into work.
If a gas is heated at constant volume there will be no work done
but the energy level of the gas will be increased thus:
3 Air and gas flow
Q : mcv(T2 -!1)
-u,)
where
Q
Equ 3.2
= heat transferred (kJ)
m = mass of gas (kJ)
Cv = specific heat capacity at
constant volume (kJ/kg.k)
T2 = final absolute temperature (k)
T~ = initial absolute temperature (k)
U2 = final specific internal energy (kj/kg)
U~ = initial specific internal energy (kJ/kg)
Note: There is no degree symbol associated with the abso-
lute temperature. Absolute temperatures in Kelvin can
be converted to degrees Celsius by subtracting 273.15.
Specific heat capacity is normally abbreviated to specific heat.
It is easy to see that specific internal energy, U1 is equal to the
product Cvand the absolute temperature, internal energy is an
intrinsic property of a gas and is dependent upon the tempera-
ture and pressure. In this case it would have been possible to
use degrees Celsius to obtain the same result.
However it is worthwhile working in absolute temperatures con-
sistently to avoid problems with rations. If a gas is restrained
and applied at constant pressure there will be work done, thus:
Q = mcv(T2 - T1) + W Equ 3.3
= mcp(T2 -'1"1)
=m(h 2 -h,)
so that:
W :m[(h 2 -U2)-(h , -U,)]
also
w
and
h=U+pv
where:
W
Cp
= work done (kJ)
= specific heat capacity at constant
pressure (kJ/(kg.K))
h2 = specific enthalpy (kJ/kg)
hi = specific enthalpy (kJ/kg)
p = absolute gas pressure (kPa)
V2 = final gas volume (m3)
V1 = initial gas volume (m3)
v = gas specific volume (m3/kg)
Absolute pressures are gauge pressures plus 101.325 kPa.
The International Standard Atmosphere, at sea level, is
101.325 kPa. The actual local sea level atmospheric pressure
is not constant and will vary with the weather by +/- 4%. some
locations which experience severe weather conditions may ex-
perience larger variations. The atmospheric pressure will re-
duce at altitudes above sea level.
Enthalpy is an intrinsic property of a gas and is dependent
upon the temperature, pressure and volume. The total
enthalpy in a system, H, is the product of gas mass, m, and the
specific enthalpy, h. Equation 3.3 can be rewritten as shown in
FANS & VENTILATION 45](https://image.slidesharecdn.com/fans-220730192231-85fdb985/85/Fans-pdf-78-320.jpg)
![3 Air and gas flow
equation 3.4 when it is known as the Non-flow energy equation.
U is the product of m and u.
Note: The specific heat capacities, Cv and cp~ are variables
not constants. The values for dry air, not real air, at at-
mospheric pressure and 275 K are 0.7167 and 1.0028;
at 1000 K the values increase to 0.854 and 1.411.
Q = (U 2 -U1) + W Equ 3.4
For heat to be transferred into or out of a system a temperature
differential must exist. The general equation for heat transfer
by conduction is thus:
Q = ka(Th - T~ Equ 3.5
L
where:
q
k
a
Th
Tc
L
= energy transfer (kW)
= thermal conductivity (kWm/(m2K))
= area (m2)
= hot absolute temperature (K)
= cold absolute temperature (K)
= length of conductive path (m)
The thermal conductivity, k, will not be a simple value based on
the boundary material. The conductivity value used must take
account of the inside and outside boundary layer films and, if
necessary, an allowance made for the reduction in conductivity
due to surfaces being coated with deposits or modified by
corrosion.
It will be appreciated that the rate of heat transfer due to con-
duction is proportional to the temperature differential. If the
heat source cools as transfer proceeds it will take an infinite
length of time to transfer all the heat available providing there
are no losses. Energy losses usually occur via convection and
radiation and by heating the system as well as the gas. Perfect
systems are massless; only the mass of the working fluid is
considered.
Entropy is another intrinsic property of gases. Entropy is very
unusual when compared to other gas properties; entropy only
changes when heat transfer occurs. Entropy is not dependent
upon temperature, pressure or volume. A change in entropy is
defined as:
dQ
ds =~ Equ 3.6
T
where
ds = change in entropy (kJ)
dQ = heat transfer (kJ)
T = absolute temperature (K)
The units for specific entropy, s, are kJ/(kg.K). Values of intrin-
sic properties: u~ h~ s; are quoted in gas tables and appear on
the axes of gas charts. It is very important to verify the base
temperature of printed data before starting calculations. Some
gases use 0 ~ and some, like refrigerants, use- 40~
3.1.5 Bernoulli's equation
Consider an elemental tube in which flow is entirely parallel to
the boundaries. For simplicity assume it to have constant
cross-section area of 5a (although it can be shown it is not es-
sential to do so).
The forces on the element may be equated to the rate of
change of momentum. In the direction of flow, the forces are:
due to change in pressure:
pSA- (p + 5p)SA: -SpSA
due to change in height above some datum:
-pg 8s sin 0 8A =-wSHSA
Rate of change of momentum in direction of flow
= p~Av(v + 8v) -p;SAv2 = p~Av,Sv
thus
-SpSA = pSHSA = pSAvSv
and rearranging
5p
vSv + -- + gSH =0
P
which in the limit becomes
dp
vdv + -- + gdH = 0
P
On integration, this gives
v2 + fdp
-- + gH = constant Equ 3.7
2 p
H is measured from any arbitrary datum, and any change of da-
tum results in a change in H and an equal change in the con-
stant of integration. If the air is considered as incompressible,
which is acceptable for fan pressure below about 2.0 kPa, then
equation 3.7 reduces to
v2 p
+ -- + H = constant, known as Total Head Equ 3.8
2g pg
Although strictly only applicable to flow along a stream tube of
an ideal frictionless fluid, equation 3.8 is often used to relate
conditions between two sections in a practical system of flow
through a duct. If the mean total head is measured at the two
sections, it will be found that the value at the downstream sec-
tion is less than that at the upstream section. This is due to re-
sistance to flow between the sections and the difference in
head is known as loss of total head. When making measure-
ment however, it is customary to use gauge pressure, i.e. pres-
sures greater or less than atmospheric pressure.
Considering two sections, subscript 1 referring to the upstream
section and subscript 2 referring to the downstream section,
then
V2 -I- Pat1-t-Pl + H1 = V22+ Pat2-I-P2 + H2 + AH Equ 3.9
2g pg 2g pg
where AH is the loss of total head between the two sections.
This may be rewritten
v2 + Pj_~= v22+P__&2
+ AH+(H2 _H1 Pat1-Pat2] Equ3.10
2g pg 2g pg - -pg
NOW, if Pat represents the atmospheric pressure at a height H
above some datum, and Pat+ SPatat a height H + 5H above the
same datum, and a column of air of cross-section A is consid-
ered,
PstA- (Pat 4- (~Pat)A = pgA(H + 5H) - pgAH
from which
-Spa t = pgSH Equ 3.11
If pg remains constant, then equation 3.8 may be rewritten
Pat1-I-P2 + H2 + H1
Pg
and inserting this in equation 3.10 gives
v___l
2 + P_j_~
= v2 + P
_
_
z
_
2
+ AH Equ 3.12
-t.g pg 2g pg
46 FANS & VENTILATION](https://image.slidesharecdn.com/fans-220730192231-85fdb985/85/Fans-pdf-79-320.jpg)
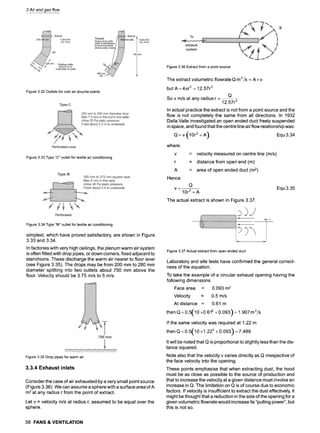
![3 Air and gas flow
But --
Q is the velocity in the duct after the vena contracta and
A
1.29~v at normal temperature and barometric
equals pres-
sure where Pv is the velocity pressure in the duct.
So,
1 1.29 ~v
1.29 • -
Ce=
or
Ce- P~s
With
PV
Ps
Equ 3.36
= mean velocity pressure in duct after vena
contracta (Pa)
= static side hole depression taken in position
specified to be clear of the vena contracta
Many tests have indicated that on a given extract opening, the
value of Ce increases with velocity, indicating some Reynolds
Number dependence.
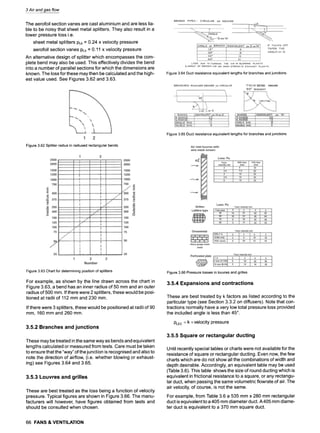
3.3.4.3 Loss of pressure in hoods
The loss of pressure in an exhaust inlet is very much dependent
upon its shape. It is mainly due to the contraction of the
airstream which results in an increase in velocity at that point. In
a bell mouthed entrance (Figure 3.44) there is virtually no con-
traction of the entering airstream. To create a flow of say 20 m/s
at A or a velocity pressure of 250 Pa requires a static depres-
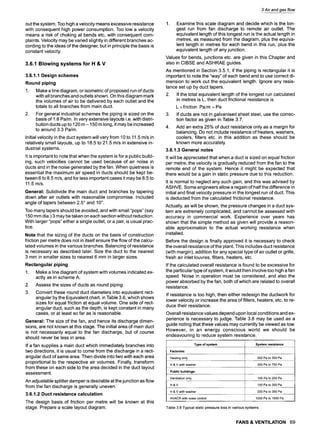
sion of 250 Pa in the duct.
Figure 3.44 Bell mouthed inlet
Thus if there are no losses"
PS= PV
When there is a contraction of the entering airstream then:
Ps - Pv+ PL
where:
Pv
PL
or
= velocity pressure in the duct (Pa)
= extra static depression for the increased
velocity (Pa)
PL = Ps --Pv
The value of PLrelative to the velocity pressure in the duct is
Ps-Pv
Pv
But Ce as already shown = P~s
or -,~v-v= Ce~s
or Pv = Ce2ps
Substituting for Pv in the formula for relative PL:
Figure 3.45 Hood losses
PL --
ps-Ce2ps Ps(1-Ce2) 1--Ce2
- - " - _ _
Ce2ps Ce2ps Ce2
Or as a percentage of the velocity pressure in the duct.
100/1-0e2 ] Equ 3.37
PL =
~ )
Ce2
Figure 3.45 shows this in graphical form for values of Ce from
0.6 to 1.0.
In practice, the estimation of this loss is required in the design of
dust extracting plant. It is generally possible to estimate the
value of Ce from some similar known example. In especial
cases a model may be made and checked by a laboratory test.
Typical values of Ce are given in the paragraphs which follow. It
may be appreciated that absolute accuracy in the figure is not
required and is in fact impossible to achieve at the estimation
stage. Results of tests have been given to three decimal places,
but a rounded approximate figure may be all that is necessary.
Note: PLrepresents the mean facing tube reading as usually
taken on the inlet side ducting of the fan. It is the equiv-
alent of the resistance depression up to the point of
60 FANS & VENTILATION](https://image.slidesharecdn.com/fans-220730192231-85fdb985/85/Fans-pdf-93-320.jpg)
![3 Air and gas flow
E
v
"0
t-
O
0
L_
e-
e-
.~..
0.O1
1oo i --.-,. ~,,
'i, ---,?-
50 --~
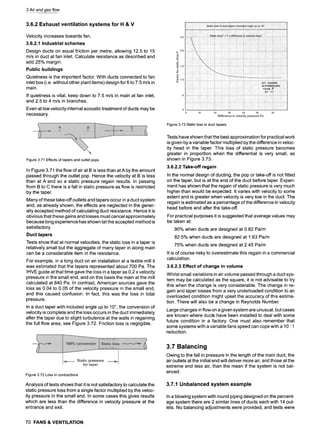
Pressure loss per 100 ft run in - in.w.g, at 62~
0,1 1.0
I ............
10
I
I00 000
20
I0
I0 00 0
2-.-'-"
/ i ; ~ f ~ ~ I I~I ,!~i f 1!~! l~ ~< .->' /.L ! k_~ i !;:k>_L~t!! : :L )-.f .....!:.!- N ....
t h ~ " l 7"i:~'777i :'~ i kf I i ~ i l ~ i i ~'kj~,/~-.'i !i i ;!~!...i~!Ii!W ! !~lllt~
.1' 0.:
2'
6
,0.:5-
.Z. {..~ .. !f ! "l; ' ! ]]~ ,; !:~ { ~1! {.,,,~E"ti
i 'f ;; ;;;7] ~ ~>]:] ;J; t '-D.]~ i] 77'_! 7~ ~I-7~ 7i i :7
t ,~ ; { ~ :: :'t:i { -; [ r,,.i: l ifi ;',,.t t ;i. _, 1~171 ~ i;. t . "~' ! !; !:'i ; 4;~.!i! I ~:::l :.~(!....,;!
~'i: i: X ; ; ~:~ {~ ~:.';.'.:i :;;~;;;7.k~ i i I:~ii ..... . l~ X;7 ! A~!__.ZI:~ i' i;:! '~{7i~ L ! 'I ,~;'
I 000
......~
....... ,~ ......,..,i ~ ~-'~I ~ : :x~T, ~k<i , ,~Li i~'~ii~.~, ....... , , i. ~ ~ ;'~i~ ; <.'. ~:!:~:~i~-'~T~, .'. ~ :!
....i 7 -"FN i i:i r i i i !i iiilX ! I.I'A
:i- i. ;~i-I i ;. i:~ i ii VZ' l:i ii-ltl ~ -~i;.~! i: 7 i "t.,<'~i ,: ,~, r r!irT"~i ~i- i :~ ~ i i i ~ =i'.:i; "-,.i7.1i; i ! ;~t l;;7:_~.!r;~} {;l:i; 7[_.!;;1__X]:;7;;!__~:7:7
....
9
-=-
r
"--! i + ! ~ l~=
O"O~
.... ~ i~~i .,..
- ~-TFi~,..;P, "' ~ 7 ~ ~ <
l ....ill i f ~ .....
i i f i i I
0-I" 1,0 10 100
Pressure loss per metre length in N/m 2 for air density 1.2 kg/m 3 (1 mb = 100 N/m 2)
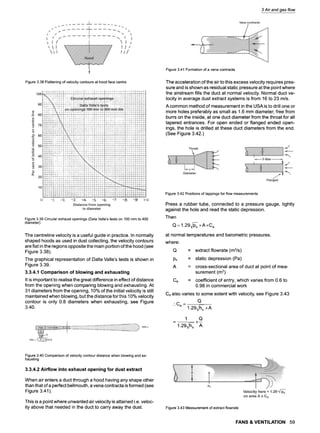
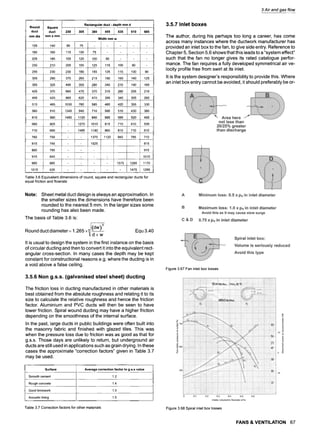
Figure 3.54 Friction loss in straight ducting
FANS &VENTILATION 63](https://image.slidesharecdn.com/fans-220730192231-85fdb985/85/Fans-pdf-96-320.jpg)

![4 Fan performance Standards
Country of
Origin
United
Kingdom
Untied States
France
Germany
Italy
Test Coded
BS 848
AMCA 210
AFNOR
NFX10200
DIN 24163
UNI 7179-73P
Date
1980
1963
1985
1971
1986
1985
1973
Ducted Outlet Simulation
ISO common parts
Duct
2D or 3D if test on inlet. Duct +
straightener if tested on outlet
Straightener + diverging duct
Outlet common part including
straightener + diverging duct
Duct
Duct + straightener
Straightener
Etoile (8 radial vanes)
Multi-cell
Croisillon (vanes)
Etoile (18 vanes)
Multi-cell
Figure No.
12-15
Comments
Equates with ISO 5801 within limited
of uncertainty
Fan will "benefit" compared with ISO
5801 if appreciable swirl is present.
Fan will benefit if inlet test method
chosen. May be penalized if outlet
method chosen - especially if velocity
profile is poor and swirl is present.
Pressure may be overstated due to
reduced number of straightener vanes
and also because pressure is not
measured at fan outlet area.
Provided pressure is measured in
common part, will equate with ISO
5801 within limits of uncertainty.
Fan benefits when there is swirl.
Regretfully ISO recommendations
have not been incorporated despite
its recent date.
Outlet tests may be optimistic, due to
increased duct size allowed where
pressure is measured. This is
partially offset by increased
resistance of straightener
Table 4.1 A comparison of national Standards
' [I! ii N
3. [i : IX] ........ 1
,,.D .i Nq
Type C
Type D
Short outlet duct
Outlet diffuser
r
3
r
r
._u
~O
t,e
E
I.L
4
1
Volume flow
)
voru.,e .ow
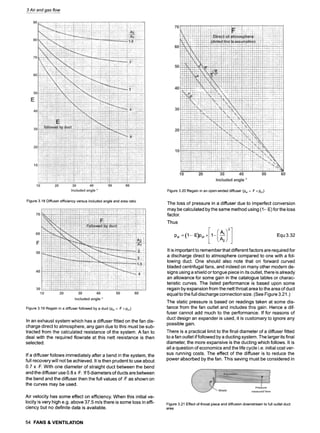
Figure 4.8 Fan characteristic with outlet swirl
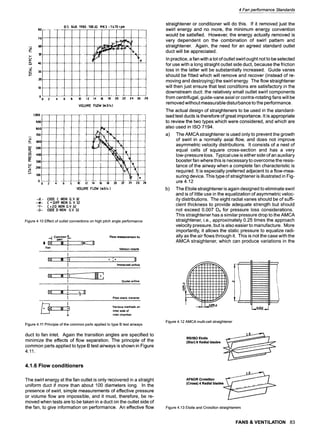
A transition section may be used to accommodate a difference
of area and/or shape but to minimize the effects of any change
in aerodynamic impedance, it is specified that the duct area
shall be within the limits of 5% less and 7% more than the fan
discharge area. The dimensions of the transition are also spec-
ified to give a small valley angle.
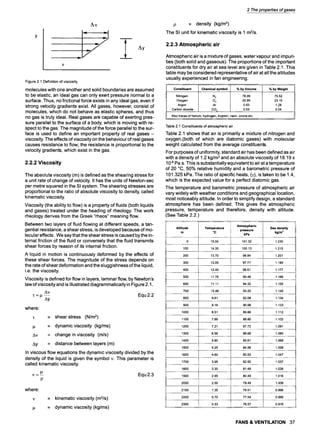
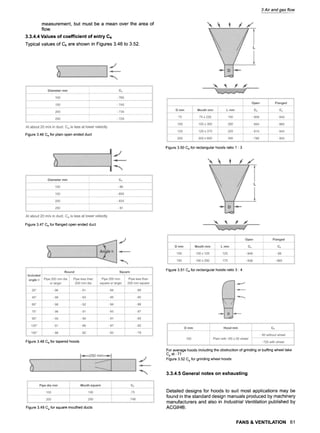
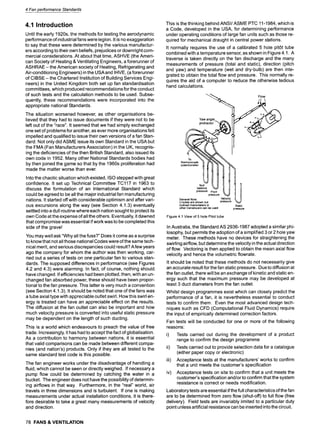
4.1.5 National Standard comparisons
Figures 4.9 and 4.10 show the requirements in BS 848:1980
and ISO 5801 for the outlet duct simulation. Bearing in mind the
difficulties concerning fans with non-uniform and swirling flow at
the outlet, the effect of using various national Codes for testing
such fans for installation categories B and D compared with ISO
5801 is shown in Table 4.1.
Common parts on the fan inlet are shorter and the pressure
measurement station need be only three equivalent duct diam-
.~I
70'
--- 60
.<
SO
>..
t.J
L~
u. 46
IJJ
..J
O
F-
ZO
IO
00 2
BS 848 '1980 : 100JG HK3-1/,70 rpm
I
l
l6 t% 10 IZ 14
)
i
J
L,
x
]-
16 IS Z0 ZZ Z4 Z~ ZS
VOLUHE FLOW (m 3/$ }
1,000
900
..-. 800
"-" 700
~ 600
~'"~ 500
400
b--
"~ 300
ZOO....
t00 ,
0
0
4
2 4
1
, ;, j
8 t0 I2 14 16 18. 20 22 24 Z6"
VOWME FLOW (m)ts)
--x- [ + DIFF NON G.V 20
--t- ~[0O[0 NON G.V20
Figure 4.9 Effect of outlet connections on low pitch angle performance
eters from the fan inlet. This reflects the more regularized con-
ditions, which apply on this side. For the same reasons, in an
accelerating flow, a greater deviation in the upper limit of duct
diameter is permitted. The lower limit is set at 5% less area of
82 FANS & VENTILATION](https://image.slidesharecdn.com/fans-220730192231-85fdb985/85/Fans-pdf-115-320.jpg)
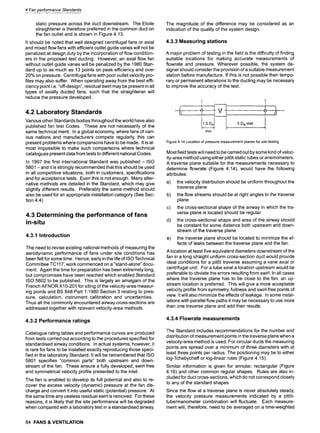
![Q
Figure 4.15 Siting of measuring points in a circular section with four diameters
and three measuring points per radius
L
f ._=
_o.~r _
I~ o,r ~
o=T I/
I/ 1
1
4--14--lb H
_i .... _i .... .J .... L---L--.LI
J.__J.__J__.L._.L._.LI
l-i---llr--lrl-]-l-F---- Fl o ~,
I-'i"---"-~'l--"-~---" 1
- .... t --r'-I
~0074H
x
Figure 4.16 Rectangular section with six cross-lines and five measuring points
per cross-line
basis. The four designs of pit6t-tube permitted in ISO 5801 are
all considered primary instruments and may be used without
calibration provided they are in good condition. They do not all
have the same insensitivity to pitch and yaw. ISO 3966 and ISO
7194 indicate likely errors for each type under non-normal flow.
The modified ellipsoidal head of the NPL design is preferred as
it is the least sensitive to misalignment.
4.3.5 Pressure measurements
Care must be taken to ensure that static pressure measure-
ments on both the inlet and outlet of the fan are taken relative to
atmospheric pressure or to that existing within a common test
enclosure. Under reasonably uniform flow, free from swirl and
separation, four interconnected wall tappings may be used
(Figures 4.17 and 4.18). As with ISO 5801, Fan Pressure is de-
fined as the difference in stagnation pressures at fan outlet and
inlet. At pressures less than about 2.0 kPa, this is virtually the
same as the previously defined Fan Total Pressure.
2a
min l
]_,ai l
. . . .
D : airway dia.
Figure 4.17 Construction of wall pressure tappings Note: a to be not less than
1.5 mm nor greater than 10 mm and not greater than 0.1 D
4 Fan performance Standards
"~To manometer
Figure 4.18 Tapping connections to obtain to obtain average static pressure in
circular airway (Shown interconnected to single manometer)
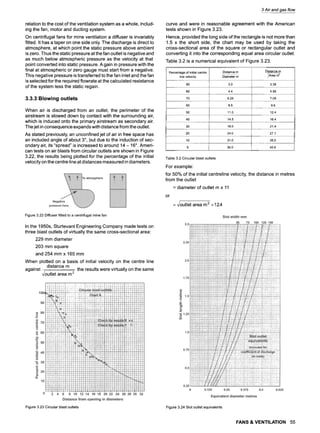
4.3.6 Power measurements
The drive shaft power may be determined either directly
through a torque meter or deduced from the electrical power in-
put to the motor terminals and using the summation of losses
method.
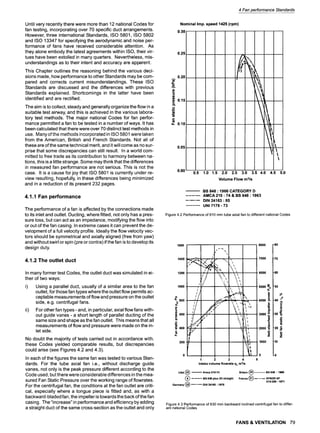
4.4 Installation category
The differences in fan performance according to installation
category are as much a function of the fan type and design, as
t.5 .-~.n~" 20
9 E
0,5 ....... l , ...... ~ 1 5 "
s
Q.
..... 0
2 3 4 5 6 7 .... 8
Inlet volume flow m3/s
Figure 4.19 Typical performance curves for a forward curved centrifugal fan to
different installation categories
1,2
t.0
O.B
0.6
8 0.2
t ,6 1.8 2.0 2.2 2A
..... Eo. i
2.6 2.8 3.0 3.2
85
75 ~"
._u
70 ~
6s ~
E
60
55
a.o
2,0 ~
Inlet volume flow m~/s
Figure 4.20 Typical performancecurves for a backward inclined centrifugal fan
to different installation categories
FANS & VENTILATION 85](https://image.slidesharecdn.com/fans-220730192231-85fdb985/85/Fans-pdf-118-320.jpg)
![4 Fan performance Standards
i c
.0
w
u
c
ii
Volumetric flo~te
Figure 4.21 Typical performance curves for a tube axial fan to different installa-
tion categories
of the position of duty point on the particular characteristic
curve. In practice the type B and type D characteristics for most
fan types will be nearly the same at the best efficiency point,
provided the fan is supplied, in its free inlet form, with a properly
shaped entry cone or bellmouth. With the same proviso, type A
performance will coincide with type C.
The essential difference remaining is that between free outlet
and ducted outlet performance, which is significant for fans of
all kinds though it diminishes as the ratio of fan velocity pres-
sure to fan total pressure falls. It will also be affected by tongue
pieces in a centrifugal fan outlet. In the latter, a length of ducting
is desirable to enable some recovery of dynamic pressure to
useful static pressure to be achieved from the distorted velocity
profile.
Typical performance curves for a forward curved centrifugal, a
backward inclined centrifugal and a tube axial fan are shown in
Figures 4.19, 4.20 and 4.21.
4.5 Testing recommendations
4.5.1 Laboratory test stands
Tests for rating should be carried out on a duct system, with flow
and pressure measurement and with instrumentation all meet-
ing the requirements of ISO 5801.
It is not proposed to detail all the alternative set-ups, as there
are a considerable number of these. The Standard totals 232
pages and has given the author many happy (?) hours of read-
ing. Suffice it to say that the requirements are detailed and
must be followed closely. However a typical duct arrangement
is shown in Figure 4.22.
If a fan is provided with its own bearings it should be tested after
a sufficiently extended "run-in" period. The inlet and outlet
should be away from all walls. Free space should be sufficient
to permit air to enter or leave the fan without setting up an un-
measurable resistance. The laboratory should be of sufficient
volume to ensure that it is free from any air currents that could
affect the performance. If it is necessary to discharge the air
into another room, then make-up air will be needed.
, i.
....... ili i i,, ,i,ii,ii,, ~ii] ,,,
Anti-swirl Flow _
Flow device Fan--- straightener Vrtol
. . u r .... . . . . . . . ,
Inlet side common part Outlet side common part
Figure4.22Typicalexampleof astandardisedtestairway
86 FANS& VENTILATION
4.5.2 Field tests
The use of standardised laboratory test stands in the field is
usually impossible. Long lengths of straight ducting to "calm"
the flow are rarely feasible whilst permanently installed flow
measuring devices such as orifice plates, venturis etc., will
have too high a pressure loss. All these lead to higherthan nec-
essary absorbed power.
Whenever the real installation differs from the idealized (and
recommended) laboratory arrangement there will be a loss of
fan performance due to the effects of swirl and/or distorted un-
developed velocity profiles. This is especially true where there
are duct bends directly on the fan inlet and/or outlets. It is rec-
ommended to read AMCA 201 or The Fan and Ductwork Instal-
lation Guide, published by FMA (Fan Manufacturers Associa-
tion). Both of these give information on how to calculate the
magnitude of likely performance reduction.
4.5.3 Measuring flowrate
Fan flowrate can be expressed as either the volumetric flowrate
in m3/sor the mass flowrate in kg/s. If a laboratory test is to
comply with ISO 5801 it is essential that readings are taken at
the prescribed measuring planes and are downstream of any
flow straightening device and at a sufficient distance to ensure
flow calming. Many flow measuring devices are permissible
within the Code e.g. orifice plates, inlet cones, venturi meters,
multi-nozzles etc. All are valid provided the correct coefficients
of discharge are used.
Pitot static tube traverses are permitted, but these are perhaps
more dependent on operator skill. They are however often the
only method possible on site. All types of pitSt head are permit-
ted, but the writer would recommend the NPL modified ellipsoi-
dal type, which is less susceptible to pitch or yaw errors.
4.5.4 Measuring fan pressure
Fan pressure is defined as the stagnation pressure at outlet mi-
nus the stagnation pressure at inlet. Up to about 2.0 kPa this is
virtually the same as Fan Total Pressure. Care should be taken
to ensure that the appropriate value is specified i.e. "total" or
"static". This may depend on the data used for calculating the
system pressure and therefore whether "velocity" pressure is
included.
4.5.5 Measuring air density
Fan performance is a function of the air (or gas) density han-
dled by the fan. It is therefore necessary to take such measure-
ments of wet and dry bulb temperature, barometric pressure
and even perhaps chemical composition so that the density
may be calculated. It should be noted that standard air density
is assumed to be 1.2 kg/m3. This equates to dry air at 20~ and
101.325 kPa or to moist air at 16~ and 100 kPa and 50% RH,
but these properties are not part of the definition.
4.5.6 Measuring fan speed
Rotational speed can be measured by various types of tachom-
eter. A good accuracy is essential as fan performance is very
sensitive to even small variations in speed. The fan laws (see
Section 4.6) show that flowrate varies directly as the speed,
pressure as the square of the speed and absorbed power as
the cube of the speed.](https://image.slidesharecdn.com/fans-220730192231-85fdb985/85/Fans-pdf-119-320.jpg)
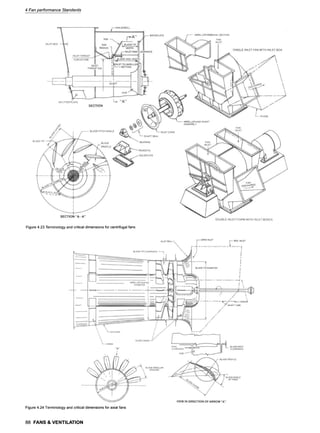
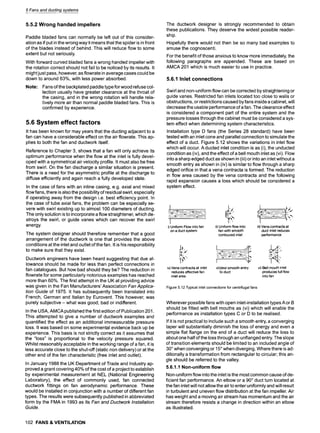
![clearances between different parts of the fan can also vary but
these may be of great importance and should be eliminated by
both careful design and by quality control at the manufacturing
stage.
Figures 4.23 and 4.24 give the terminology and show those di-
mensions which are critical. These, together with Tables 4.2
and 4.3 have been abstracted from AMCA 802. They give rec-
ommendations for maximum divergences of these critical di-
mensions from strict geometrical similarity without invalidating
the "Fan Laws" used in performance prediction, within the
stated uncertainties of the method.
One of the requirements of dynamic similarity is that Reynolds
numbers be equal at all corresponding points in the two fans -
model and predicted. Differing cross-sectional areas within the
impeller blade passages and into and out of the casing, dictate
that Reynolds number vary considerably. It is, therefore, both
customary and convenient to refer to a single arbitrary figure
based on the impeller tip diameter D and the peripheral velocity
at this point ~ND together with the air or gas properties at the
fan inlet- mass density p and viscosity ~.
Thus fan Reynolds number
ReF = P__~ND2
Changes in ReF can be the result of varying N or D or both. By
altering only N, any size effects that might accompany a change
of D can be eliminated. Tests by Phelan suggest that there is a
threshold limit for ReF for each and every fan design below
which increasing deviations from the fan aerodynamic laws oc-
cur.
The approximate threshold limits for various designs are given
in Table 4.4. It will be noted that the lowest limiting value is for
the paddle fan where, due to its simple design, flow is highly tur-
bulent throughout the flow passages. More sophisticated de-
signs have higher threshold values indicating that flow is in the
transitional region, until speeds are reached at which most of
the passages are hydraulically rough. Shock losses follow the
Fan Laws and are independent of Reynolds number but are
less with the increasingly efficient designs.
ReF Threshold
Type of Fan Impeller design
Fan Reynolds number
Centrifugal
Mixed flow
Axial
Radial 0.4 x 10⁶
Forward curved 0.8 x 10⁶
Backward inclined 1.0 x 10⁶
Backward curved 1.5 x 10⁶
Backward aerofoil
Compound curvature
Meridional acceleration
High hub/tip ratio
Low hub/tip ratio
2.0 x 10⁶
2.0 x 10⁶
2.5x 10⁸
2.5x 10⁶
3.0 x 10⁶
Table 4.4 Approximate threshold fan Reynolds numbers for different types of
fan
For dynamic similarity Mach numbers in the test and predicted
fan must be the same, which is unlikely unless they develop the
same pressure. When operating at high pressures, above say
2.0 kPa, the air or gas may no longer be considered incom-
pressible and a compressibility coefficient has to be introduced
into the simplified form of the Fan Laws. This coefficient is a
function of the polytropic exponent n and the absolute pres-
sures at fan inlet and outlet.
The assumption of a polytropic process between the fan con-
nections as defined by total pressures is in itself only an approx-
4 Fan performance Standards
imation of what actually happens inside the fan. It is, however,
adequate for predictive purposes.
To simplify any analysis, it is again convenient to specify a sin-
gle fan Mach number based on the peripheral velocity of the im-
peller blade tips when compared with the speed of sound C as
defined by the air or gas density at the fan inlet. Thus:
~ND ~ND
MaF = ~ = ~R----{-
where
C = speed of sound (m/s)
R = gas constant (287 J/kg.~
t = absolute gas temperature (~
From compressibility effects, variations in MaF produce no de-
viation from the simple fan laws unless they approach a value of
around 0.3.
This value may appear lower than anticipated, but it should be
recognised may well indicate a local value within the blade pas-
sages approaching 1.0. Critical conditions can then develop re-
sulting in a "choking" effect where there is a limitation on the
flowrate. It is not usually a problem unless the blade passage is
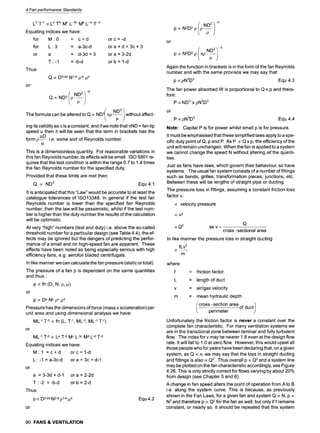
highly obstructed. Figure 4.25, also abstracted from AMCA 802
gives allowable variations in MaF.
1.0-
A
Z .9-
0
.7- i jii~
......
. zl
m i j~]
i- .6-
-4--
',.. -- ....,_._ ,
V
o --4---t
0 .1 .2 .3 .4 .5 .6 .7 .8 .9 1.0
TIP SPEED MACH PARAMETER (FULL SIZE FAN)
Figure 4.25 Allowable variations in fan Mach numbers
4.6.3 Dimensional analysis
The capacity of a fan "Q" is dependent on:
Capacity Q (m3/s)
Fan size D (m)
Fan speed N (rev/s)
Gas density p (kg/m 3)
Gas viscosity ~ (Pa.s)
Thus:
Q ocfn (D, N, p, ~)
or
Q oc Da Nb pC~d
If we assign to each of the physical properties detailed above
the fundamental units of mass M, length L and time T we then
have:
L3T1 ocfn (L, T1,ML-3ML-1T1)
or
FANS & VENTILATION 89](https://image.slidesharecdn.com/fans-220730192231-85fdb985/85/Fans-pdf-122-320.jpg)
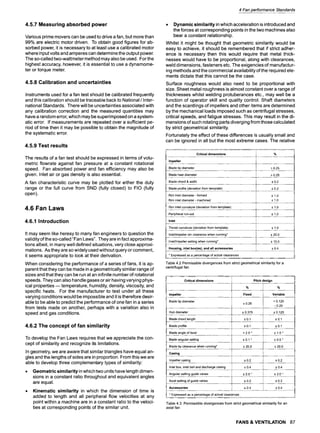
![Characteristic
at rotation N~
I Characteristic
~.,~ ~, at rotation N1
p(xQ2
,/ "+-/B
Q
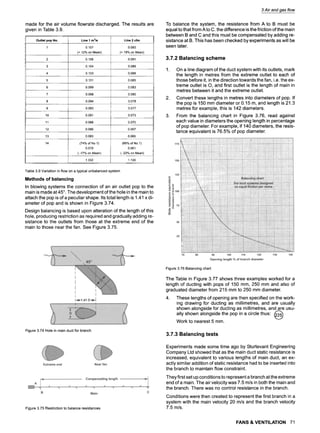
Figure4.26Fanandsystemcharacteristics
law is only valid for speed changes of about 20%. Over this
value the divergence in the value of f becomes too great.
Thus if a fan is applied to a system and its speed is changed
from N1 to N2.
N 2
QocN i.e. Q2=Q1 x Equ4.5
N1
x#N2~2 Equ 4.6
p oc N 2 P2 =P, L~J
x#N2 l~
3 Equ 4.7
P~ P2=P1 [-~-1]
An increase of 10% in fan rotational speed will therefore in-
crease volume flow Q by 10%, pressure developed p by 21%
but power absorbed P by 33%, assuming air/gas density is un-
changed. Unless large motor margins over the absorbed
power are available, therefore, the possibilities of increasing
flow by speed increase are usually limited.
At the same speed and gas density, a fan of a different size, but
geometrically similar, will have a performance as given below:
x(D2/3 equ 4.8
Q oc8 3 i.e. Q2 =Q1 ~.-~-1~)
ID2~2 Equ 4.9
p oc D2 i.e. P2 =Pl x[-~-Ij
~D219 equ 4.10
P oc D5 i.e. P2 =P1 x i-~-1]
In a range of fans to ISO 13351, where the size ratio averages
1.12, the approximate increase per size will therefore be 40%
on capacity, 25% on pressure, and 76% on power.
At the same tip speed and gas density, N1, D2 will equal N2D2
.2/D4/'
now Q2 =Q1 x ~ x
N~ /D~/
but then ~ : D22
O2
Ion/
also p2=p, I-N-~-I] x
Equ 4.11
Equ 4.12
9
" P2 =Pl
and P2=P1 L-~-l] x Equ 4.13
4 Fan performance Standards
Thus ina seriesoffans sized to ISO 13351 (a Renard R20 se-
ries)atconstant tipspeed and gas density,the approximate in-
crease per sizewillbe 25% on both capacityand power forthe
same pressure. The speed willbe reduced by 11%.
In the above analysis,we have assumed that:
9 The airisincompressible -a reasonably accurate assump-
tionat fan pressures up to about 2.0 kPa - and that air / gas
velocity triangles at inlet and outlet retain similarity after a
speed change. As an alternative the change in kpfrom test
conditions to specified duty should not exceed + 0.001.
9 Velocities are substantially below the speed of sound and
there are no Mach number effects
fan tip speed
9 < 025, say (see Figure 4.21)
velocity of sound
9 Changes of Reynolds number are maintained within the lim-
its shown.
9 Relative roughness of fan parts remain unchanged with
variation in size.
If all these effects were included in our dimensional analysis ad-
ditional variables would be introduced and the mathematics
complicated accordingly. The overall fan laws would then
become:
QocND 3 (ReF)a (MaF)b kpC Ad
p ocN2D2 (ReF)e(MaF)Fkpg Ah
P ocN3D 5 (ReF)J(MaF) kkp' A m
where:
ReF fan Reynolds number- ~pND2
TeND
MaF fan Math number-
~Rt
fan tipspeed
velocityof sound
compressibilitycoefficient-
2+2 z(r-1)
2 + (z + 1)(r-I)
where:
z :
yQp
Equ 4.14
Equ 4.15
Equ 4.16
r = absolute pressure ratio across fan
T = ratio of specific heats (1.4 for air)
R = gas constant (287 J/Kg. ~
t = absolute gas temperature (~
A = relative roughness
absolute roughness of component
impeller diameter
The calculation of r is dependent on whether the fan is ducted
on the inlet and/or outlet.
The velocity of sound in air at sea level and 20~ (293~ =
344 m/s.
Care must be taken to use N in rev/s in the calculation of fan
Reynolds and Mach numbers.
FANS &VENTILATION 91](https://image.slidesharecdn.com/fans-220730192231-85fdb985/85/Fans-pdf-124-320.jpg)
![4 Fan performance Standards
Relative roughness should not normally be of interest except
when predicting the performance of a very small fan from tests
on a larger unit, or where impeller scantlings are varied
substantially.
Further information on the above is given in a number of ad-
vanced textbooks, e.g Cranfield Series on Turbomachinery. It
is important to note however that the exponents a, b, c, etc are
peculiar to a given design of fan and probably a given duty
point. Work is being carried out in many research establish-
ments to establish them. Usually they only need to be known
when it is important to achieve the duty within very close toler-
ances i.e. within 2%.
Approximate Reynolds numbers and absolute roughness ef-
fects are typically combined in manufacturers data. Those for a
medium pressure backward inclined centrifugal fan are shown
L-
O
o
o
...
o
(1)
._o
09
O
o
r-
E
1"10
1.08
1..06
1.04
1.02
2000and above
E
..-.---8o0
Left hand J////" I~ighthand
(lowvolume)~ --(high volume)I
efficiencies~W/ efficienciesi
70~6 70 65 60 ~ 50rr45
1-0 ~ ----710 630mm
...... i .............
~1120
. ~ .................... I ~,'1250
Toobtain fan static efficiency or speed
obtain curvevalueand multiply byfactor
egsize2(XX)mm selected at 55%
efficiency on curveand 1500rev/min
Therefore:
Actual efficiency = 55x 1.09 = 60.4%
Actual speed = 1500x 0-969 = 1454rev/min
Figure 4.27 Effects on medium width centrifugal fan with backward inclined im-
peller
87"5
87 f "~''--~ 84 I ......
/
/
/
85.5 LL,
850 1 2
O
,- 86"5
.r
(2_
| 86
3 4 5 6 7 8' 9
Reynolds number • 10=
Figure 4.28 Reynolds number effects on the peak static efficiency of aerofoil
bladed fans
in Figure 4.27. The effect of fan Reynolds numbers on the peak
static efficiency is shown in Figures 4.28.
4.7 Specific values
4.7.1 Specific speed
The specific speed of a fan at a given duty is the speed at which
a geometrically similar or homologous fan would have to run to
give unit flowrate and unit pressure at the same point of rating
(assumed same efficiency) when handling air or gas of unit
density. Thus by manipulating the fan laws
NQ0.5 p0.75
Equ4.17
Ns p0.75 kpO.25
If SI units were used then Ns (and N) should be in rev/s.
4.7.2 Specific diameter
Specific diameter Ds is the impeller diameter of the geometri-
cally similar or homologous fan for which the specific speed has
been calculated.
g s = Dp0"25
0.25QO.5kpO.25 Equ 4.18
P
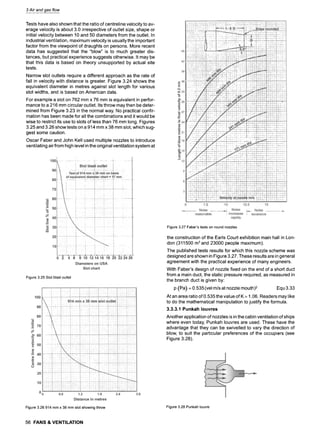
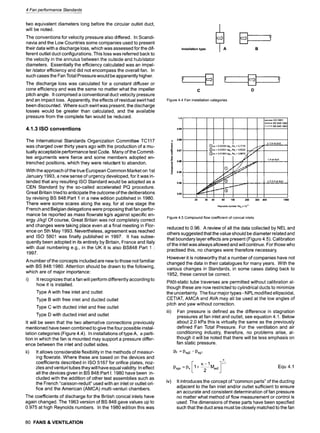
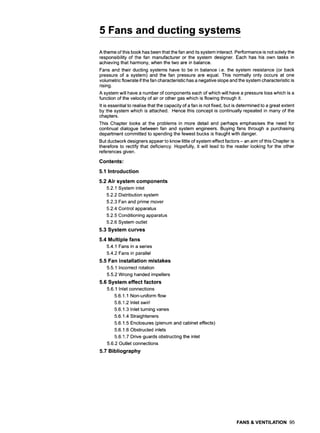
4.7.3 Composite charts
Reference to Figure 4.29 show that it is possible to plot all of a
manufacturer's product range on a single chart. Specific diam-
eter and efficiency have been plotted against specific speed. It
will be seen that the specific speed at maximum efficiency is a
unique value for a particular design.
5
u~
Lu
U._
~u 2
Q.
u~
MIXED
CENTRIFUGAL
r!,, st F
L
O
W
A ~ q.,s:,
N
A
R
R
O
W..... 4
~ or Aerofoil bladed
5 2. Backward inclined
I ~ 5.Pa,~i,
MIXED ,,
CENTR AXIAL
~ ~ FLOW
wIDE PROPELLER
1oo
90
80
7O
>..
60 ~
z
u.l
50 ~
40 <
3o ~
u..
0 1 2 3
SPECIFIC SPEED Ns
FLOW COEFFICIENT ~(p~) =, Q (}- Vo~gmelr~: fto~role m]/e
P - FOrt Dressure Pa
PRESSURE COEFFICIENT "I" (P,~) " P
,o'-u
~ u- mr tm~ee0m
J
o
-'B'0N
POttER COEFF(IENT )~ (lortr162 - ~t_~ 0 " Imll~lot ~tW m
n~"~~176 N - R=latianat ~ revl=
SPECFIC St~ED,N= - ~ ;; - N O'" ~r
s~c~ BAMeTeR.O, ..Cr.)~ . ~_.~.E.P_L"' suoecr~t=
0 '= ,,t - statx:
t - tot=
Figure 4.29 Specific diameter and efficiency against specific speed for a range
of fans
92 FANS & VENTILATION](https://image.slidesharecdn.com/fans-220730192231-85fdb985/85/Fans-pdf-125-320.jpg)

![100
90
80
r
70
40
= 60
(#J
E
o
~ 5o
30
20
10
f
1 _ _
J
/ ...... ....... .
//
5 Fans and ducting systems
//
. , . ~ .
(Ivhere 1! lies ~jr p oc
/
Q2
bet~ een I.; ;3 & 1. )) //
I ~ , , ....
real- L-'-'~ ~/'~-- ass, ]med
/7
/,~///.. . 9 ]
]
0 L-I~ L
20 4o eo ~ 1~o
% Flowrate
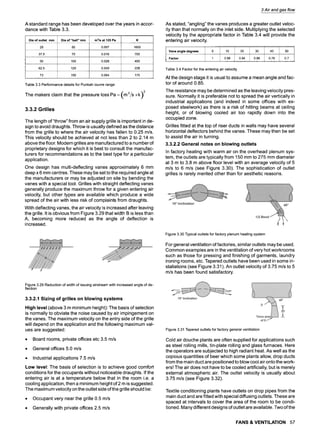
Figure 5.5 Real system pressure curve
The transition point will vary from one system to another ac-
cording to the amount of laminar flow present due to low veloci-
ties at filters etc. Only pneumatic conveying plant, dust exhaust
and high velocity air conditioning are likely to have flows which
are fully turbulent. These effects should be recognized espe-
cially when speed control is included. To repeat, fan efficiency
will change and power absorbed will not vary as N3. Power
savings are therefore likely to be somewhat less than claimed
e.g. between N2and N25. At very high turn down ratios, the sav-
ings will be even less.
It will be noted that the index for Q is continually varying and is
not a fixed value. For small plants, the index appears to tend to
smaller values - certainly below the 1.9 or thereabouts quoted
by Loeffler et al.
It will however be concluded that a square law relationship as-
sumed in applying tolerances to performance data as called for
in AMCA 211 and ISO 13348 (catalogue fans)is perfectly valid
for small variations of 3% or even 5% of flowrate.
The curve assumes standard air, and if there is a variation in
temperature and/or barometric pressure along the duct run
then the curve becomes even more complex to calculate. Such
cases are not unknown. Again, it should be emphasised that
much lower indices are to be expected in grain drying, fuel
beds, etc.
5.4 Multiple fans
5.4.1 Fans in a series
As an approximation it may be said that when fans are con-
nected together in series then, at any give volumetric flowrate,
each fan adds its corresponding fan total pressure to the com-
bined output with its corresponding power. In actual practice
there is a slight loss in pressure in the connections between the
stages.
In more exact work it should be noted that the total pressure of
the combination is equal to the sum of the fan total pressures of
the individual units minus the losses in the interconnecting
duct. Thus the fan static pressure of the combination is equal to
the total pressure of the first stage plus the static pressure of the
second stage there being only one velocity pressure lost at the
final outlet. With high pressures compression becomes impor-
tant. The second stage will receive its air at a density increased
by the pressure of the first. Due to this increased density its
pressure development will be correspondingly greater,
together with its absorbed power.
For normal commercial requirements, series operation is in use
mainly for air supply to furnaces, which require a relatively high
pressure at a small air flow. Two stages meet most needs, but a
larger number of stages may be used for applications such as
industrial vacuum cleaning, pneumatic conveying etc.
A test on a Sturtevant 2 stage STI type fan is shown in Figure
5.6 and the results are show in Table 5.1.
Ou.e, t
~ Inlet
U belt drive
No 2 Fan No I Fan
406 mm unshrouded impellers
All tests at 3100 rpm 13.9~ kPa
Figure 5.6 Example of test on Sturtevant 2 stage STI type fan
Item
Fan static
pressure at
discharge Pa
Volumetric
flowrate
m31s
Absorbed
power
Nett kW
3275 0 0.276 -
3139 0.024 0.350 -
No 1 fan alone
2665 0.092 0.667 -
1183 0.211 1.133 -
3338 0 0.350 -
3176 0.024 0.388 -
No 2 fan alone
2740 0.093 0.735 -
1203 0.213 1.156 -
3301 0 0.283 -
No 2 fan with 3089 0.024 0.291 -
inlet bend 2354 0.086 0.623 -
872 0.182 0.940 -
6676 0 0.723 3276
6153 0.033 0.902 3064
Pair of fans as
sketched 4359 0.118 1.670 2018
1318 0.224 2.267 461
Fan static
pressure at
"A" Pa
Table 5.1 Results of test on 2 stage fan
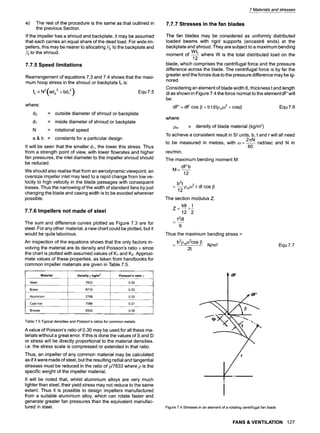
FANS & VENTILATION 99](https://image.slidesharecdn.com/fans-220730192231-85fdb985/85/Fans-pdf-132-320.jpg)

![In applying the basic equations, it is necessary to express the
shape of the profile by some mathematical equation or have the
profile closely approximate it. For very special applications, a
single equation may be used; e.g., the De Laval constant
strength disc. However, for general work the disc is usually di-
vided into a number of sections having some particular shape
such as conical rings, constant thickness rings, hyperbolas,
etc., and then the stresses in these sections are found.
The method using parallel sided, constant thickness "flat"
shrouds or backplates can give especially accurate results and
is described below. It is perhaps one of the important reasons
for using flat shrouds, as well as making blade shapes simpler.
However, because of its simplicity and adaptability to any disc
shape or load condition it has been widely used for all types of
impeller.
7.7.2 Sum and difference curves
The method uses the sum S and the difference D of the tangen-
tial T and radial R stresses, as applied to parallel-sided discs,
i.e
S=T+R
D=T-R
For the special case of a constant thickness disk, Stodola's ba-
sic equations reduce to
P[K 1--U2]
s
p
where:
K1 = 4blE
and
K2
Equ 7.1
Equ7.2
= 8eo2b2
E
= Poisson's ratio, or the ratio of the strian per-
pendicular to a force to the strain in the direc-
tion of the force (o.g for steel)
= density of the material (kg/ma)
= tangential velocity (m/s)
= angular velocity (rad/s)
= modulus of elasticity (N/m2)
b~ & b2= constants depending upon the stress condi-
tions at the bore and rim
For a disc rotating at a given speed, the only variables for any
given radius are K1 and K2. Hence, arbitrary values of K~and K2
may be assumed, and the values of S and D may be plotted
against the tangential velocity u. In this way the chart shown in
Figure 7.3 is obtained.
By means of the chart, the tangential and radial stresses at any
radius in a parallel-sided disc can be found. As K~ and K2 are
constants, any pair of curves which will satisfy the given stress
conditions at the bore and rim will also give the values of S and
D at points between. The correct pair is chosen by trial and er-
ror.
It should be noted that there is a degree of approximation in
these curves which were originally calculated for tangential ve-
locities in ft/s and stresses in Ibf/in2. They have been converted
7 Materials and stresses
to SI units without altering the original shapes- hence the un-
usual scales.
To illustrate, assume a parallel-sided disc rotating, at 5000
r.p.m, has inside and outside diameters of 140 mm and 565
mm. There is no external load at either bore or rim, i.e., the ra-
dial stress is zero at these two radii. The corresponding periph-
eral velocities are 36 and 146 m/s respectively, and the S and D
curves should intersect on both these lines.
By trial it may be seen that the only pair of curves which do this
on Figure 7.3 intersect at approximate stresses 38 N/mm2 at
the bore and at 143 N/mm2at the rim. The values of K1 and K2
used in plotting these two curves were the correct ones for this
particular case. The values of the radial and tangential stress at
any point along the disc can then be found.
S-D
R=~
2
S+D
T--~
2
7.7.3 Discs of any profile
The sum and difference curves may be used for an impeller of
any profile by approximating its shape with a number of con-
stant thickness sections. These imaginary parallel sided sec-
tions will have different widths. In the transition from one section
to the next it is assumed that the radial stress varies inversely
with the thickness and the change in tangential stress equals
the change in the radial stress times the Poisson's ratio for the
material.
7.7.4 Effect of the blades
The impeller blades, because of the centrifugal force acting
upon them, increase the stresses induced in the shroud and the
backplate but since these stresses are not continuous they do
not contribute to their strength. The additional stress due to this
dead load may be cared for by the following procedure through
the use of the sum and difference curves.
a) The vanes are divided into a number of imaginary lengths,
generally extending between the points of transition of the
imaginary parallel-sided rings making up the impeller.
b) The centrifugal force of each length is found from:
Wu 2
F =-- Equ 7.3
r
where:
W
c)
= mass of the length (kg)
u = peripheral velocity of the approximate centre of
gravity of the length (m/s)
r = radius of the approximate centre of gravity of
the length (m)
F = centrifugal force (N)
The additional radial stress R' due to this load may be con-
sidered to act at the outer side of the inner ring of the step.
It equals the total force for all the vanes, zF, divided by the
circumferential area of the outer side of the inner ring, i.e.,
zF
R'=-- Equ 7.4
xt'd
d) After the change in radial stress AR at the step is found,
the additional external radial stress R' is subtracted from it
before the change in the sum and difference curves is
found.
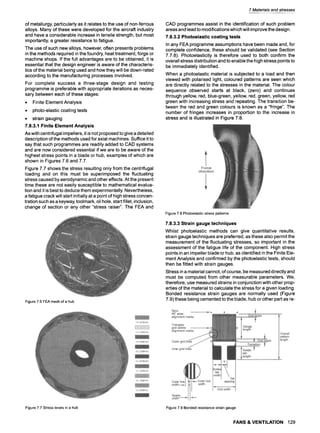
FANS & VENTILATION 125](https://image.slidesharecdn.com/fans-220730192231-85fdb985/85/Fans-pdf-158-320.jpg)
![z
(n
<
I
l
l
z
--!
i
n
r
"
i
0
"11
t
-
CO
0
3
r
O
.
_a:
s
s
r
2
0
3
O~
(n
n
.
r
03
t~
t
~
z
o
~
"1o
o~
r
3
z
3
3
t,o
Tangential
velocity
-
m
e
t
r
e
s
per
s
e
c
o
n
d
O
O
O
O
O
O
O
O
O
O
O
O0
.
.
r,.,O
I"
I.
I:I
o
I
~-I"t-qJ"N~__F.
["I"H"1~
~"Kl~'lq~~~~
~,h,~TH,,.I-,g,I-%I~lq,,~~xi,,-KK~NNNN~N
xl.'~l',~'k'tXl]x
I
I
I~
~!
~
~.1
-I
~
~
~
Ptq~'~l~'NXk'lx~,:LNkkNXN",l,
Xl,.
Xl,.XIN'~h,k~:X~kX~I-
~
I!
!1il
:o
I
_.
!
1
!
llii~l'~~"bl~
-
.
.
.
.
,
~
!~
I
X
:
~
-
~
e
.
,
~
~
:
:
o
.
.
.
.
l
k
i
~
l
k
l
"
"
o
.lll
i
1
....
l
~
'
I"
I
!/
!
~I_
III
...............................................................
I
X
~
~
~
0
0
0
~
O~
C~
.-~
-.~
~
IX3
Ix~
~
CO
O
O
O
hO
O1
f30
-.~
.1~
"
q
O
O
O
O
O
O
O
O](https://image.slidesharecdn.com/fans-220730192231-85fdb985/85/Fans-pdf-159-320.jpg)
![7 Materials and stresses
5O
. . . . k
. . . . . . . ~ m
i i 1....
& ..... & 70 N/ram
z MeonStre~
..- ,. ~ ~] 100 N/II~ 2 HC'Ott Strl~ss _
| ~ 130 N/ram2 ~ Sfrmu~
--'~L'J~ I 1 l l
BtOde Natu~ol Freclu~y o 90Hz (Av)
,,,
-_ I I ~
. . . . . .
_ J_.LL _
-- -- --i,'T ~
1~0
~ t,~ ~,~ ~x-# 1~ ~x~ 1~ ~x~ t,~ ~ ~ ~,~ ~
NO of CyCl~= tO failure
Figure 7.14 Typical impeller stresses versus LM25-TF fatigue data
7.8.3.5 Fracture mechanics
This is a relatively new subject which looks at the fracture
toughness of cast materials and their rates of fatigue crack
growth. This type of research has enabled fan manufacturers to
determine design rules which specify acceptable defect sizes
under combinations of steady and fluctuating stress. The tests
are carried out in accordance with BS 6835:1988 and ASTM
E647.
Figure 7.15 is an example of the results obtained from
LM25-TF.
50
i'
s.m=~
L 1o.ol to /.oo
Figure 7.15 Defect size and stress in rim of LM25-TF hub
7.8.3.6 Performance and fluctuating stress curves
It is convenient during the performance (rating) tests of a fan to
also measure the fluctuating stress at various flow rates. From
these tests, some interesting conclusions have been deduced.
Whilst the fluctuating stress generally increases towards the
stall point at that particular impeller blade pitch angle, the maxi-
mum is not necessarily coincident with the stall (Figure 7.16).
Furthermore, whilst different aerofoil shapes may give similar
aerodynamic results, this does not apply to the fluctuating
stress values. For new ranges of metric axial flow fans and also
for large special purpose tunnel ventilation units, manufactur-
ers have developed improved sections (Figure 7.17) which
have reduced fluctuating stress values away from the stall
point.
Note especially, that in reverse rotation high maxima can occur
on the negative slope of the characteristic - what would other-
wise be assumed to be an acceptable operating point for this
condition. Note also that maximum fluctuating stresses gener-
ally increase with increasing pitch angles (Figure 7.18). Truly
reversible sections have also been developed which not only
give virtually the same airflow in each direction (tube axial), but
also have extremely low values of fluctuating stress across the
whole performance characteristic (Figure 7.19).
R
E
V
E
R
S
E W ~ ~ I I I ~ F
O
R
W
A
R
D
R
O
T
A
T
I
O
N ~ R
O
T
A
T
I
O
N
55 1.1
.
'1.1
~ 0,9
40 0,8
~
~" os I~
~o" , o.~
9 I
_ A
~"O l
9 , ~ ~ ~ 0;3
10 , .' k 0.2
~",-'I 0.1
A L A ~L
ilb r
O 1 | l * I l I I ' ! i ! J 11 I I i [ i I .! ! I I . I ~LI. 0
VOLUI~ FLOW ( m3lsec)
Figure 7.16 GSttingen design blades - pressure and fluctuating stress against
flowrate
R
E
V
E
R
S
E F
O
R
W
A
R
D
R
O
T
A
T
I
O
N R
O
T
A
T
I
O
N
l~vod
55. 1.1
i- o
35:.
~25L
~ .
~ zo,.
'15
!
5:
OZ
1.0
0.9
0.8
0.7
~ I
0.5
0.4 ~L
STR-~._
z : i
i I i
VOLU~ FLOW f n~/sec )
0.3
0.2
0.1
,10
Figure 7.17 NARAD design blades - pressure and fluctuating stress against
flowrate
FANS & VENTILATION 131](https://image.slidesharecdn.com/fans-220730192231-85fdb985/85/Fans-pdf-164-320.jpg)
![7 Materials and stresses
~6
==
=
4
1.2
t!,o
I
15
VolumeFlow (m3/s)
Figure 7.18 NARAD design blades- pressure and fluctuating stress against
flowrate with varying pitch angles
D•RE •T•N O• • • • •
Rever=ll~
55 2.2
- ]
l I
2.0 .
[ ,:
~ ,~ .
2s 1.o
~o o.8
. ' _
i 9
0 . . . . . . . . . . . . . 0
VOL~ F
L
O
W( m3/sec )
Figure 7.19 Reversible design blade - pressure and fluctuating stress against
flowrate
7.8.3.7 Conclusions
The techniques described in this Section can act as a powerful
tool for obtaining the same integrity with axial flow fans as has
been achieved over many years with centrifugal fans.
It is essential that a design and testing procedure is adopted
which recognises that a major cause of failure in axial impellers
is due to insufficient knowledge of the fatigue criteria and how
they are affected by casting quality. Close co-operation be-
tween design and production departments is necessary to en-
sure that the stated operating life is achieved. Constant vigi-
lance is, nevertheless, indicated with continual research to
improve knowledge. Reference to Chapter 17, Section 17.6
may be useful for practical solutions and advice.
132 FANS & VENTILATION
7.9 Shaft design
7.9.1 Introduction
The shaft of all types of fan may be treated as a beam carrying
the impellers as point loads if the shaft is long, or as a thickening
of the shaft if it is short. The bearings, especially if self-aligning,
are treated as simple supports. Only in the old-fashioned
sleeve bearings, where the journal might be 3 diameters long,
was it possible to consider them as approaching rigid encastr~
supports.
The shaft must be considered for three different criteria and that
giving the largest diameter must be taken as the basis of the de-
sign:
9 Maximum sheer stress
9 Maximum direct stress
9 Critical speed
In order to carry out these calculations, it will be necessary to fix
the type, size and position of the bearings (see Chapter 10).
Where the fan is driven through vee belts (see Chapter 11) the
belt tension will give an additional load which is used for calcu-
lating stresses. It should not however be used for critical speed
determination as, unlike out-of-balance, it is unidirectional.
7.9.2 Stresses due to bending and torsion
Bending stresses result from the overhang effects of the impel-
ler and from the moment produced by the belt pull in indirect
drive units. Torsion results from the work done by the fan in ro-
tating at the speed necessary to achieve the duty. If the system
resistance is lower or higher than that specified, this will affect
the power absorbed and thus the torque required. It may also
affect the belt pull in indirect drive units and thus the bending
stress.
Max direct stress f is:
/l:ds3
Equ 7.9
Max shear stress q is:
16 ~/M2 + .T.2
q = =ds----
~
Equ7.10
where:
M = maximum bending moment
T = maximum torque
Ds = shaft diameter
All in consistent SI units.
The acceptable stresses will be determined by the shaft mate-
rial, whilst the maximum bending moment and torque are deter-
mined by the arrangement of impeller, bearing centres and belt
pull, etc.
It is essential to allow reasonable factors of safety on the maxi-
mum stresses attained to cater for the effects of unbalance, ad-
ditional accelerating torque at start-up, fatigue, over tightened
vee belts etc.
7.9.3 Lateral critical speeds
As the rotational speed of a fan is increased, it will be seen that
at certain speeds the shaft may vibrate quite violently whereas
at speeds above and below these it will run relatively quietly.
The speeds at which these severe vibrations occur are known
as the critical speeds of the rotating assembly.](https://image.slidesharecdn.com/fans-220730192231-85fdb985/85/Fans-pdf-165-320.jpg)
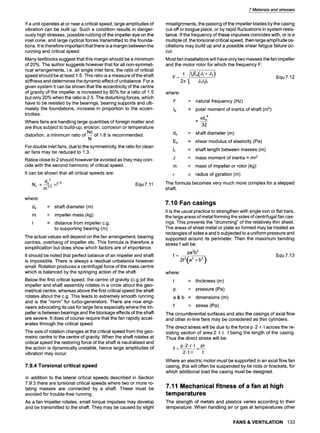
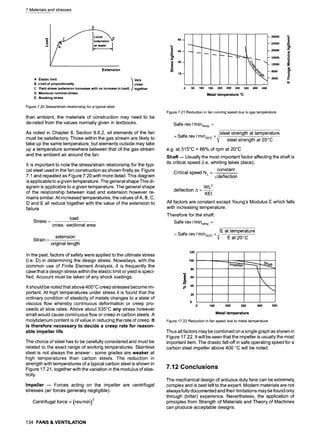

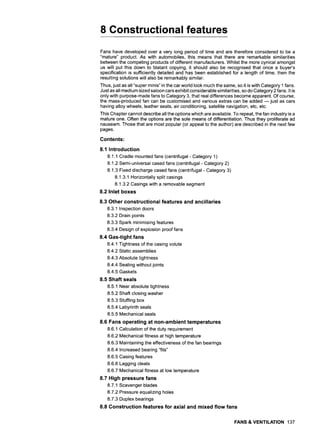

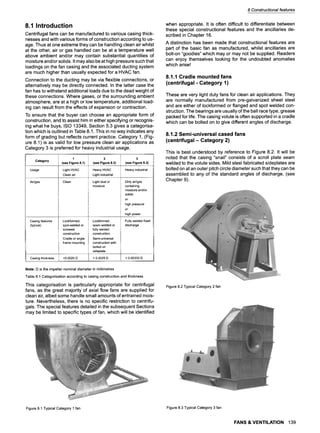
![Shaftwasher
Rexibleinlet connection avaitabl~
/
Spark minimising features /
Inletflanoe / /
Inspection
Drive
"4 j
Fan outlet available ]
guard
Anti-vibration mounts Rexible outlet connection
Cembinatien base
Figure 8.8 Constructional features and ancillaries for centrifugal fans
The inspection door usually consists of a steel plate positioned
over a rectangular or circular hole in the casing. If positioned on
the scroll, it must of course be rolled to match. Quick release fit-
ting are not recommended - rather the door should be held by
bolts and nuts, requiring a spanner to be used. Too easy a re-
moval could be dangerous when the fan is running. The rotating
impeller will be in close proximity and will be highly dangerous.
It may even be advisable to have an electric interlock with the
power supply, such that when the door is removed, the fan can-
not run.
H• 2,o Detailof joint
s
I1
I~ square as possible
l!
"P" tacks I0 mm long securing brass
lip to steel section
Weld to be carreid out by TiC arrow
process using "Everque" wire
NOTE: Cone welded to throat
Size 23 and above
Figure 8.9 Inlet Venturi cone with anti spark features
T
8 Constructional features
8.3.2 Drain points
Where a fan is handling air contaminated with liquids or va-
pours, it is recommended that a drain point is positioned at the
lowest point of the scroll. This may be screwed to accept piping
or fitted with a closing plug.
8.3.3 Spark minimising features
A non-ferrous rubbing ring is attached to the inlet cone or
Venturi, where the cone is adjacent to the eye of the impeller,
and contact could take place, see Figure 8.9. A non-ferrous
shaft washer is also necessary. These will minimise the possi-
bility of incendiary sparks being produced. Such features are
essential where explosive or inflammable gases or vapours are
bing handled. The material pairings are especially important
and are detailed in prEN14986.
8.3.4 Design of explosion proof fans
The ATEX Directive 94/9/EC of the European Union came into
force at the end of June 2003. This placed obligations on both
users and manufacturers of equipment, such as fans, which
could be the cause of explosions. As a result CEN (Commit6e
Europeen Normalisation) was mandated to produce prEN
14986. Not only does this give detailed recommendations on
the spark minimising features, it also details other requirements
concerning bearing selection, vee belt drives, clearances,
material stresses, etc.
8.4 Gas-tight fans
There are three possible areas where leakage may take place:
9 leakage of welds and seals in the casing
9 leakage at static interfaces such as flanges and joints
9 leakage at shaft seals (dynamic rotating interfaces).
8.4.1 Tightness of the casing volute
An almost absolute casing tightness can only be achieved be-
tween metallic materials when the components, such as the
scroll and volute sides, are correctly and continuously welded
together. This requires close inspection and quality control. It is
normally carried out at the same time as the inspection of split-
ting flanges. The main areas of concern are the inspection door
openings and any removable segments.
8.4.2 Static assemblies
This type of interface has to be capable of disassembly from
time to time. The usual joint comprises plane surfaces. A very
common method is to use an "O" ring of some elastic material
between two flanges as shown in Figure 8.10. Blind holes are
Gask ,s
! i ! '
Section view
Figure 8.10 Common tightening methods for static assemblies
FANS & VENTILATION 141](https://image.slidesharecdn.com/fans-220730192231-85fdb985/85/Fans-pdf-174-320.jpg)
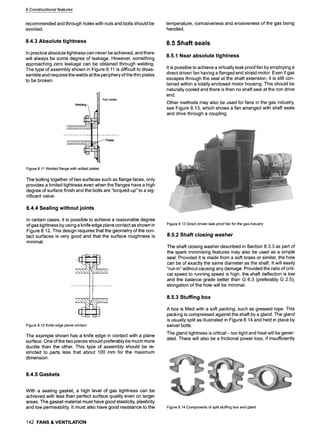
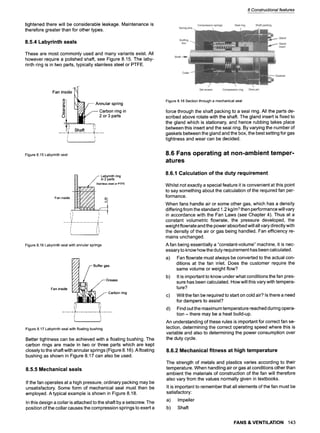
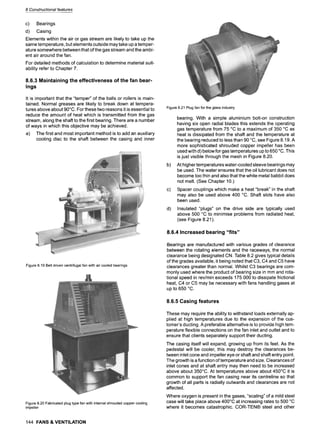
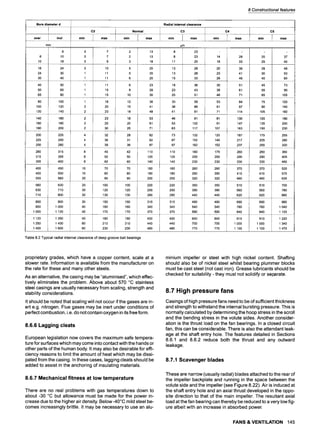
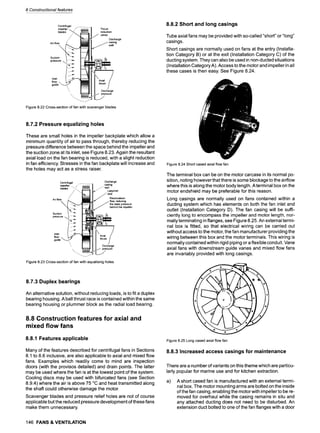
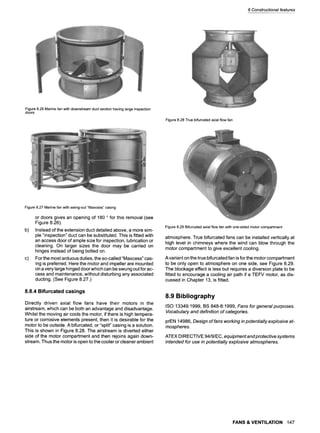

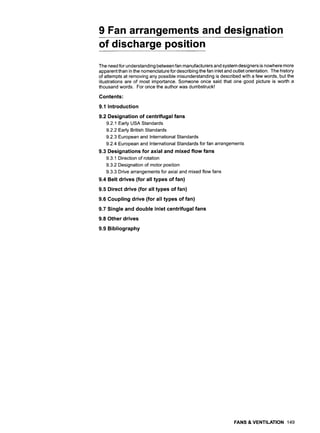
![9 Fan arrangements and designation of discharge position
9.1 Introduction
Over the years the need for understanding between manufac-
turers and their customers has determined that an agreed no-
menclature for centrifugal fans and their components was ab-
solutely essential. This applied to both positions of the outlet
flange and the mechanical driving arrangements. Motor posi-
tions for indirect drives also had to be categorised. Whilst indi-
vidual companies often had their own coding, this was not nec-
essarily helpful in a competitive situation. Confusion could arise
e.g., when one manufacturer's Arrangement 1 was designated
Arrangement 3 by another.
9.2 Designation of centrifugal fans
9.2.1 Early USA Standards
Probably the first attempts at an industry wide standard were
made by the US National Association of Fan Manufacturers in
its Bulletin No 105 dating back to the 1930s. This bulletin cov-
ered the designation of the discharge of centrifugal fans, the
position of inlet boxes, the arrangement of fan drives, and the
standard designation of motor positions. The relevant dia-
grams for these designations are shown in Figures 9.1 to 9.4.
It is of interest to note that these standards have been used in
the USA ever since, albeit with a few deletions and additions.
Fig 1 Fig 2 Fig 3 Fig 4
Counter Clockwise Clockwise Clockwise Counter Clockwise
Top Horizontal Top Horizontal Bottom Horizontal Bottom Horizontal
Fig 5 Fig 6 Fig 7 Fig 8
Clockwise Counter Clockwise Counter Clockwise Clockwise
Up Blast Up Blast Down Blast Down Blast
Fig 9 Fig 10 Fig 11 Fig 12
Counter Clockwise Clockwise Clockwise Counter Clockwise
Top Angular Down Top Angular Down Bottom Angular Up Bottom Angular Up
Fig 13 Fig 14 Fig 15
Counter Clockwise Clockwise Clockwise
Top Angular Up Top Angular Up Bottom Angular Down
Figure9.1 Standarddesignationof fan discharge
Fig 16
Counter Clockwise
Bottom Angular Down
No I No 2 No 3
.... !
No 4
Figure9.2 Designationof positionof inlet boxes
Art 1
Arr 4
Arr 3
Art
l'
Arr 2
i.........~!!!!! Arr 8
....... . I
9 I~ Arr 10
FI__E'Ln
Figure9.3 Standardarrangementsof centrifugalfan drive(AMCA- USA)
•
].___Motor
I e.............
Figure9.4 Standarddesignationof motorposition
The NAFM has been succeeded by AMCA International, which
has been influenced to some extent by the subsequent ISO
standards.
9.2.2 Early British Standards
Early efforts at the standardisation of nomenclature for dis-
charge position and arrangements of drive etc were largely
based on these American standards, but with some significant
improvements.
Instead of "clockwise" and "counter-clockwise" for rotation,
"right-hand" and "left-hand" were the designations perhaps on
the basis that a right-hand thread is screwed clockwise to
tighten. The position of the outlet was given an angular desig-
nation starting at 0 for bottom horizontal and proceeding around
the protractor i.e.
45 for bottom angular up
90 for vertical up
135 for top angular up
180 for top horizontal
225 for top angular down
270 for vertical down
315 for bottom angular down
Thus the designations become R0 or L0. R90 or L90 etc. These
were standardised in both FMA 3:1952 and British Standard
150 FANS& VENTILATION](https://image.slidesharecdn.com/fans-220730192231-85fdb985/85/Fans-pdf-183-320.jpg)
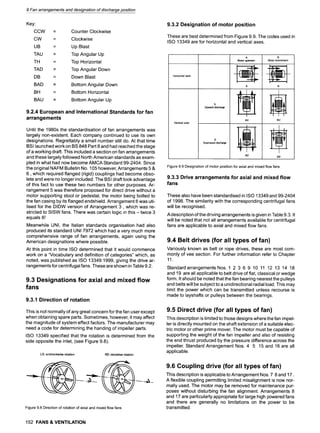
![9 Fan arrangements and designation of discharge position
Arrangement Description Motor posltlon Outline drawing
No. (see Figure 9.4)
, - . . . . . . . . . = . . . . . . . . .
1 Single-inlet fan for belt drive. --
2
Impeller overhung on shaft running in 2 plummer block
bearings supported by a pedestal.
Single-inlet fan for belt drive, i
Impeller overhung on shaft running in bearings supported by
a bracket attached to the fan casing.
Single-inlet fan for belt drive.
Impeller mounted on shaft running in bearings on each side
of casingand supported by the fan casing.
9 9 9
4 Single-inlet fan for direct drive.
Impeller overhung on m0tor shaft. No bearings on fan. Motor
supported by base.
z
5 Single-inlet fan for direct drive. --- ]'
ImpeUeroverhung on motor shaft, t~ll~ ~
No bearings on fan. Motor attached to casing side by its
flanged end-shield.
9
.................................. 9 . . . . . . . . . . . . . . . . . . . . . 9 ..... i
6 Double-inlet fan for belt drive. -- ~
i
Impeller mounted on shaft running in bearings on each side
of casing and supported by the fan casing.
9
Single-inlet fan for coupling drive.
Generally as arrangement 3 but with a base for the driving
motor.
Single:inlet fan for coupling drive.
Generally as arrangement 1 plus an extended base for the
driving motor.
Single-inlet fan for coupling drive.
Generally as arrangement 1 but with the motor mounted on
the outsideof the bearing pedestal.
10 Single-inlet fan for belt drive.
Generally as arrangement 1 but with the drive motor inside
the bearing pedestal.
u
WorZ
Ir ..... 9
Table 9.2 Standard drive arrangements for centrifugal fans
FANS & VENTILATION 153](https://image.slidesharecdn.com/fans-220730192231-85fdb985/85/Fans-pdf-186-320.jpg)
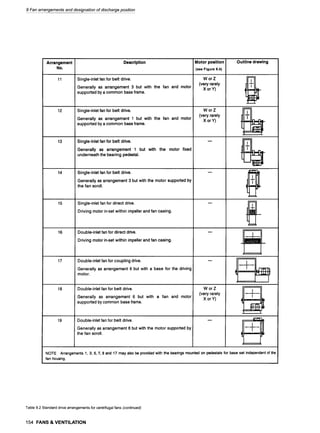
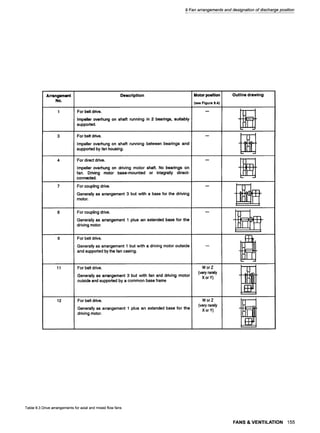


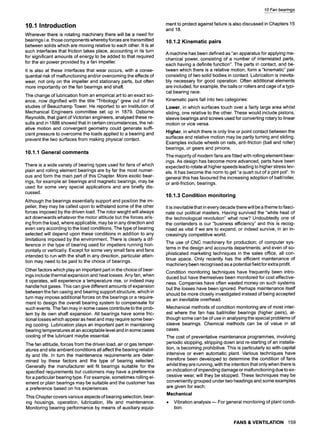
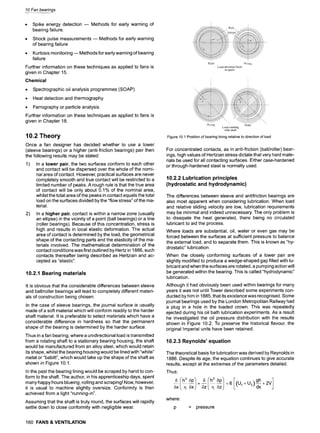
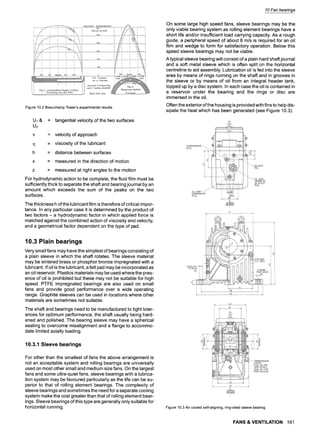
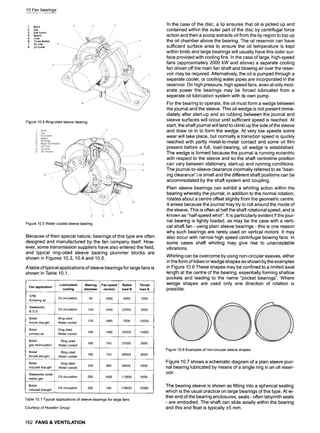
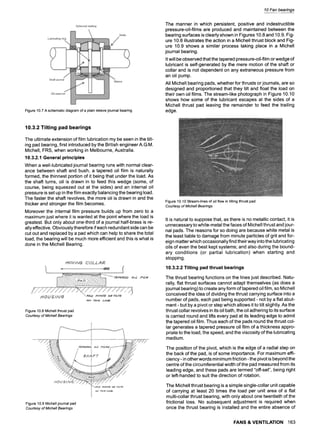
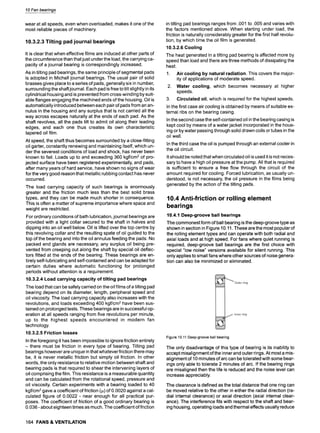
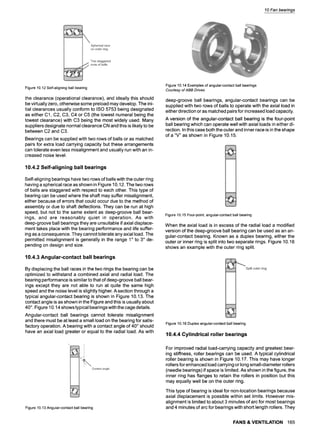
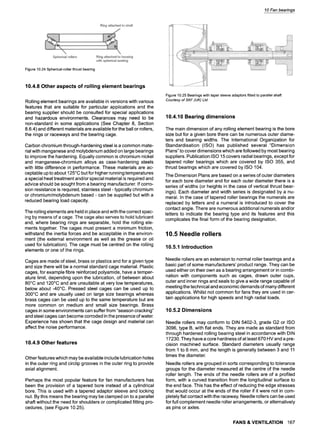
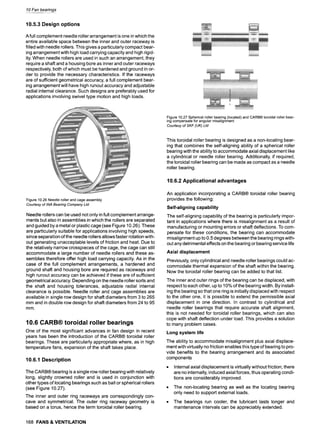
![High load carrying capacity
It is claimed that this toroidal roller bearing can accommodate
very high radial loads. This is due to the optimized design of the
rings combined with the design and number of rollers. It is also
claimed that the large number of long rollers make CARB|
bearings the strongest of all aligning roller bearings.
Also, these bearings can cope with small deformations and ma-
chining errors of the bearing seating. The rings can accommo-
date these small imperfections without the danger of edge
stresses. The high load carrying capacity plus the ability to
compensate for small manufacturing or installation errors pro-
vide opportunities to increase machine productivity and uptime.
Increased performance or downsizing
For bearing arrangements incorporating this toroidal roller
bearing as a non-locating bearing, internally-induced axial
forces are prevented. Together with high load carrying capacity
it is also claimed that:
9 for the same bearing size in the arrangement, performance
can be increased or the service life extended, or
, new machine designs can be made more compact to pro-
vide the same, or even higher performance.
Reduced vibration
Self-aligning ball or spherical roller bearings in the non-locating
position need to be able to slide within the housing seating. This
sliding, however, causes axial vibrations which can reduce
bearing service life considerably. Bearing arrangements that
use CARB| toroidal roller bearings as the non-locating bearing
are stiff because the bearing can be radially and axially located
in the housing and on the shaft. This is possible because ther-
mal expansion of the shaft is accommodated within the bearing.
The stiffness of the bearing arrangement, combined with the
ability of the bearing to accommodate axial movement, sub-
stantially reduces vibrations within the application to increase
service life of the bearing arrangement and related
components.
Full dimensional interchangeability
The boundary dimensions of these toroidal roller bearings are
in accordance with ISO 15:1998. This provides dimensional
interchangeability with self-aligning ball bearings, cylindrical
roller and spherical roller bearings in the same dimension se-
ries. The range also covers wide bearings with low cross-sec-
tions normally associated with needle roller bearings.
10.7 Rolling element bearing lubrication
Rolling element (or anti-friction) bearings need to be lubricated
to prevent inter-metallic contact between the balls or rollers,
raceways and cages. The lubricant however also has the addi-
tional function of protecting the bearing against corrosion or
other sources of environmental wear,
Bearings may be lubricated with grease, oil or in rare cases with
a solid. The best operating temperature for a bearing is ob-
tained when the minimum of lubricant necessary to ensure reli-
able operation is provided. However the lubricants become
contaminated in service and must therefore be replenished or
changed from time to time. The choice of lubricant depends on
the operating temperature range, environmental conditions
and rotational speed.
As previously noted, rolling element bearings are used for the
great majority of fan applications. Wherever possible grease is
used for lubrication as it is more easily retained in the bearings
no matter what the inclination. It also helps to seal the housing
against outside impurities such as dust and water. Lubricating
greases are thickened mineral oils or synthetic fluids. Their
consistency depends on the quantity and type of thickening
agents included. Consistency, miscibility, operating tempera-
10 Fan bearings
ture range and rust inhibiting properties are the important
properties of a good lubricant.
The lubrication interval is dependent on bearing size, rotational
speed, operating temperature and grease type. Figure 10.28 is
applicable to bearing temperatures around 70~ Below this
temperature the intervals are likely to increase, but above this
temperature they will reduce considerably. Reference should
be made to the fan and/or bearing manufacturer for further
information.
For small ball bearings, especially those used in electric mo-
tors, the lubricating interval may be longer than their service
life. They may then be fitted with shields or seals and are sealed
for life.
The amount of grease needed for a charge can be obtained
from the formula
G=K D L Equ 10.1
where:
G
K
D
L
= grease quantity (g)
= constant 0.005
= bearing outside diameter (mm)
= bearing axial length (mm)
The means of relubrication will depend on the frequency neces-
sary. Where convenient, the housing caps can be removed and
fresh grease can then be packed between the rolling elements.
If more frequent relubrication is necessary, grease nipples may
be fitted to the bearing housings and a grease gun used.
In all cases, too much grease will lead to overheating and main-
tenance staff must be encouraged not to lubricate every time
they pass the fan. High-speed fans however, often require fre-
quent greasing. There is then a danger that the used grease will
collect in the bottom of the bearing housings. In this case
grease escape valves should be fitted. These enable excess
grease to be discharged. They permit greasing to be carried out
without having to stop the fan.
C b
1.5. 2.5.
10~_ 2 J;
6. 1.5_
4 . 104.
2 - 8 .
10~ 6
8 : 4 "
6 - 3_
5- 2.5_
4- 2 -
3 ~1.5-
2.5.
25! 10~J
7,5.
5 _ 2.,&l
4 _ 2-
3 _ 1.5-1
2 _ lo'J
1.5. 7.5-1
10_ 5 _
a tf Operating hours
_
i ~, L'L .'~ = : Z,, i [ :~ " :
i .~L,.~-" ~~:,. i i "
tr:X i :
--" t ] I i I ii-i ,r ] I ]- _i:
.............. I IZZ:I.
:I:_I]i
l ! ]I]..I..ii]I
~l-I ~:]I] 1
~ [I .i.l.~ .I_I .l:: :I
.... .,, ~ I
....-II- [
lJ.il.:ll.i I I
2 3 4 56789103 2 3 4 56789104 2
102
n r/min
Scale a Radial ball bearings
Scale b Cylindrical roller bearings, needle roller bearing
Scale c Spherical roller bearings, taper roller bearings, thrust ba!! bearings
Figure 10.28 Typical lubrication intervals for rolling element bearings
FANS & VENTILATION 169](https://image.slidesharecdn.com/fans-220730192231-85fdb985/85/Fans-pdf-202-320.jpg)
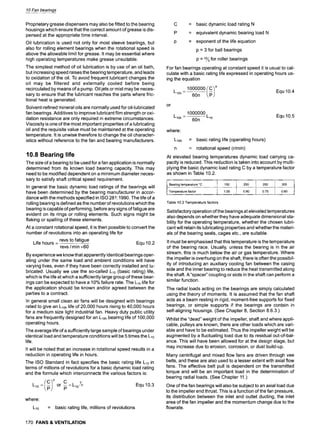
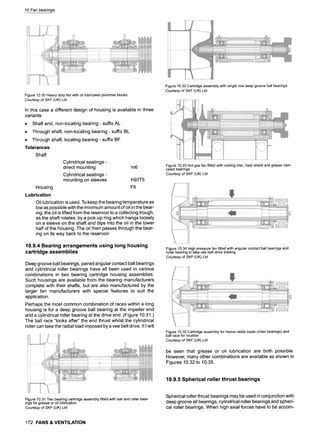
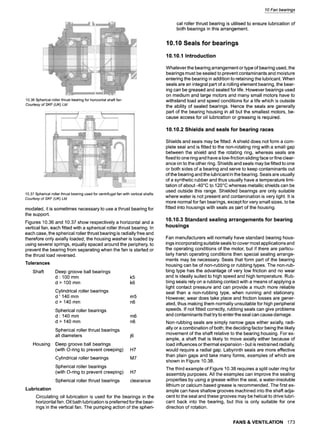
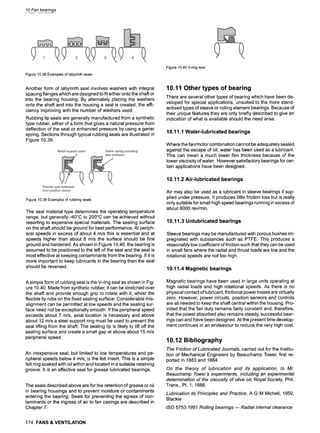


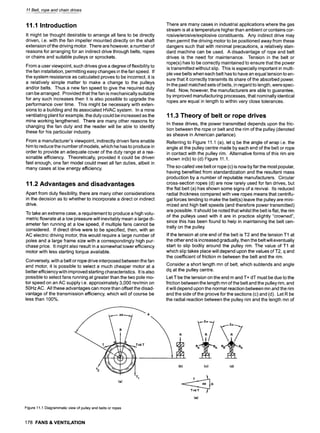
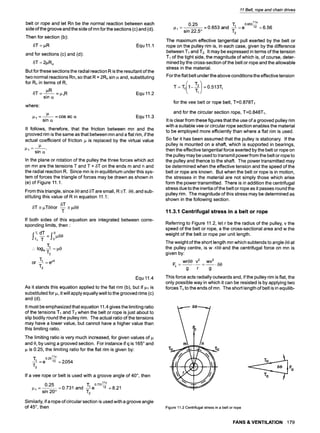
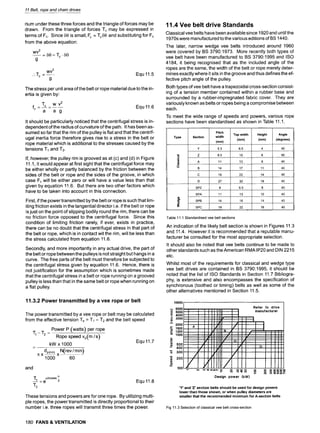
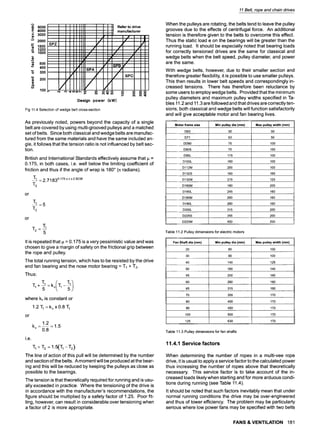
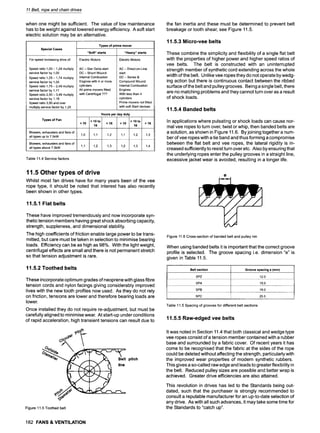
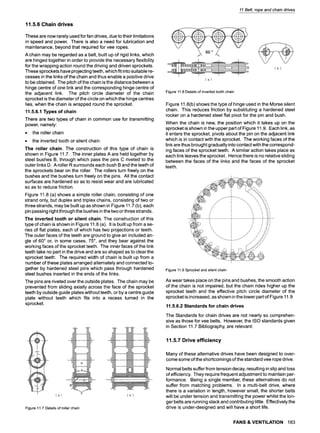
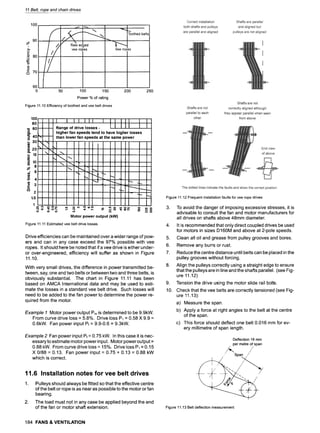

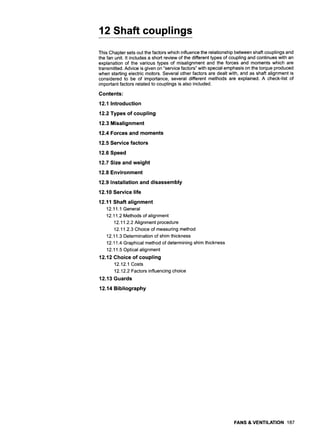
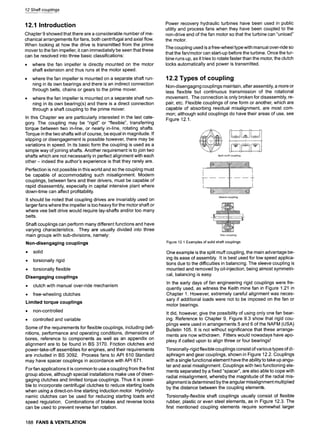
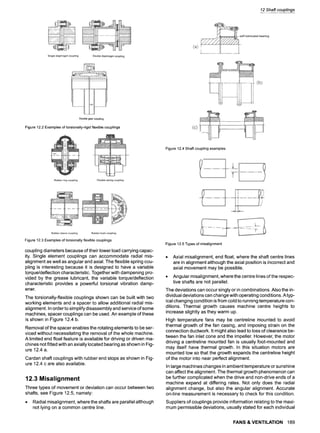
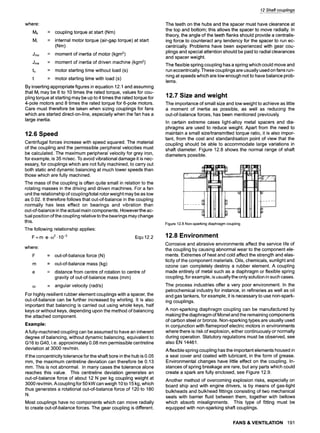
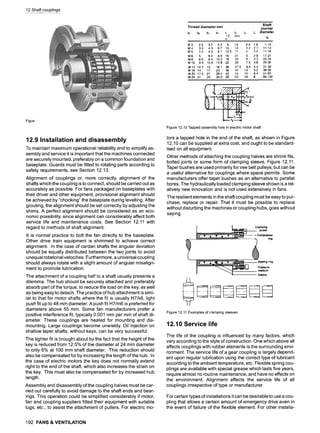
![12 Shaft coupfings
Shaft coupling type Measuring device
and location
Zero setting and
notation rules**
Parallel
misalignment
mm
Inclination*
mm per 100 mm
measured length
Remarks
Short shaft coupling.
Machined outer
diameter.
Machined on insides
x
Straight edge
D I- w
- " I! Feeler gauge
Misalignment
according to the
figure is positive
i.e. the difference
is measured above
on the motor side.
Measured
directly
as
dimension y
L-
lO0. X
D
Make due
allowance for
bearing end
float in the
machines.
Ra(
Short shaft coupling reel
Requires at least a vail
good surface at
measuring pointer. -~-
Machined on insides O
U gauge
For vertical
location zero set
the dial above.
Measured value is
read after rotating
one haft turn.
r
Y=~
L= 1.0~"x
Make due
allowance for
bearing end
float in the machines.
(Zero set the
dial indicator
underneath if
the pointer is
resting on the
pump half.)
Short shaft coupling.
Good surfaces at the
measuring pointers
Radially =1 ~ t
measured
value r
!
measured"W"
value x
For vertical
location zero set
both dial
indicators in the
position shown,
i.e. for radial
deviation above
and axial deviation
underneath.
The dials are read
after rotating one
half turn
r
y=~-- L-
lO0.x
D
Make due
allowance
for bearing end
float in the machines.
If both dial
gauges are
placed with their
pointers on the pump
half, then zero
setting should
be carried out
from underneath.
Long shaft couplings,
i.e. couplings with a
distance between the
coupling halves.
Good surfaces at the
measuring pointers
Radially measured
,I, .Jl.
value ,='~]r"value
rMf ! 1311 'P
-,coo0,,o
~leferencel
line C
Zero set both dial
gauges from above.
The measurements
rM and rp are read
after rotating one
half turn
rM-r P
4
L rM+ rp
=2.--#:'C'--"100
N~
Measurement
can also be
carried out on
"smooth"
shaft ends.
Long shaft couplings,
i.e. couplings with
distance between the
coupling halves.
Good surfaces at the
measuring pointers
Radially measured
JL j=
v, ue v, ue
r
Refer-
"~ ~ . "Couplinc
ence al b~'~ja pin
lines r c 9-
Zero set both dial
gauges from above.
The measurements rM
and rp are read
after rotating one
half turn.
FM
YM 2
rp
Yp- 2-
L=
ru § rp
2.C .100
Similar to
method IV.
Notice the
position of
the reference
lines for
calculating
angular
misalignment.
Figure 12.12 Shaft alignment methods
FANS & VENTILATION 193](https://image.slidesharecdn.com/fans-220730192231-85fdb985/85/Fans-pdf-226-320.jpg)
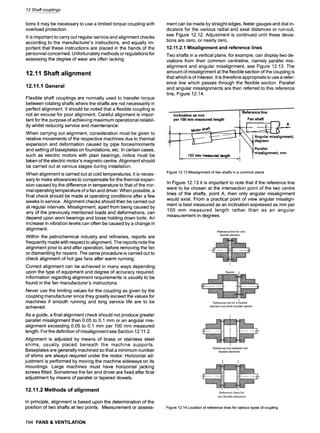
![12 Shaft couplings
U~+U 2
y = - - Equ 12.5
2
L = U2 -U1 Equ12.6
F~ F~
100 100
where:
y and L are residual misalignments
U~ and U2 respectively (with sign notation) are shim thick-
ness deviations.
For the previous example, when the proposed correction has
been carried out, the residual misalignment is"
0-0.02
y . . . . 0.01 mm
2
L __
-0.02 -0
500 300
100 100
= -0.01 mm / 100 mm
12.11.4 Graphical method of determining shim
thickness
The required shim thickness can also be determined graphi-
cally by drawing the position of the shaft in respect of the mea-
sured values using a greatly enlarged vertical scale, 100:1 for
example, and a reduced horizontal scale, 1:5 or 1:10 for
example.
The method is illustrated by the following example carried out
according to measuring method IV or V in Figure 12.12 with the
various stages:
1. Fit the measuring device according to method IV or V and
take readings rp and rMon the dial gauge.
Example:
dial reading at fan half gives rp = -1.40 mm
dial reading at motor half gives rM = +1.20 mm
2. Determine the dimensions C, F1 and F2. Note that the ref-
erence line in this example has been chosen to pass
through the measuring pointer as shown in Figure 12.16.
*---C
otor Fan
i
,4 F2 l
Reference line
Figure 12.16 Length measurements and location of reference line
Example"
Measured results
C = 180 mm
F1 = 470 mm
F2 = 890 mm
3. Draw up a diagram on squared paper as shown in Figure
12.17. Mark in the dimensions C, F~and F2 on the horizon-
tal scale.
4. Mark half the measured value at the fan half, 0.5 rp, on the
vertical axis furthest to the right. The positive sign for rp
means that the motor shaft lies above the fan shaft and is
marked upwards, whilst a minus sign is marked down-
196 FANS & VENTILATION
.
,
wards. The reading rp = -1.4 mm should thus be marked as
-0.7 mm, i.e. downwards.
Mark half the measured value at the motor half, 0.5 rM, at
distance C. The reading's positive value means that the
motor shaft lies below the fan shaft and should be marked
as a minus value and vice versa for negative readings.
The reading rM= + 1.2 mm should thus be marked as - 0.6
mm, i.e. downwards.
Join both points and extend the line to the motor feet loca-
tions F1 and F2 respectively. The motor shaft shown in the
example lies 0.44 and 0.21 mm too low at the respective
foot locations and should be raised by shims of corre-
sponding thickness, after which transverse alignment is
carried out in the same manner.
The alignment can be checked simply by using the two
measured values and rM and the distance "b" between the
two flexible elements. In the case of couplings with two
flexible elements, only the total angular misalignment of
each element should be calculated. Parallel misalign-
ments are experienced as angular misalignments by the
coupling.
To calculate angular misalignment, the parallel misalignment at
the flexible element must be calculated first, i.e. calculated at
both reference lines. These misalignments are"
r~ a.L
hp =~ Equ 12.7
2 100
hM = rM a.L Equ 12.8
2 100
The angular misalignment in the vertical plane is then deter-
mined from the relationship"
O
C
M= -b
-hP(radians) = 57.3. b-hP
(degrees) Equ 12.9
ocp= F,L_~
(radians) = 57.3. h--~ab
(degrees) Equ 12.10
The angular misalignments in the horizontal plane ~Uand 13P
are calculated in the same way.
E
E
r
i
B 1000
"o
Dial gauge Oiaigauge
Foot Fz Foot F~ nearest motor ~rest fan
I
I i J !§1,0
I 1 i t ~
I I i + o,a
I I i!
I i
............................................... 1 I + 0 ~
l I ' J
I i I I e
I ! i !
.........
t ; i ,o,4 =.
:c
I I a ~ ,.
' !; o
_c
ooo ~ ~ soo 5o0 40o ~ ~oj
_I0,! i i I
- 9 i I o,44 ..... I.. -0,2...
~ ~ C,,.,.o,r,
oo, I ] I i :
'
_
_
=
i
....... I " i I I ~ "
j I -0,4
I I
i I
, j .ois
I
I
.....
FI =470
F2=S90
P
Figure 12.17 Graphical representation of method IV of Figure 12.12, scaled
sketch of motor shaft position](https://image.slidesharecdn.com/fans-220730192231-85fdb985/85/Fans-pdf-229-320.jpg)
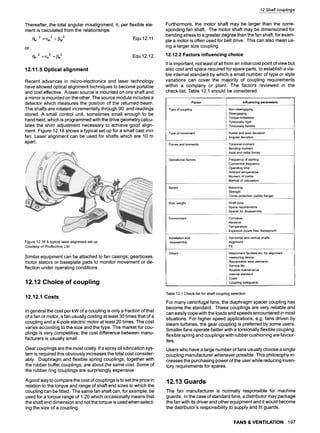
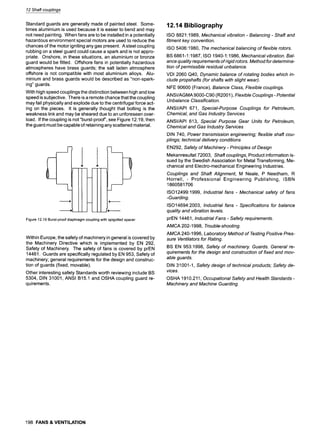
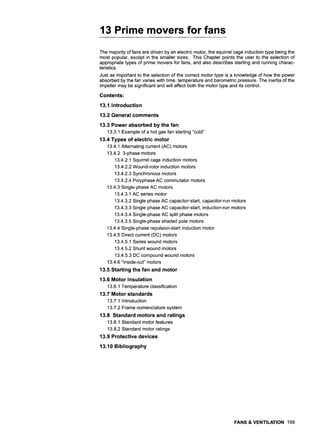
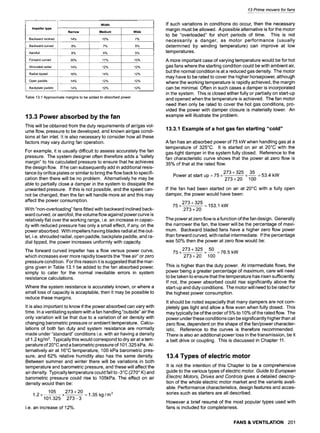
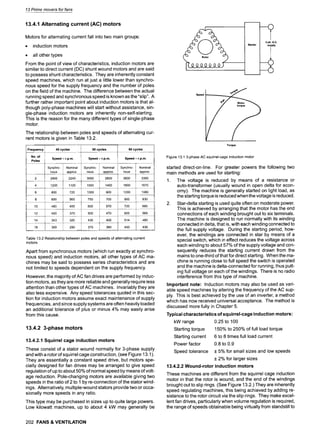
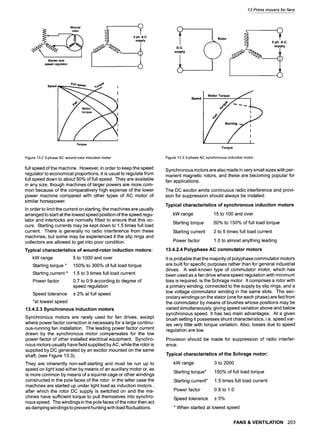
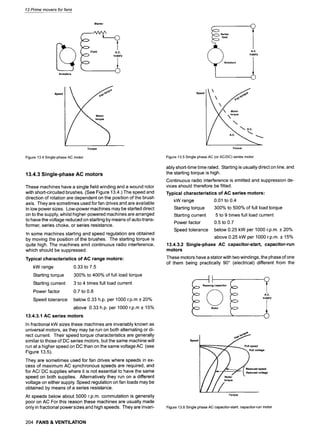
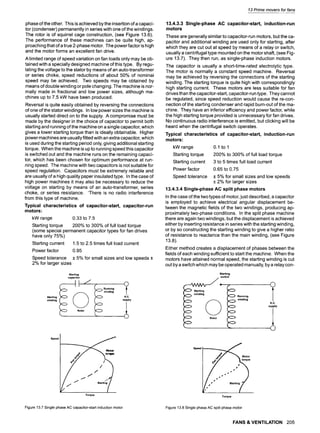
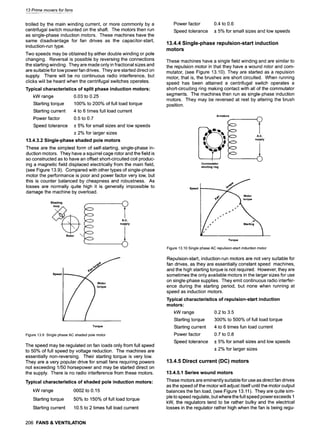
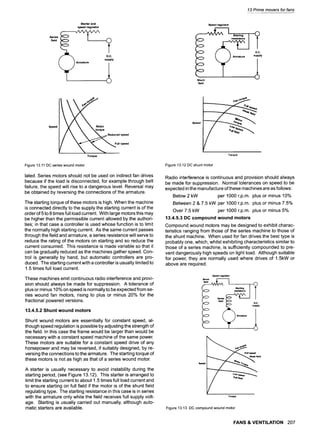
![If the torque developed by the motor were the same as that re-
quired by the fan, then they would be in balance, and the fan
would neither accelerate nor slow down. During the run up pe-
riod, therefore, the excess of motor torque over torque required
is available for accelerating the fan to full speed.
The relationship is:
Tim - tif -- Tia 4-I(:zi Equ 13.3
where:
Tia
Tim
mif
I
(zi
= torque available for acceleration
= torque developed by motor
= torque required by fan
= inertia of rotating parts
= acceleration all at any instant
We may determine the run up time from the following further
analysis:
m = mass of rotating parts (kg)
r = radius of gyration (m)
I = inertia of rotating parts (kg.m2) = mr2
N = rotational speed (rev/min)
t = run up time (S)
T = torque (Nm)
(z = angular acceleration (rad/s2)
P = power (kW)
w = angular velocity (rad/sec)
t~ = 2~N
60
Suffix
f = fan
m = motor
t = total
I = instantaneous
100 = full speed
Now generally:
co 2~N T
t 60t I
also
P 60
T = =-- xl000
T 2=t
Inertia referred to motor shaft:
= It = Im + If Nf
Torque referred to motor shaft:
Tr=T f x Nf
Nrn
Equ 13.4
Equ 13.5
Equ 13.6
2~N x lt ("2/i;a'~ 2 I
t= -- -- ort= x Equ13.7
60 Trn ~,60) P x 1000
This analysis assumes that 100% of the full load motor torque is
available during the run up period.
In fact the torque for acceleration is varying all the time from
zero rev/min to full speed. Figure 13.17 shows this. The for-
mula must therefore be amended by a factor "s which gives the
13 Prime movers for fans
300
o'~. 200
o
--L
u. 100
Torque available for acceleration
t
0 20 40 60 80 100
% Full-load speed
Figure 13.17 Torque available for acceleration
average torque available for acceleration (average of all ordi-
nates taken over very small Increments of speed).
In the examples which follow"f" is approximated for some of the
most popular types of motor and starter. However, there is no
substitute for a detailed analysis when actual fan and motor
torque/speed curves are drawn to scale on the same base.
This will enable "f' to be accurately assessed.
The time allowable for starting is dependent on a number of fac-
tors. Acceleration produces additional stresses in the fan im-
peller and shaft but these are not usually of significance. More
important are the effects of higher motor winding temperatures,
suitability of starter overload relays, and the ability of power
lines to accept the additional current. Usually a time of around
18 seconds is therefore recommended, but this may not be
achieved with very large units. The whole installation must then
be discussed between fan, motor, and starter manufacturers to
achieve the best solution.
To assist in the calculation of these times, it is necessary to
have accurate values of the inertia of both motors and fans.
However, typical values are given in Tables 13.2, 13.3 and 13.4,
which may be used for initial calculations at the project stage.
They should be replaced by actual values, once the fan and
motor manufacturers have been selected.
In most cases the power absorbed by the fan will be within a
small percentage of the motor installed power. Assuming them
to be equal, at this stage of the analysis, we may then plot
curves for the motor and fan. The various types of motor and
starter may now be considered and factors "f" determined to
give approximate run up times:
Direct-on-line (DOL) induction motor
This method of starting is usually employed up to about 7.5 kW,
and for motors of this size the torque/speed characteristic is
generally as shown in Figure. 13.15. As may be seen the avail-
able torque varies from 200% to 0% of the motor full-load
3O0
200
o
4,.,,
-o
_o
w
u_ I00
L -],, ,t
Pu OU O que
~j.Locked motor torq Je
Pull-up torque
0 20 40 60 80 100
% Full-load speed
Figure 13.18 Direct-on-line starting
FANS & VENTILATION 209](https://image.slidesharecdn.com/fans-220730192231-85fdb985/85/Fans-pdf-242-320.jpg)
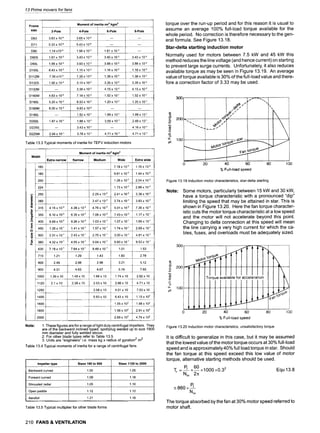
![13 Prime movers for fans
Auto-transformer starting
Autotransformer starting again reduces voltage current and
torque, but in a greater number of stages (usually three, but can
be two or four) thereby giving a higher average available
torque. Tappings may be at 40%, 60%, 80% voltage and a cor-
rection factor of two is then used. Figure 13.21 gives typical
characteristics.
300 ..... Pull-out torque
jLocked motor torque 1
= J f
2OO~ . . . . f
_ Full-load torque ~,
"4
o%. 100 ...... , I
Pull-up torque J
6 2o 4o 6o 80 lOO
% Full-load speed
Figure 13.21 Induction motor characteristics, auto-transformer starting
Slip-ring motors/stator-rotor starting
This is one of the most satisfactory methods of fan starting
since by inserting resistance in the rotor circuit, the torque char-
acteristic is arranged such that maximum is available when re-
quired. Figure 13.22 shows a higher torque is available than in
most other cases. The correction factor may be as low as 0.4
although 0.5 is a reasonable figure to use.
300
==
200
O
.,..,
I
_L
u. 100 =
0 20 40 60
% Full-toad speed
80 100
Figure 13.22 Slip-ring motor characteristics, stator-rotor starting
Correct voltage selection is also important, and care should be
taken to ensure that the motor is rated at the line voltage.
For example, a motor wound for 440 volts connected to a 380
volt supply will develop only ~) xl00, i.e. 75% of normal
torque, but more important, in star connection, the torque avail-
able for starting the fan may be as low as 20% of the direct
on-line value.
Summary:
From the above remarks it can be seen that a general formula
may be derived to calculate the run-up time of any AC motor,
i.e."
[ ] Nm equ139
t= Im+lf/Nf ~2 2 RE2
k~) Xp,xloooX
or
] 2
Nf Nm f R2
t= x~ x x 1.097
''t:
Pf 105
where
RE = ratio of the applied voltage to the motor rated
voltage
f = correction factor referred to in the text
Hence, assuming the correct voltage is applied, the approxi-
mate formula for each method of starting may be simplified to:
DOL induction
t=[im+lf /Nf/2] Nr~ 1.1
LN~) _Jx Pf Xl0-- ~ Equ 13.10
Star-delta Induction
t=Eim+lf /Nf~2q Nn~ 3.7
!kNm,) _Jx Pf Xl0--
3- Equ 13.11
Auto-transformer
t=[im+if {m, 12] mn~ 2.2
kNm) d x Pf Xl0----
~ Equ 13.12
Slip ring stator rotor
t=[im+if CNfl2] Nm2 0.55
kNm) _Jx Pf x 105 Equ 13.13
In all cases it is good practice to limit the value of t to about 18
seconds. The value of Pf to insert in the formula is that relating
to the conditions of start up.
It is important to note that these approximate formulae make
the assumption that the fan absorbed power and the motor rat-
ing are almost equal and certainly within 10% of each other. If a
larger motor is installed then this will reduce the starting time.
Strictly speaking a new correction factor should be assessed.
However, an indication of the starting time, likely to result, may
be obtained by the use of the graph in Figure 13.23. Simply by
multiplying the time calculated by the use of equations 13.10 to
13.13 by the factor kT, the reduced time may be calculated.
on ] 1 o~O,~~/~i~" t ,, I
",,
o
~ 200 ... .......... _..,~1
^,: ,~, ~.........
,t............
---q__ ..............~'...... ,t
"~ -, i "~:/ i 1 ~/
= ~- .... t ....... L .O~, torque---s,Z ..................
.~
u. 100
L-------~ t -'~, .~=-r-~-7
"- 1 1 _j
0 20 40 60 80 100
% Full-toad speed
Figure 13.23 Indication of reduction in starting time
Example:
A fan is driven by an induction motor and controlled by a direct
on-line starter. It absorbs 5 kW and is fitted with a 5 89
kW motor.
The run up time calculated from Equation 13.10 is 18 seconds.
If the motor power is increased to 7 89
kW what will be the new
starting time?
Thus:
Pm__ 7.~ -
- 15
P, 5
.'.kT =0.61
.'. trevise d -- 18 x0.61 = 11 seconds
FANS & VENTILATION 211](https://image.slidesharecdn.com/fans-220730192231-85fdb985/85/Fans-pdf-244-320.jpg)
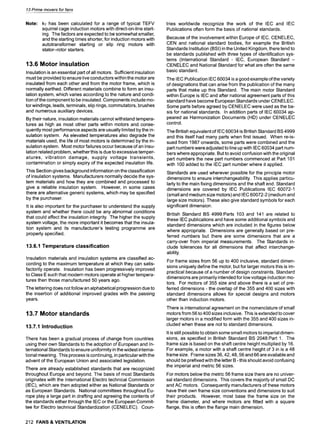
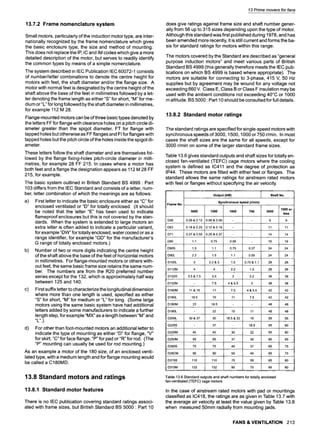
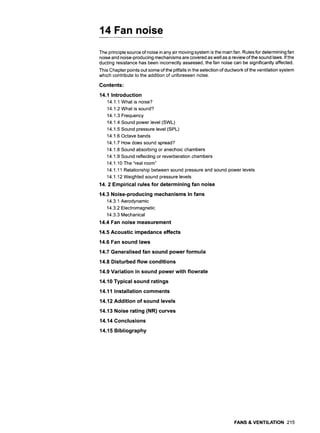
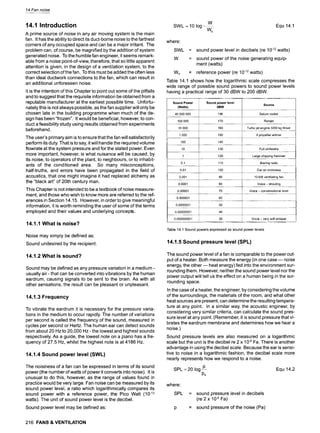
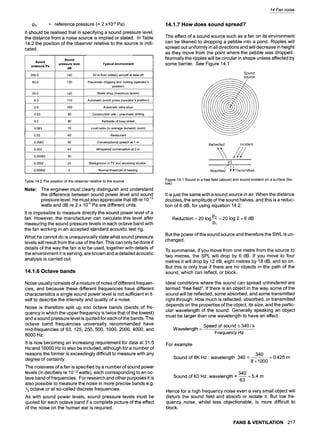
![14 Fan noise
14.1.8 Sound absorbing or anechoic chambers
If we wished to make measurements in a free field without any
reflections, then the top of a very tall but small cross-section
flagpole in the middle of the Sahara desert (after it had been
raked flat) would probably be ideal. Obviously there are difficul-
ties and an anechoic room is a reasonable alternative. Here the
walls, ceiling and floor are covered in a highly sound absorptive
material to eliminate any reflections. Thus the SPL in any
direction may be measured. See Figure 14.2.
>
f> Sound ~<
> source <
> ~,. / <
<
> <
>
<
Figure 14.2 Sound in an anechoic chamber
14.1.9 Sound reflecting or reverberation chambers
This is the opposite of the anechoic chamber. All surfaces are
made as hard as possible to reflect the noise and all the walls
are made at an angle to each other so that there are no parallel
surfaces. Thus the sound energy is uniform throughout the
room and a "diffuse field" exists. It is therefore possible to mea-
sure the SWL, but the SPL measurements in any direction will
be meaningless due to the many reflections. Such rooms, see
Figure 14.3, are cheaper to build than anechoic chambers and
are therefore very popular.
Figure 14.3 Sound in reverberation chamber
14.1.10 The "real room"
In practice we usually wish to make measurements in a room
that is neither anechoic nor reverberant, but somewhere in be-
tween. It is then difficult to find a suitable position for measuring
the noise from a particular source.
When determining noise from a single fan, several errors are
possible. If you measure too closely, the SPL may vary consid-
erably with a small change in position when the distance is less
than the wavelength of the lowest frequency emitted or less
than twice the greatest dimension of the fan, whichever is the
greater. This is termed the "near field" and should be avoided.
Other errors arise if measurements are made too far from the
fan. Reflections from walls and other objects may be as strong
as the direct sound. Readings will be impossible in this rever-
berant field. A free field may exist between the reverberant and
near field and can be found by seeing ifthe level drops 6 dB for a
doubling in distance from the fan. It is here that measurements
218 FANS & VENTILATION
Reflections
t sound
_. T- .~.
Sound level dB i
i
L.. 2 x fan dia. .._ {
]- one wavelength v Reverberant ,
q, Free field ~ ~ fie!d ...._~
] i
J
' Distance from
sound source i
(log. scale) i
Figure 14.4 Fan in a "real room"
should be made. Sometimes, however, conditions are so re-
verberant or the room so small, that a free field will not be
present. A fan in a "real room" is shown diagrammatically in Fig-
ure 14.4.
14.1.11 Relationship between sound pressure and
sound power levels
The relationship between SPL and SWL is given as:
SPL=SWL+101~ Q~ R~]
-- + Equ 14.3
4~r 2
where"
SPL = sound pressure level dB (re 2 x 10⁻⁵ Pa)
SWL = sound power level dBW (re 10-12W)
r = distance from the source (m)
Qe = directivity factor of the source in the direction
of r
Rc = So~
room constant- av (m2)
1- O~av
S = total surface are of the room (m2)
O~av = average absorption coefficient in the room
The first term, within, the brackets is the "direct" sound, whilst
the second term is "reflected" sound.
The value of the average absorption coefficient O~av
can be cal-
culated.
If we have an area S, of material in the room having an absorp-
tion coefficient oq, and area $2 with absorption coefficient 0~2,
1 (SlO~14-S20~ 4- S30~ 3 4- etc)
and so on, O~av=~ 2
o~not only varies with the material, but also differs according to
the frequency of the noise. It is therefore necessary to calculate
the SPL from the SWL in each frequency. Some typical values
of absorption coefficient o~can be found in Table 14.3.](https://image.slidesharecdn.com/fans-220730192231-85fdb985/85/Fans-pdf-251-320.jpg)
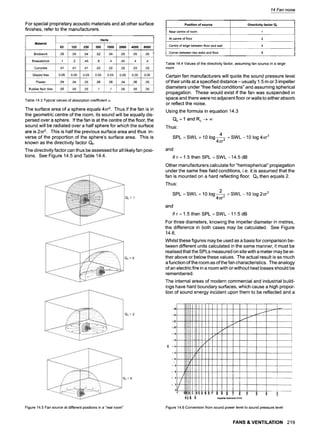
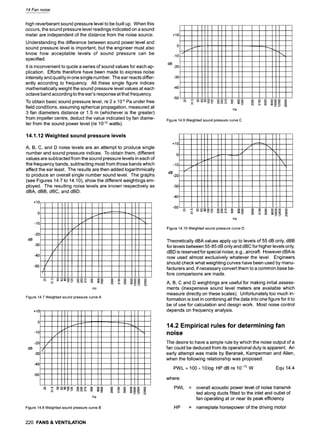
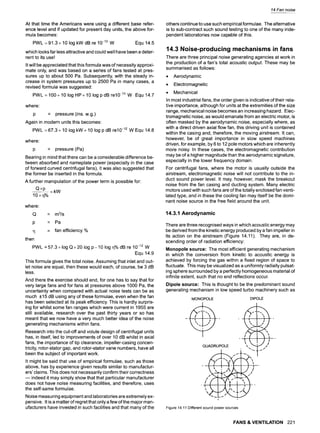
![14 Fan noise
fans. Energy conversion requires the momentum within a fixed
region of space to fluctuate, the process being equivalent to a
uniformly pulsating sphere oscillating in the x-direction as a
rigid body. Alternatively, it may be thought of as two adjacent
monopoles where one is at its maximum dimension, when the
other is at a minimum. Thus the dipole is vibrating along one
axis. This accounts for the directional nature of the sound gen-
erated, the normal particle velocity on the sphere surface being
a function of its polar location.
Quadrupole source: This is the least efficient energy conver-
sion mechanism in which sound is generated aerodynamically,
with no motion of solid boundaries, as in the mixing region of a
jet exhaust. Within a fixed region of space, there is no change
of either mass or momentum.
Energy conversion is achieved by forcing the rates of momen-
tum flux across fixed surfaces to vary. Momentum flux is the
rate at which momentum in the xi direction is being transported
in the xj direction, with corresponding velocities vi, vj. A
quadrupole source may be modelled as a double dipole, both
oscillating along the same axis. It exhibits complex
directionality.
The acoustic pressure generated by these different sources
may be deduced as follows:
~
A monopole oc-
16M (t)
r at
~ sirs p 6M (t)]
Adipoleoc~xx r ' 6t
A quadrupole oc 5--~. 6xj r' v~,vj,p, ,
where"
M(t)
rsp
x
At
= rate of addition of mass from the neighbour-
hood of the source to its surroundings
= polar distance to the observer
= radius of the sphere
= direction of oscillation
= momentum flux velocity
= characteristic dimension
= ambient density of the air or gas
= air or gas viscosity
= temperature change across the region
Generally the dissipation of acoustic energy into heat by viscos-
ity and heat conduction, is negligible over distances of less than
say 100m, in which case the viscosity and temperature defect
terms in the quadrupole equation may be neglected.
The equations detailed above may be applied to single
sources, but within the acoustic field of a fan, the degree of radi-
ation will depend also on the level of phase cancellation be-
tween adjacent sources. Indeed, this whole question of phase
difference is seen as the way forward in the reduction of fan
noise. It is leading to the introduction of scimitar-shaped
blades, angular cut-off pieces and other devices.
It was Lighthill who first applied dimensional analysis to the
acoustic power radiated by the different sources of sound pres-
sure and derived the proportionality relationships with respect
to velocity. The writer has, however, extended these identities
in the final column by recognising that, in a homologous series
of fans, all velocities will be proportional to the impeller tip ve-
locity, i.e.
222 FANS & VENTILATION
v oc~DN Equ 14.10
where:
D
N
Thus
= characteristic dimension, is recognised as the
impeller tip diameter (m)
= impeller rotational speed (rev/sec)
for a fluctuating mass or monopole the generated sound power
o c -
PD2 v4 ocpD6 N4
C C
for a fluctuating force or dipole the generated sound power
pD2 v6 pD8 N6
C3 C3
for turbulent mixing or quadrupole the generated sound power
pD2 v8 pD10 N8
O C - - O C ~
C5 C5
Now we know that the air power P, i.e. the power absorbed by
the fan impeller
P ocpD5N3 x fn (ReF)
We may therefore state that:
Sound Power Wn
ocp DN ocPMaF x fo (ReF) for a Monopole Equ 14.11
C
Ecl 3
ocP -- ocPMaF3 x fn (ReF) for a Dipole Equ 14.12
ocPMaF5 x fn (ReF) for a Quadrupole Equ 14.13
~DN
as, by the re-introduction of =, we can recognise that
c
Mach number related to the impeller tip speed, i.e. MaF.
is the
In high speed fans this can approach 0.3. The Reynolds num-
ber function has the effect of reducing these indices.
We can also see that in a homologous series of fans, the gener-
ated sound power Wn oc D,~N,where K must lie between 6 and 10
whilst t is some number between 4 and 8.
Overall sound power radiation for any homologous series of
fans will have a sound power/rotational velocity relationship,
which depends on the relative contributions of the three
sources. However, it is not simply a matter of how an acoustic
mechanism varies with a typical speed, but rather how the flow
conditions related to that acoustic mechanism vary with speed.
Whilst a considerable amount of work has been done in at-
tempting to define a consistent relationship between fan rota-
tional speed and the generated sound power, unless strict simi-
larity is ensured, or design variations accounted for, the
empirically derived equations may give rise to considerable er-
ror. Consequently, results from various researchers differ and
the exponents have been variously quoted between 6 to 8 for k
and 4 to 6 for L. It should be noted here that the Beranek formula
and its extrapolations assume t = 5 as power absorbed oc Qp
and Q ocv, p ocv2and the pressure term has a coefficient of 20.
The first theoretical study of noise from rotating machinery was
probably that of Gutin in 1936. His basic equation assumed a
steady state where the blade loading distribution was inde-
pendent of time. Here an element of gas within the area swept
by the rotor was considered to receive an impulse periodically
with the passing of a blade. The impulses were treated as a se-](https://image.slidesharecdn.com/fans-220730192231-85fdb985/85/Fans-pdf-255-320.jpg)
![14 Fan noise
ries of dipole sources distributed throughout the swept area,
and of constant strength at any radius. The dipole source am-
plitudes were obtained from the thrust and torque loading con-
ditions, the fundamental frequency of the noise generated be-
ing zN, where z is the blade number and N is the rotational
frequency (revs/sec). The resultant sound field can be ana-
lysed into a series containing the fundamental frequency and its
integer harmonics. It is assumed that the acoustic pressure
satisfies the homogeneous wave equation:
(~2
C 2 (~2 p = 0 Equ 14.14
P
8t 2 8x
The fluid surrounding the blade surfaces must, therefore, have
velocities which are low compared to the speed of sound, such
that acoustic waves can travel radially from their source, this
may not be the case and it is then necessary to consider the
fluid as a perfect acoustic medium containing quadrupole
sound sources of Tij = pvi, Vj -I- Pij - 02 (~ij.
As previously stated, the last two terms in this stress tensor
may usually be ignored as the quadrupole strength density be-
comes equal to the "fluctuating Reynolds Stress" of the gas
around the blades.
It is, therefore, possible to itemise the source components of
the whole radiation field such that sound produced by a fan may
be regarded as generated by monopole sources related to vol-
ume displacement, dipoles distributed over the machine sur-
faces and quadrupoles of strength density Tij distributed
throughout the surrounding gas.
Lighthill's acoustic analogy was to regard density variations
within the gas as being driven by a source distribution
52P _C 2
K = -~ v2p
for the general case of an unbounded fluid, but in the real world,
solid boundaries are present. Modifications to the theory are,
therefore, necessary to take account of reflections at these sur-
faces and also for an uneven quadrupole distribution as these
may only exist external to the blades. These have been consid-
ered by Curie and John E Ffowcs Williams who have taken into
account surface force distributions and moving boundaries.
Practically, sources of aerodynamic noise within a fan may be
grouped under the following headings:
9 thickness noise due to the passage of blades through the air
- a quadrupole source
9 torque and thrust noise - quadrupole sources
9 rotation noise due to the blades passing a fixed point e.g.
cut-off- a dipole source
9 vortex shedding due to flow separation from the blades - a
dipole source with some Reynolds number dependence
9 air turbulence noise due to shear forces when the blades
are stalled - a quadrupole source
9 interference noise due to contact between turbulent wakes
and obstructions
9 pulsation noise - where at high system pressures the
flowrate regularly varies and a pitched tone is produced a
the frequency of the pulses - a monopole source.
An overall assessment of the aerodynamic generating mecha-
nisms has been made by Neise and these are shown in Figure
14.12.
It will be noted that both pure tones (discrete frequencies) and
broadband (random) noise is produced. Rotating blades dis-
place a mass of gas periodically and generate sinusoidal pres-
sure fluctuations in the adjacent field so that thickness noise is
found in all but the very highest pressure fans, the acoustic radi-
ation efficiency is low and thickness noise is not, therefore, of
great importance.
Often a fan will operate in a duct system where the approaching
airstream is not fully developed. The velocity profile may be
"peaky", contain swirl, or indeed be axially distorted. Thus its
impeller will be subjected to unsteady fluid forces, since both
the magnitude of these velocities and their angle of attach will
change with angular position.
Tyler and Sofrim have shown that the phase velocity of these
unsteady blade forces may be much higher than the relevant
impeller peripheral speed, and even be greater than the speed
of sound. Their acoustic radiation efficiency will thus be very
high and tonal noise will be produced at blade passing fre-
quency and its harmonics. The usual cause of such noise will
be the presence of bends or transformation pieces adjacent to
the fan inlet. Even sagging flexible connections can be a prob-
lem. In the fan design itself, upstream guide vanes or motor
supports can cause wakes before the impeller and again result
in unsteady blade forces.
The most important source of noise in a well-designed fan and
duct system is due to vortex shedding from the backs of the im-
peller blades. This is a dipole source and is usually broadband,
although instances of discrete frequency have also been noted.
Thus the noise generated in such fans Wn ocv6 ocDSN6.
The spectral shape of the noise from a fan varies according to
its design. In very general terms, an axial flow fan may have
FANNOISE
discrete- broadband
I .... ,,,,'............ t
MONOPOLE DIPOLE
bladethicknessnoise bladeforces
discrete discrete+ broadband
t
....... : ! i
STEADYROTATINGFORCES
(GUTtNnoise
discrete)
..........
9 I
QUADRUPOLE
turbulancenoise
broadband
UNSTEADYROTATINGFORCES
discrete+ broadband
1 !
i ....... l:]:]i i:::]i...................
:::iii]]] ] i ..........
:::::::::::::::::::::::
::::::::::::::::::::::::I:::::::::: t
NON-UNiFORM "SECONDARY
I VORTEX TURBULENT
UNIFORM NON-UNIFORM
STATIONARY STATIONARY UNSTEADY FLOWS l SHEDDING BOUNDARY
t
FLOW FLOW FLOW I LAYER
continuous dis~ete i narrow-band+
broadband
discrete discrete broadband broadband I broadband
Fig. 14.12Summaryof aerodynamicfan noisegenerationmechanisms
FANS & VENTILATION 223](https://image.slidesharecdn.com/fans-220730192231-85fdb985/85/Fans-pdf-256-320.jpg)
![14 Fan noise
high noise in the octave band containing the blade passing fre-
quency, zN (Blade number x rev/sec) with a declination of
around 2 dB per octave on either side. The peak at blade pass-
ing frequency can exceed the general spectral level by 4 to 10
dB, being especially severe where the impeller is eccentric in its
casing. There may also be additional tones generated at inter-
active frequencies determined by (blades + vanes), (blades-
vanes) etc., the strength of these being dependent on the gap
Blade No.
between them, and the ratio
Vane No."
Furthermore, much recent testing of axial flow fans has shown
high noise levels in the 31.5 Hz and 63 Hz bands.
Perhaps there has been too much extrapolation of idealised
spectra in the past. It should be remembered that in the 1950s
and 1960s, measurement of noise below the 125 Hz octave
was next to impossible with the state of instrumentation and
knowledge at that time.
A centrifugal fan will have a spectrum with its peak towards the
lower frequencies. The declination is of the order of 3 to 7dB
per octave band dependent on blade shape, but this general
statement requires a host of provisos. In backward-bladed
fans, the blade passing tone and its harmonics may be of espe-
cial importance. With the flat inclined type, they are easily iden-
tified above the general broadband background. With back-
ward-curved blades, they are not so pronounced, and are
lowest with backward aerofoil designs.
Sound waves produced by a source within a duct will also un-
dergo reflection, interference and decay according to the fre-
quency of the emitted wave. Centrifugal fans usually run at
lower Mach numbers than axial fans and the predominant
tones have wavelengths larger than characteristic impeller or
duct dimensions. The overall radiated sound power may be
greatly affected by reflection properties of the casing and
ductwork. This can lead to some distortion of the sound power
and directivity pattern, especially at low frequencies.
Whilst an uncased centrifugal impeller usually gives a flat fre-
quency spectrum, the addition of a case leads to enhancement
of the noise at well defined frequencies, related to the casing
geometry. Flowrate variations do not significantly affect the
overall shape of the cased spectra, although the magnitude, in
particular frequency bands, can vary.
It is clear, therefore, that the overall radiated sound power can
be quite different from the generated power. The casing may
act as a Helmholtz resonator and a major casing dimension
may relate to the wavelength of some important frequency.
Overall, this can mean a reduction in the speed and size indices
500ram FAN - iN DUCT LwclB re t0"t~ WATTS
.... , ' ' ' J m.......
9 !
'"' I I
F '
' I I f J ' r
.....:
I tMPELLER TO GutDIE v/~IE "~I~ActNG i # !~ f ' " "~~,," '
ti3 i if . . . .
L _ J J ~ 9r ~ _
I-- 107
105 . . . . . . . . . . . . . . . . . . . . . . . . . . . . . . --
l i e Mae;~ M~ M Max Md M
,o, ~ , ....,-l',<~'~ I I,I,~ i .]~o-I-
' -........ ~ ! 1~o-2;'1o i 9e,e 1~.3 I g8,2 14,, 14.ee/5.~5/
1500 1600 1700 1800 1900 2000 2100 2200 2300 2400 2500 2600 2700 2800 2900 3000 3100-3200
ROTATIONAL SPEED- rpm
Figure 14.13 Sound power levels for a mixed flow fan at a range of rotational
speed
over most of the fan performance envelope with sudden in-
creases at identifiable speeds (Figure 14.13).
In the example shown, the first peak was seen to be where the
blade passing frequency coincided with the duct cut off fre-
quency (change from plane wave propagation to more complex
modes). The second peak occurred where impeller resonance
coincided with the second harmonic of blade passing
frequency.
14.3.2 Electromagnetic
Whilst a very small number of fans may be driven by prime mov-
ers such as steam turbines or petrol engines, the vast majority
m in excess of 98% m are driven by electric motors. With axial
flow fans, it is common for the fan impeller to be mounted di-
rectly on the motor shaft extension. Centrifugal fans, may, of
course, be vee belt drive or directly driven either through a flexi-
ble coupling with or without an intermediate gearbox (this is
common in the UK on large mine ventilation fans).
Again with the majority of fans, electric motors are of the totally
enclosed squirrel cage induction type suitable for a three phase
supply. Single phase motors are usually limited to fractional
horsepower outputs.
The induction motor is extremely reliable and robust. In nearly
all cases it may be considered symmetrical both mechanically
and electrically. The windings are balanced between phases
and slots. Care is taken to ensure that the rotor runs in the cor-
rect position axially within the stator field, and that the airgap
between the rotor and stator is the same at all axial and radial
positions. However, especially with direct driven fans, there will
be an end thrust due to the impeller action and this will "try" to
take the rotor out of the magnetic field, being resisted by the
magnetic forces and also such devices as wave washers in the
bearing housings.
Skewing of rotor slots is often resorted to, to improve starting
performance, and has also been considered as a means of re-
ducing magnetic noise. This, however, has been the subject of
much debate. Certainly an axial thrust is generated which may
lead to increased noise emission.
Many fans are driven by 2 pole motors running at approximately
49 rev/sec on a 50 Hz or 59 rev/sec on a 60 Hz AC supply. If the
rotor does not run in the centre of the stator, or if the stator core
presents an unequal reluctance path, then a homopolar flux is
generated which tries to circulate through the core, along the
shaft returning via the end cover plates and frame. This causes
noise and vibration at twice line frequency
The heart of an induction motor is its laminated iron core and
the stator and rotor windings. As the core is in no way con-
nected to the power supply nor is power directly removed from
it, it can be considered as passive. It is, however, the path of
minimum resistance for the flux generated by the magneto
motive force (mmf) set up by the stator winding, which itself is
the path of least resistance for the input current.
Magnetic noise is produced by vibration of the laminations, its
form being complex and taking place about all axes.
The problems of producing a low noise electric motor are se-
vere. Yang has "de-mystified" the subject to a very large extent
and shown that the noise emitted by a motor depends not only
on the electromagnetic forces but also on the response to those
forces by the motor carcase, and end- shields and to their radi-
ating characteristics. He has also shown the value of parallel
path winding.
The rotor must be concentric with the stator bore, and this re-
quires that the bearing and end-shield location and stator pack
tolerances all be closely controlled during manufacture. Bear-
ing housings and end-shields need to be sufficiently rigid to
224 FANS & VENTILATION](https://image.slidesharecdn.com/fans-220730192231-85fdb985/85/Fans-pdf-257-320.jpg)
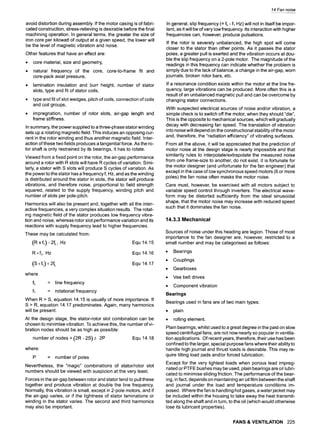
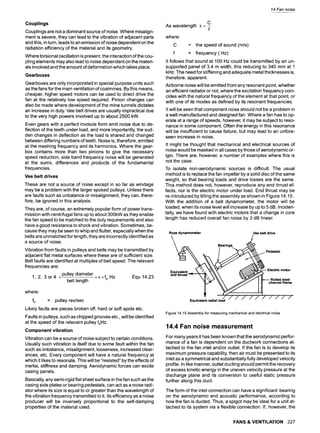
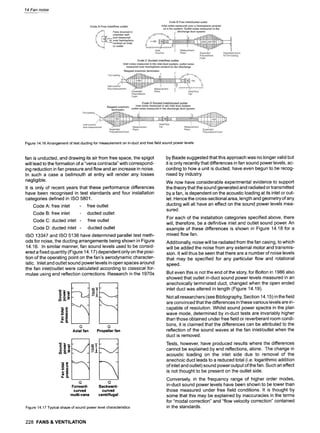
![14 Fan noise
CAT A . INLET OUTLET
110[ ................................................ "::~t 110T .................................................... "1
100 ...................... ......................... m~: 1001" .................... ............................ ~:'=1
90 ~ 90 ................................................
Lu
.J 80 ............... : ".~-,....... 74.9..................
~: m ~oo. 7~.4 7 0 9 ~ - - ~ 70.9 i I 1
" tt: tt : t:Nt:lttt tt
~0 70 .....B.7;7.. ~ .........
(z. 60 o..
(:3 C}
z Z
,0'~ ,, ,, =., _.... '~
o. . . . . 111II1111to
9
CAT B FREQUENCY Hz FREQUENCY Hz
~0! ................................................... ] ~0r ....................................................
100 ............................................... =~t ~ 100~ ................................................ ~.1
~' ~o .................................... ~t ~, 9o T ~=~
84., .............. , 1"..... "~';.; ........... "i~.; ......................... "'r]
~l~=m"~ ..... .~,.0",,.,'":S.';i"; ......... rll . ~,~::,~-r~:._:;....:~---;,,.0..
. .. ...................
,,., m
tllr ,
,o llllI1;i;llllflll I;I1:rl/111111 i IIir/lltll:lllirl;l;[l,l;l[1; 1t
=
G ,.- o~ . . . ~ ,-. o~ . . . .
CAT C FREQUENCY Hz
110~ ...... ......................................... ""i~t
100 ....................... ~.......................
13
ua
u.l " 68.0
o
z Otltl-lt
O
03
9
-: o.i ,d r
CAT D FREQUENCY Hz
,-- ~ ,,r =o
FREQUENCY Hz
1~ ............................ ....................... i
T 79.~ 77.s ~0.7 79.3 7~ 9 r~
80 72.6 ~173,3......... ';~~72.3......... II:
t:#!tl:lll]ltt]tl
FREQUENCY Hz
i10
100
9O
7O
!o
so
~o
................................................ ~ ~ '~176 ~1
............... ~.~ ............................ ..- 901- ..................... .~,~- ..................... '""rt
. . . . . . . . . . . . . :.:-- ;,~:~; ..............
,0 IIIII1]II.III:HIJ
9 N ,ot:lIll!llllllIlll
,-: r ,d r ,-: r ,d r
FREQUENCY Hz FREQUENCY Hz
Figure 14.18 Inlet and outlet sound power differences for a 315 mm mixed flow fan at 2850 rev/min and max efficiency (0.53 to 0.54 m3/s)
14.5 Acoustic impedance effects
An alternative and/or parallel explanation for some of the differ-
ences in sound level which have been noted, is the acoustic im-
pedance of the ductwork configuration. Until recently, there
were severe practical difficulties in making impedance mea-
surements but these have been reduced with recent advances
in digital frequency analysis and correlation techniques.
Whereas it was previously necessary to investigate the stand-
ing wave patterns by a microphone traverse along the duct for
each discrete frequency of interest, it is now possible to use
phase-matched condenser microphones for simultaneous
measurement of sound pressure levels at a known separation.
The signals may then be processed through a Fast Fourier
Transform (FFT) twin channel frequency analyzer to derive im-
pedances from the cross-spectral density function (see Bibliog-
raphy, Section 14.15)or by a transfer function method.
The specific acoustic impedance i may be defined as the ratio
of acoustic pressure p to acoustic particle velocity u and in air is
equal to pC.
In a duct, however, this is not a particularly helpful concept and
the acoustic impedance l is used, defined as the ratio of acous-
tic pressure p to the acoustic volume velocity q.
With plane wave propagation along a duct of cross-sectional
area A and with no reflected waves, then
I= p= p --i Equ14.24
q Au A
Where reflected waves are present, the pressure and volume
velocities are the sum of incident and reflected pressures and
the difference between forward and reflected velocities respec-
tively so that the ratio of p is generally complex. Knowing the
u
impedance at a point together with either the acoustic pressure
or volume velocity, it is possible to calculate the unknown pa-
rameters.
Whilst the main applications of these acoustic impedance con-
cepts have been in reactive silencer design, an impedance
model of a ducted fan as been given by Baade where it is con-
sidered as a dipole source of noise with internal impedance IF.
Acoustic loads of impedance IL~and ILoare coupled to the end
of straight inlet and outlet ducting respectively. Acoustic imped-
ances seen by the fan impeller are li and Io. The volume veloci-
ties qi and qo are equal in magnitude but of opposite sign and
are related to the dipole source strength by equation:
FANS & VENTILATION 229](https://image.slidesharecdn.com/fans-220730192231-85fdb985/85/Fans-pdf-262-320.jpg)
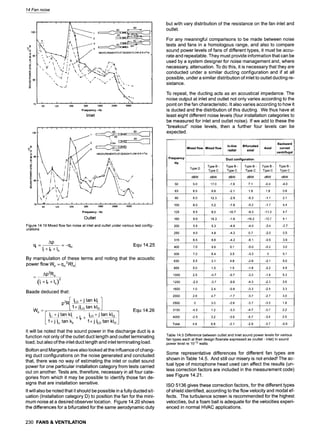
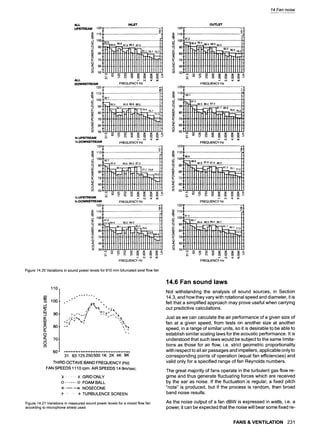
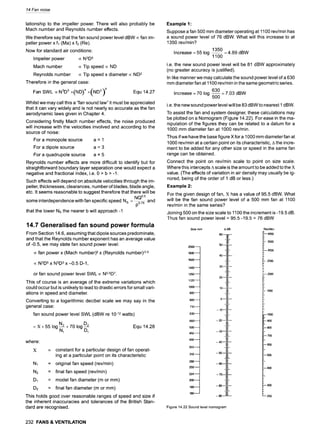
![In reverse manner, knowing the sound power level of a particu-
lar fan at a particular speed, we can calculate X.
Example 3:
A 710 mm fan at 1800 rev/min has a sound power level of 99
dBW.
Increment A = +3.5 dB
.. X + A = 99 dBW or X = 95.5 dBW.
14.8 Disturbed flow conditions
To achieve catalogue performance in respect of flowrate and
developed pressure, it is essential that the velocity profile of the
air presented to the fan is fully developed, symmetrical and free
from swirl. It is also essential to have a sufficiently straight duct
on the discharge to permit the recovery of velocity pressure and
its conversion into useful static pressure.
Similar considerations are also applicable to any noise ratings.
One of the main noise sources has been observed to be due to
turbulence and non-uniform inflow. Figure 14.23 shows outlet
sound spectra for a specific fan fitted with different bends at
varying distances from its inlet. Objects downstream of a fan
will affect the noise generated by causing a non-uniform flow.
This will in turn result in non-steady loading of the blades. The
effect, however, is usually less severe than that for obstructions
upstream.
~,o
~90
o
LL
7(]
+.
A Radiusbend at412m
a Mitred bend at 8.2m
63 125 250 5001000200040008000
Octave band frequency - Hz Overall
e (63-8000)
Figure14.23Effectof upstreambendon axialfan noiseat outlet
14.9 Variation in sound power with
flowrate
At a constant fan speed, the sound power generated will be de-
pendent on the system resistance against which the fan has to
operate. It is, therefore, of importance to ensure that this has
been correctly calculated.
The change in noise at constant fan speed for some typical de-
signs was shown in Figure 14.17. Differences up to 15 dB are
common and will occur quite sharply if the characteristic con-
tains a marked stall point.
In recent years, variable air volume systems have become of
great importance and are recognised as an energy efficient so-
lution to the whole question of air conditioning. It is rare for a
building to continuously require the design flowrate determined
by temperature, occupancy, solar heat gain, relative humidity or
other criteria. Some percentage of the maximum flowrate must,
therefore, be delivered by the fan.
A distribution curve (Figure 14.24) can be constructed and this
indicates the percentage running time against percentage flow.
14 Fan noise
LU 15
t.-
(.9
Z
W
0
j 5
t--
~ 0
I. L.....
, I,
i ,
l[ II,
20 40 : 60 80 100
% DESIGNFLOWRATE
Figure14.24Typicalfan operatingloadprofile
How this affects the noise produced, depends on the method
used.
a) Simple damper control: in this case the fan simply works
along its characteristic. Noise will generally increase ac-
cording to fan design as previously stated.
b) Speed control: noise may be expected to reduce with de-
creasing fan speed according to the relationship
PWL 2 -PWL 1= 10a log N2
log N1
where:
Note:
= exponent between 3.5 and 7.5 with an average
value of say 5.5.
Because of resonances and phenomena still the sub-
ject of analysis, the variation may not be continuous. It
is also likely to vary at different points along the fan
characteristic.
There can be "peaks" on the graph (see Figure 14.13). It should
also be remembered that this curve does not take account of
motor noise. Where the motor is contained within the fan duct,
as with a typical direct driven axial flow fan, thereduction in
noise may be less. With certain types of inverter control the
electrical waveform may be sufficiently distorted to increase the
motor noise at reduced speed. Figure 14.25 shows the overall
effect.
Caution should still be used when controlling by inverter on
lightweight fans, or where fans are mounted on flimsy struc-
tures and in any installation where the fan is run in an open envi-
ronment. In these situations the torque characteristics suited to
fans should always be utilised, (V ocf2). The fan type will also af-
fect the amount of noise radiated into the system, and if possi-
ble indirect drive should be considered for critical applications.
It is likely that with careful application of damping materials and
the design of fan hardware to suit the problems of general in-
verter drives, a reduction in the resultant noise level could be
ii!
!ii~/
woo-
>
J
~ 90"
0
80,
NOISE LEVELS ARE IN-DUCT OUTLET L~AiN 710ram
DUCTWORK re: 2 • t0 "~N/m2
CENTRIFUGAL FAN
100-
w
>
LJ~
~J
0
A E
~o
..........
F .........~~-~..............~ - ~
AXIAL FLOW FAN
C ~""'f/ A-MAX STARTING TORQUE
- *'/ B -'HIGH' STARTING TORQUE
i/ C- MINS
T
A
R
T
I
N
GT
O
R
Q
U
E
D/" D, GENERATED
StNUSOIDAL SUPPLY
.............
~
..........................
i~=-.................
~T-- ~ ~ -
Figure 14.25Variationin fan noiselevelswithspeedaccordingto motortype
and controlmethod
FANS & VENTILATION 233](https://image.slidesharecdn.com/fans-220730192231-85fdb985/85/Fans-pdf-266-320.jpg)
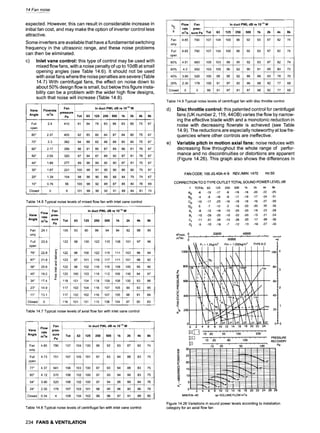
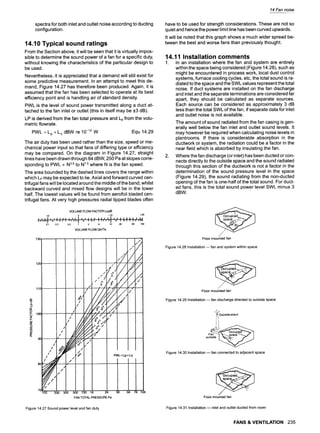
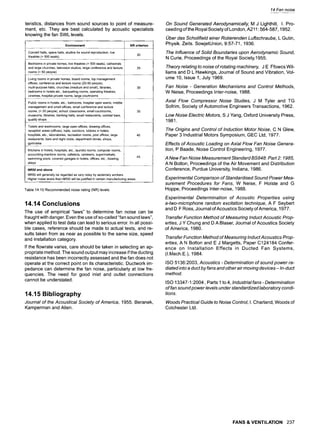
![SCH ENCK
Balancing and beyond - for better products
" Horizontal and Vertical Balancing Machines
for all applications
[] Diagnostic Systems for electric motors
and complete assemblies
[] Contract balancing service and field
balancing at 8 locations throughout Europe
[] Practice oriented training programme
[] Used balancing machines
www.schenck-rotec
Schenck RoTec GmbH
Balancing and Diagnostic Systems
64273 Darmstadt
Tel.:+49 (0) 6151/32-2311
Fax.:+49 (0) 6151/32-2315
eMail: rotec@schenck.net
.corn
238 FANS & VENTILATION](https://image.slidesharecdn.com/fans-220730192231-85fdb985/85/Fans-pdf-271-320.jpg)
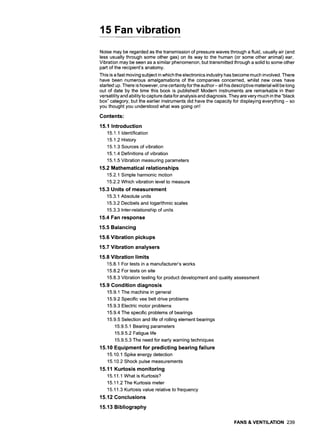

![15 Fan vibration
Iocity (or circular frequency) cois equal to 2~f where f is the fre-
2~N
quency in Hertz, or for balance problems where N
60
equals r/min.
The other properties are also sine waves, the velocity "v" hav-
ing a 90~ phase lead (one quarter or a cycle with respect to
time) whilst acceleration "a" is advanced by half a cycle i.e. a
180~ phase lead. This is shown in the equations below:
Displacement e = epeak sin cot
Velocity v= e0ea,sin/ t+; /
Acceleration a = co2epeakSin(cot+ ~)
These three parameters are illustrated in Figure 15.1 whist Ta-
ble 15.1 gives their values with respect to epeak.
1.
2 4
3
/B
/
0 /,5 90 135 180 225 2?0 ]15 360
Time.......
Eycte Angle
Figure 15.1 Sinusoidal vibration
Point in cycle
No. Radians Degrees
1 0 0
2 0.25~ 45
3 0.5~ 90
4 0.75~ 135
5 ~ 180
6 1.25~ 225
7 1.5~ 270
8 1.75~ 315
9 2~ 360
Dis-
placement
1.71 x epeak
epeak
0.71 x epeak
0
-0.71 x epeak
-epeak
-0.71 x epeak
0
Velocity
03epeak
0.71 x 03epeak
0
-0.71 x 03epeak
-03epeak
-0.71 x 03epeak
0
0.71 x 03epeak
03epeak
Acceleration
-0.71 x 0)2 eoeak
_032epeak
-0.71 x 032 epeak
0
032 epeak
-0.71 x 032 epeak
-0.71 x 032 eoeak
0
Table 15.1 Values of parameters expressed as function of peak displacement
15.2.2 Which vibration level to measure
It will be seen that all these quantities vary with time. For analyt-
ical purposes it is desirable to reduce them to single figures and
those for displacement are shown in Figure 15.2.
. . . . i
TAverage RMS
t~Level Level
Peak-toLl / Time ~......
Peak / /
Level
Sinusoidal wave
, .Peak Level Average
.......
t .... t.. Level
Peak-to-Peak Level
Complex wave
Figure 15.2 Relationship between various vibration levels
The peak-to-peak value indicates the total excursion of the
wave and is useful in calculating maximum stress values or de-
termining mechanical clearances.
The root-mean-square value is probably the most important
measure because it takes account of the cycle time and gives
an amplitude value which is directly related to the energy con-
tent and therefore the destructive capabilities of the vibration.
For sine wave vibrations e.g. out of balance erms X ~ = epeak.
Peak and average values may also be calculated but have a
limited value.
1 i e2(t)dt
em0
liedt
eav =m0
Velocities and accelerations are given in similar terms and the
root-mean-square velocity is especially important as it is used
in ISO 2954-1975 as the measure of vibration severity in the
range 600 to 12000 r/min (10 to 200 Hz).
Again for a sinusoidal vibration:
Vmas X~/2 = Vpeak
It must be emphasized that the relationships connecting
root-mean-square and peak values only apply to sine waves.
Vibrations arising from certain other sources e.g. rough rolling
element bearings or air turbulence may not follow this form.
Consequently the equivalents in Table 15.1 will not hold and the
acceleration values especially may be much higher.
Where sine wave conditions do exist, by taking time-average
measurements the effects of phase may be ignored and:
a v P
Displacement e . . . . . / vdt
4~2f 2 2~f =I
a
Velocity v = -- = j"adt
2=f
Acceleration a = 2=fv
FANS & VENTILATION 241](https://image.slidesharecdn.com/fans-220730192231-85fdb985/85/Fans-pdf-274-320.jpg)
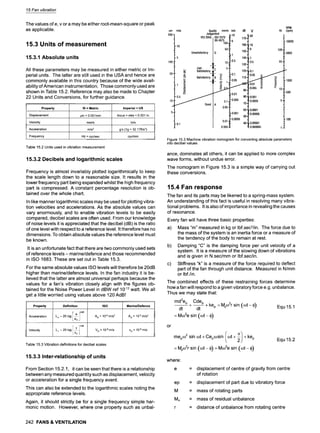
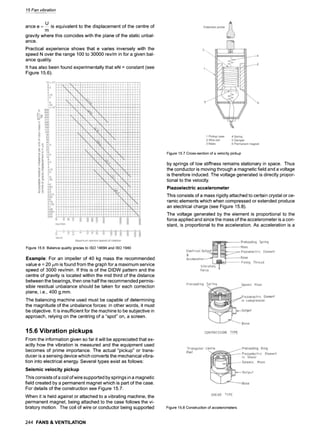
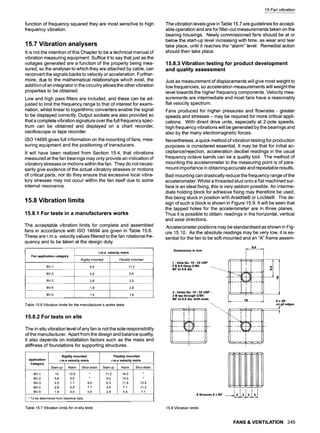
![15 Fan vibration
| 2 r
-:................
........... . .(~2
| Ductflange - Motorend
~2 Ductflange - Motorend
| Supportbracket
@2Fan case- Inletflange
Figure 15.10Accelerometerpositionfor slingtesting
bly with rubber cords and nylon slings in accordance with ISO
14695 should be used as shown in Figure 15.11 and Figure
15.12. Whilst not absolute in its accuracy, it would enable con-
sistent readings to be taken and comparability to be
established. The low natural frequency of the ropes ensures
that the fan is completely isolated from any outside influences.
The first 20 fans of a given type should be tested and readings
taken at the prescribed accelerometer positions. All these fans
have to be assessed as satisfactory according to the normal
subjective inspection then current. In this case the acceptance
level AdB in each octave band may be set at 85% pass i.e. the
acceptance level is set at the fourth highest reading obtained
for all units in all directions. It must be appreciated that these
levels will be unique to a particular design of fan at a particular
speed. Those for some typical small machines are shown in
Table 15.8.
Readings must be taken in all three directions and be within the
acceptance level set down. No differentiation is made between
horizontal, vertical or axial measurements. Such acceptance
levels are constantly under review. Each fan should be logged
and trends noted. The intention should be to gradually reduce
the acceptance levels.
Recent improvements in balancing procedures (compound
Figure15.12Vibrationteston 34" axialflowfan
2-pole speeds, < Hz for all others, can be significantly reduced.
For large Category 2 and 3 fans about 1250 mm diameter, it is
Fan size mm Speed Power
and type rlmin kW
180Axial 3500 0.3
800Axial 1180 22.5
315
Centrifugal
3500 1.5
900
Centrifugal
1180 10.0 91
AdB re 10 s mls z in each Octave band Hz
<45 63
79 86
82 91
86 97
125 250 500 lk 2k 4k >5.6k
90 102 102 117 108 107 104
98 109 113 111 110 108 98
102 105 109 111 109 111 112
95 100 98 98 104 103 96 91
balancing of fan impeller and motor rotor/shaft to quality grade Table 15.8 Typicalvibrationacceptancestandardsfor smallCategory3 or
G 1) has indicated that levels in the appropriate band - 63 Hz for marinefans
R
U
B
B
E
RC
O
R
D
S I
i'Zi ,
,
,
~
L
~
S
;
C
O
R
O
......
IL",,I~L,,S 1
F
O
R.~IO%I~XT~NSk~.ti
~-~%s ! ._ 3
~
-
0
" ..,
',~, 30 I zz-38 1 [1 f.~LINDAPTOR"
S.ACK~E | / i ! ~ RsJ ! i
3,~, ~,S I 3~ 55 I ,zalll=~-.
-~'~ CLAMPOR SIMILAR ~ ~ ....:-~-;::'". ~-" "~
,, ,o I ~ I , y- y !
j% r,'~' I ~- 2,~o 'i .'}"I'I ~ ,~ T ~ Jr I
~
w ~ S
T
A
N
D
A
R
DP
A
T
T ~ - ~ 12 ~FB ~
J " ~ '
" "
~
" : " "" !
,~" ~l THIMBLES ~" x ~ " .~. ............. " i LG
l ~'"'-]R ~ ~ ~ ~ / ll;i 2- IN No.NYLON ROPES ~" ~ "'~ ....... ""'~~ ~I ~ ~ ii~i~ ~I
.
~
o ! ~ ~ ~ '! i ,..~ ! ~L,.- 11~II T
H
I
M
B
L
E
SF
O
RS
L
I
N
G
I
N
(
~ ~ , ~, ~.~-,,DIAR
D
.B
A
R
.........~ ! t i ] ~ ~]
/",, i ,/X"": / i !};|.,1 B l
........ 1310LBS AXIAL
FF:N
581LB
SC
E
N
T
R
I
F
U
G
A
LF
A
N
Figure 15.11Assemblyfor vibrationtestingof axialand centrifugalfans
246 FANS & VENTILATION](https://image.slidesharecdn.com/fans-220730192231-85fdb985/85/Fans-pdf-279-320.jpg)
![15 Fan vibration
impractical to suspend the unit due to the weight and physical
dimensions involved.
Furthermore, it is desirable to obtain as much information as
possible, with a view to determining the source of all vibrations.
Such fans therefore should be bolted down on a rigid founda-
tion block. Complete discrete frequency analyses of displace-
ment, velocity and acceleration should be taken at each fan
bearing together with motor bearings where applicable. It may
also be necessary to take readings at other particular points of
interest e.g. shaft seals, fan feet etc.
To enable objective assessments to be finalized and for accep-
tance standards to be set, a manufacturer will need to make
routine tests. The combinations of fan size, speed, blade form,
duty, specific width etc., lead to many permutations. Repeat-
able tests will take a long time. Nevertheless the velocity stan-
dards set in Table 15.5 can be followed and fans must meet
these before despatch.
15.9 Condition diagnosis
Units which fail to meet acceptable criteria should be given a
complete frequency analysis. This applies to all weights and
speeds of machine. Again readings should be taken at the vari-
ous positions. A typical frequency analysis is shown in Figure
15.13.
So far we have discussed vibration in a general sense and indi-
cated permissible overall limits. For important and/or arduous
applications however, we need to be able to identify the causes
of vibration and their likely effects on the machine which could
be catastrophic in the event of a total breakdown.
The keys to the identification of the cause of a vibration are in its
magnitude and frequency over most of the spectrum. Below
about 10Hz displacement will be of primary importance, whilst
above about l kHz, acceleration is paramount. Over the re-
mainder of the range, velocity measurements will be sufficient.
Different causes of vibration occur at different frequencies. For
example, a faulty ball bearing would cause high frequency vi-
bration at many times the rotational frequency whilst unbalance
or misalignment produce vibration at the rotating speed fre-
quency. To rely on an overall or linear response reading of vi-
bration velocity could lead one to ignore a developing problem.
To obtain the installation's "vibration signature", a pick-up is
used, which can either be handheld or more rigidly attached,
feeding a meter giving a visual display. For analysis some type
of tunable frequency analyser is necessary together with a stro-
boscopic light. The strobe permits rapid tuning to rotational
speed when it "views" the rotating element and apparently sees
a stationary image. From the analyser an X-Y recorder can be
fed to show the magnitude of the vibration in narrow frequency
bands right across the spectrum which the analyser can iden-
tify. By fixing the probe in either the vertical, horizontal or axial
modes, different traces can be obtained which will inform the
operator as to possible sources of vibration. Any "peaks" in the
reading at specified frequencies will indicate the onset of cer-
tain troubles.
It is to these discrete frequencies we now look. Remember vi-
bration severity is a quality judgement whilst frequency will indi-
cate the cause. An increase in the severity of a particular fre-
quency during inspection, commissioning or operation may
indicate the onset of a particular problem. By referring to the ini-
tial signature and specifying that the particular frequency level
should not increase by more than a predetermined amount, it is
possible to construct planned maintenance procedures.
In the comments which follow fl, is defined as rotational fre-
quency and equals (rev/min - 60) Hz.
15.9.1 The machine in general
Unbalance As the heavy spot would give a "pulse" to the
pick-up once every revolution, unbalance will be identified by
ImIIIIIi'I
FAN VIBRATION SIGNATURE
II 1 I I l~rI
I I I I I I I I I I
mill mmmimmmmmmmmmmmimmi iimmnmmmmmmmmmmmmmmmmiiimmmmmimmmmii IImmmmmmmmI IImII
Immm immmmmmmmImmmmimmmmimmmmImlimmmmimimmimmmmmmmlmimmimlimmmmmimmmmimmmI ImmIl
IIIIIIIIIIIIIIIIIIIIIIIIIIIIIIIIIIIIIIIIIIIIIiIIIIIIIiiIIIImiiI:IiIIIIIIIIiiIII
IImnnmIIIIIIIIFl~l- r 171iiiimmiiiimiIiiIIiiimiiimIimmiiiiiiIiIiiiiiiiiiiiIiiIIiiii
Iimmmmmmmmmmmi i I I[.ITTIIIIIIIIIIIIIIIIIIIIIIIIIIIIIIIIIIIIIIIIIIIIIIIIIIIIIIIIII
iiimimiiiiiiiiiiIii iiiimiiiimiimiiiiiiiiIimmmiimmiiiiimmlmiiiiiiiiiiiiiiimmiil
IIIIIIIIIIIIIIIIIII~IIIIIIIIIIIIIIIIIIIIIIIIIIIIIIIIIIIIIIIIIIIIIIIIIIIIIIIIIIII
~IIIIIIIIIIIIIIIII~I~II 9
IIIII 9
~IIIIIIIIIIIIIIIIIIn~IIIIIIII~II~IIIII~I!I~IIII~IIIIIIIIIII~II~IIIIIIIIIIIIIIIIII
•I 9149149
iinmnmiIiiimmiiimtammil immmmiI~, imiIiiIIiitliiiiiiiIil IIIIIIIIIIIIIIIIIIIIIIIIIIIII
iiiimiiiIIimiiiiIiiii~iiiiii ~ IiIIIIII~IILIImm~mmIIt~ IIIIIIIIIIIIIIIIIIIIIIIIIIIIl
II ummmIIIIIiIII~IIUII~Z~II~I~mImIIm~IIIMII~mmmI~ II~iimmm'IIIiImIImiIIiIIiiIIiIiIIIIIl
.'--_--~m--_
I ' I - ~ - ' m ~ - - - - ~ I ~ ~ I I ~ I I I - m m I I m ~ m m ~ m I ~ ~ ~ I ~ I I I ~ ~ I I ~ I ~ k I I I I ' - ~ - I I ~ :
IIIIIIIIIIIIIII[]IIIIIIII 9
IIIIIIIIIIIIIIIIIIIIIIIIIIIIIIIIII~IIIIIIIIIiiIIIiIiIIIIIIIIIIIIIIIIIIIIIIIII
IIIIIIIIIIIIIIIIIIIIIIIIIIIIIIIIIIIIIIIIIIIIIIIIIIIIIIIIIIIIIIIIIIIIIIIIIIIIII
IIIIIIIIIIIIIIIIIIIIIIIIIIIIIIIIIIIIIIIIIIIIIIIIIIIIIIIIIIIIIIIIIIIIIIIIIIIIII
IIIIIIIIIIIIIIIIIIIIIIIIIIIIII 9
I[]IIIIIIIIIIIIIIIIIIIIIIIIIiIiIIiiIIiIiIIIIIIIIIIIIIIIIIIIIIIIIIIIIIIIiiIIiIIl
IIIIIIIIIIIIIIIIIIIII IIIIIIIIIIIIIIII IIIIIIIIIiIiIIIIIIIIiIIIIiiIiiIIIIiIIiIII
IIIIIIIIIIiIIIIIIIIIIIIIII IIIIIIIIIII IIIIIIIIIIIIIIIIIIIIIIIIIIIIIIIIIIIIIIIII
IIIIIIIIIIIIIIIIIIIIIIIIIIIIIIIIIIIIIIIIIIIIIIIIIIIIIIIIIIIIiIIIIIIIIIIIIIIIII
IIIIIIIIIIiIIIIIIIIIIIIIII IiIIIIiIIIiiIiiIIIIIIIIIiIIIIIIIIIIIIIIIIIIIIIIIIIII
IIIIIIIIIIIIIIIIIIIIIIIIIIIIIIIIIIIII IIIIIIIIIIIIIIIIiIIIIIIIIIIIIIIIIIIIIIIII
IIII IIIiIIIIIIIIIIIIIIIIIIIIIIIIIIIII IIIIIIIIIiiIIIIIIIIIIIIIIIiiiIIIIIIIIIIII
IIIIIIIIIIIIIIIIIIIIIIIIIIIIIIIIIIIII
IIIIIIIIIIIIIIIIIII~IIIIIIIIIIIIIIIIII IIIIIIIIIIIIIIIIIIIIIIIIIiIIIIIIIIIIIIIII
i l l I l i l l i g i l l i I B H H g l I D I g U i D i I i l g l e l i m B i i B l I ! i i l i i l l l l B i m l l n i l l i I i I i l l l i l i l l i l l l l
= ~- i i i i i l i i i l i l l n l g i l l l , l l n l l i g l g a l U l i n i R i i i l l l i i i g g l i i l i l l ! l l l i i i i i l n i i l l l U a I i l n i i
= mmlm mmm i m mmm imm mImmmmm mi
> ~ mmi mmmmmnmmmmmmimmmimm)mmi 82 m mimnnmi,iimmiiimim m , ) i .I_I!LB~ I
I I
? ! ' i ) i i . i, i .~ !:i:i~ i i:3~:i
I
i : :i . i ~ " i I !1 " ] - ! " '.
~ I ~ i, : " - i .... :iil . :: . )_i)! . . . . i- .....i......
~-!--~-~
7. ~ " i i i ~ i i . . . . " ...............
i
..............
__. ....
~: i::i-:i.::
.....
j ....
. , '~ ,~. 'r: "1
500 6 8 !K 2K 3K 4K 5K 6 8 10K 20K 30K 40K 50K 6 8 100K 2O0K 300K 400K 500K
i MACHINE ,~L5 0 /~../7 [ ............ I~VEL I--I ACCEL r~N/C I M.......... tC~l~JV EN~ ) ~'~At~/A/~
I
| MACHINELOCATION C Z / -- -- f
/AMPLiTIJOE~
iDATASHEETNO
[' "~uPP~176176 ........ ~ I
Figure15.13Typicalvibrationsignatureforfanfittedwith2-pole440volt3-phase60 HzACmotorandrunningat 3550rev/min
FANS & VENTILATION 247](https://image.slidesharecdn.com/fans-220730192231-85fdb985/85/Fans-pdf-280-320.jpg)
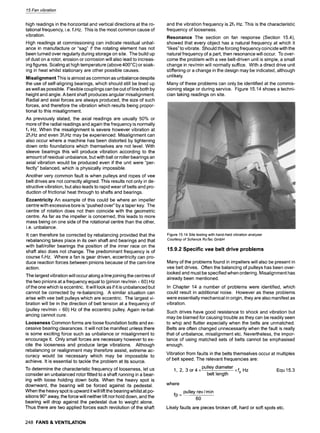
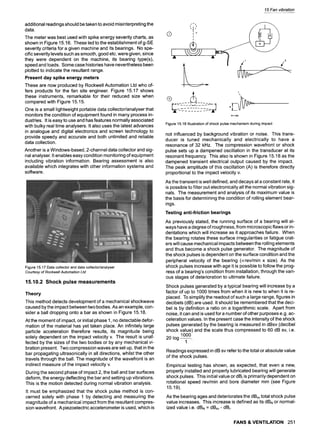
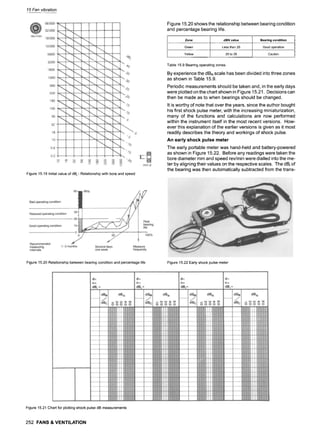
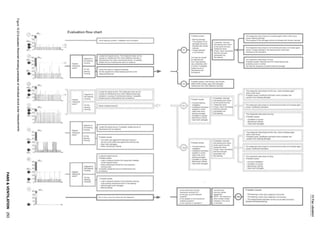
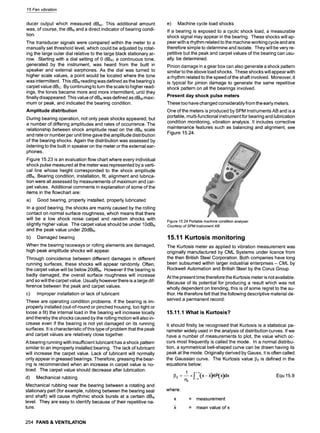
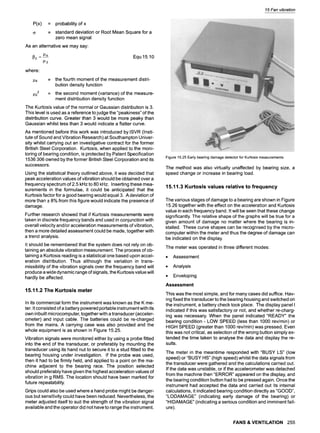
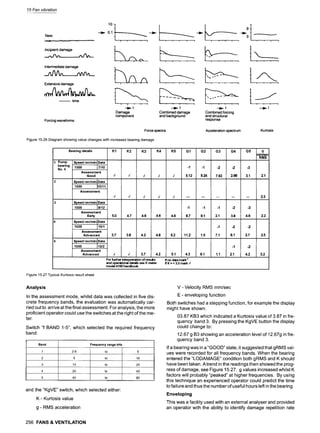

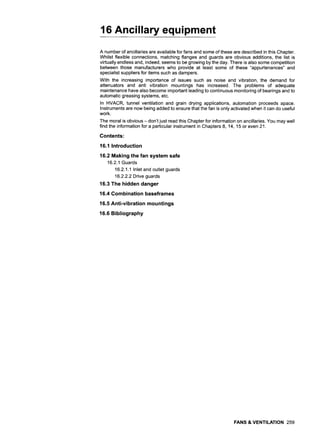
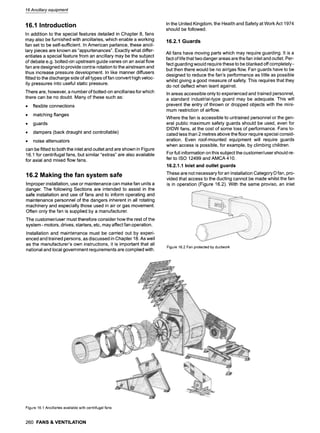
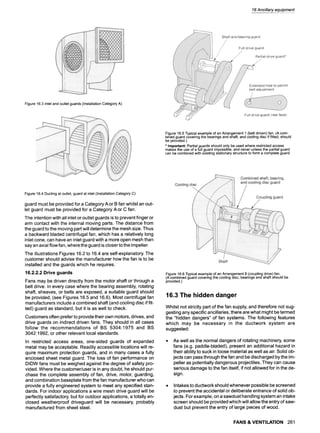


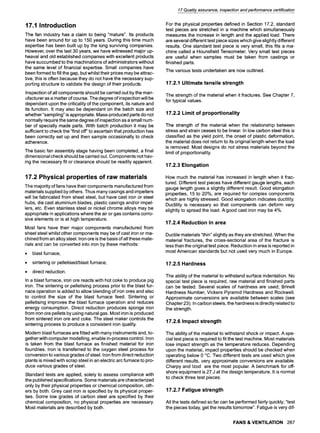
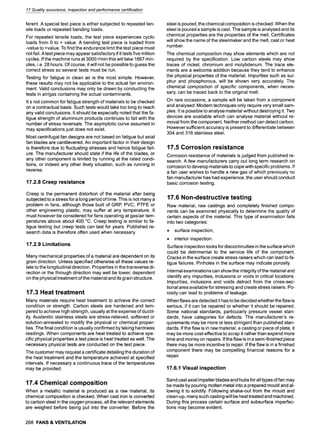
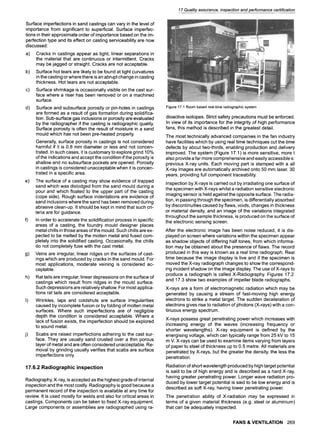
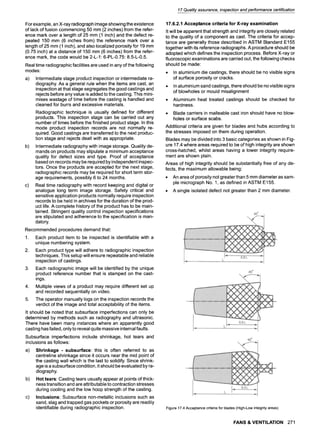
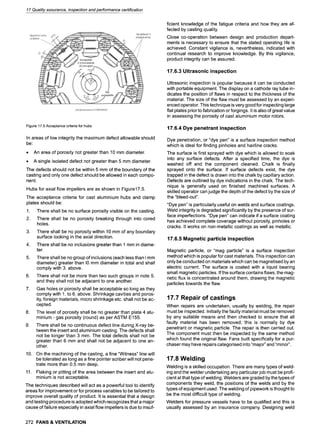
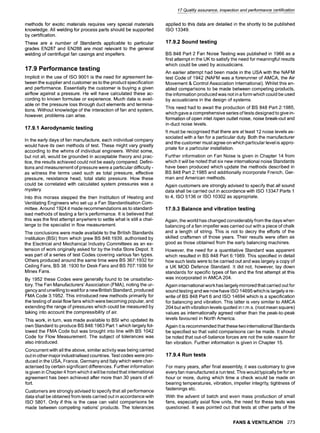
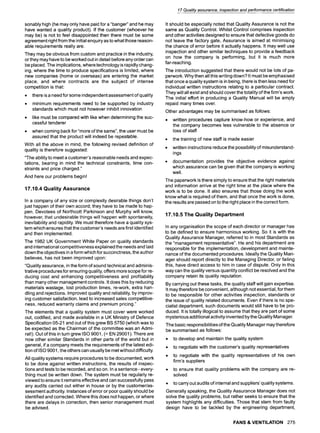
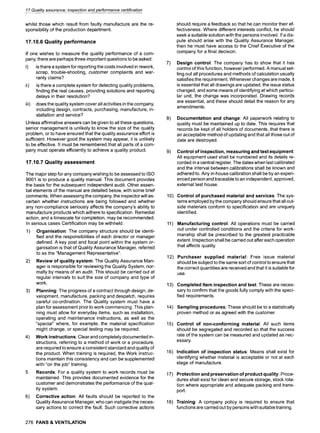
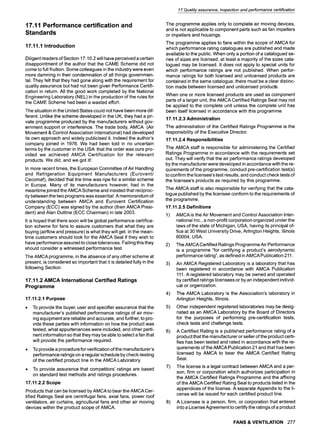
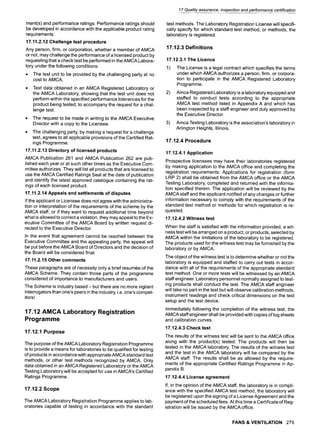


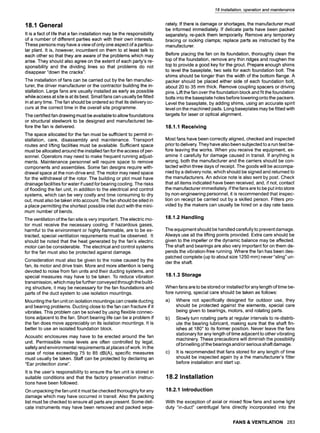
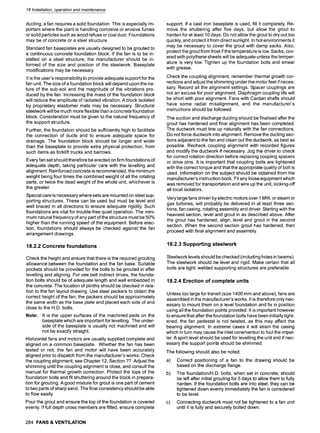
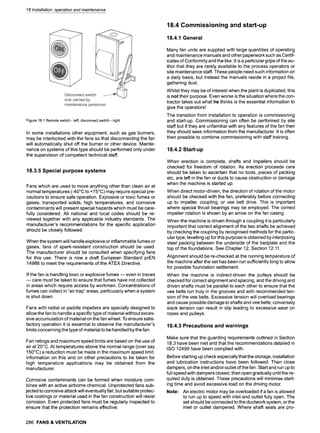
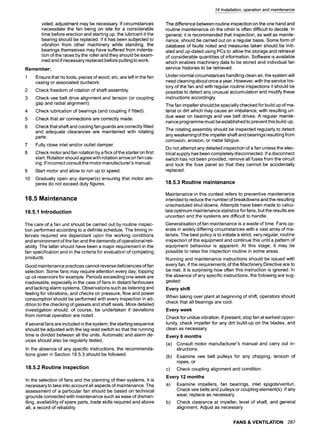
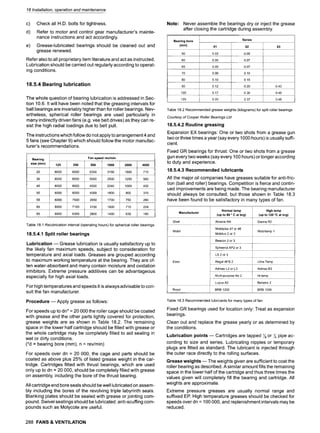
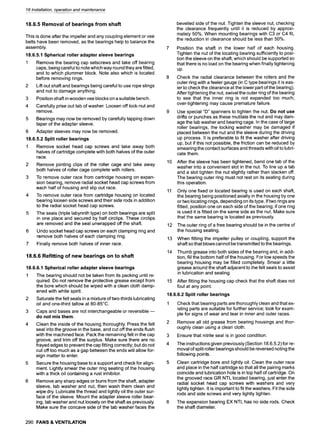
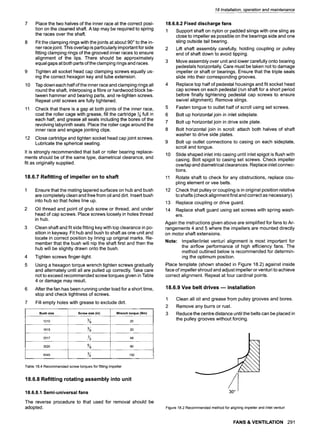
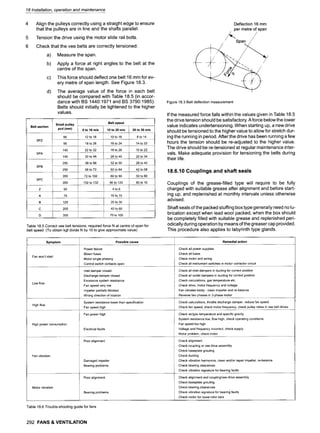

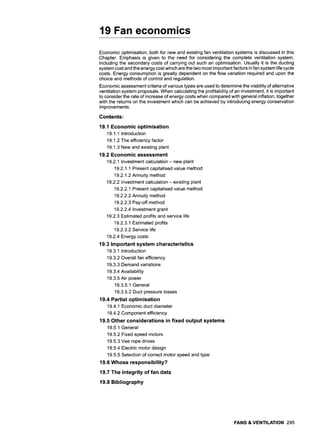
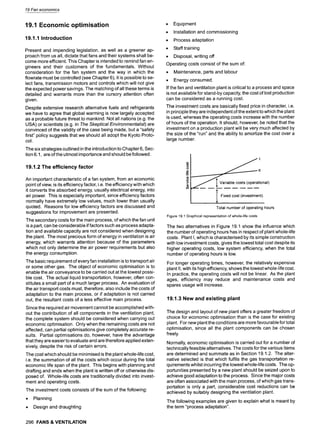
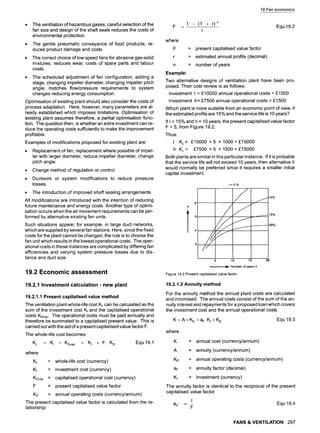
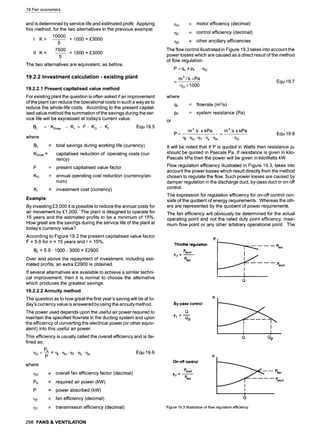
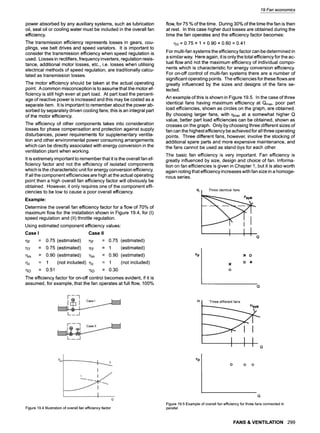
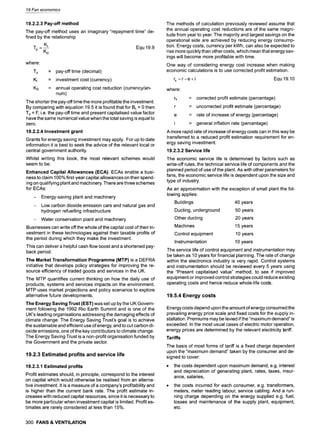
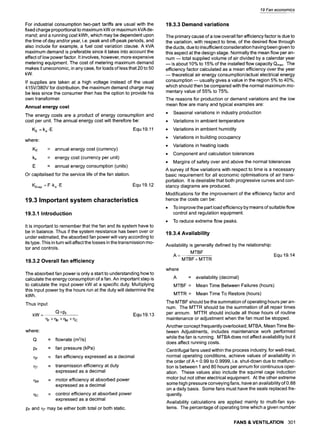
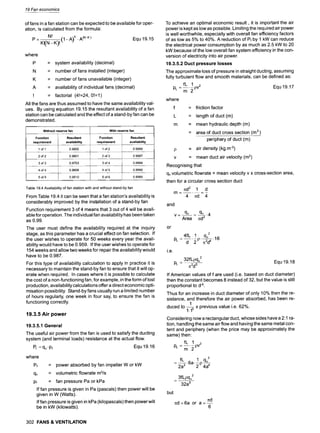
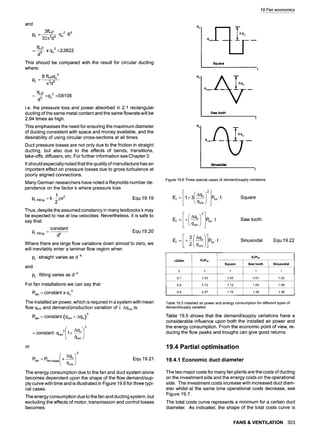
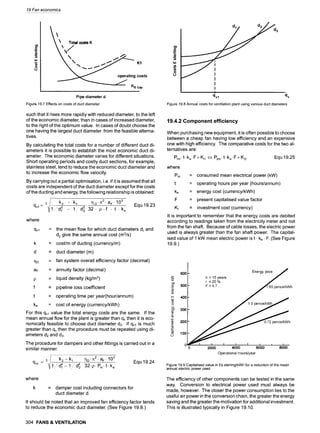
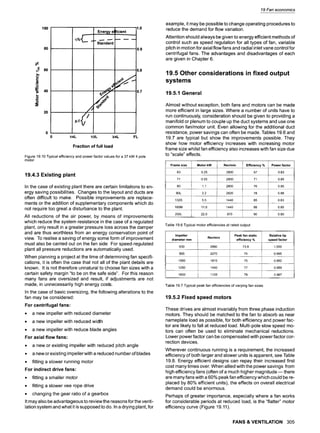
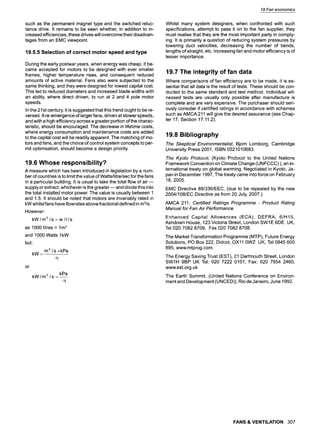

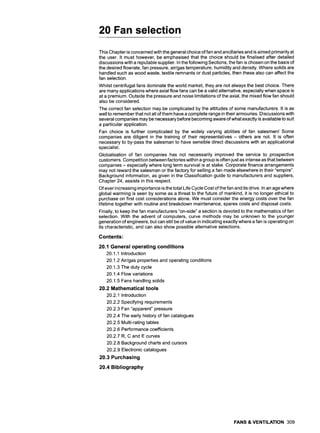
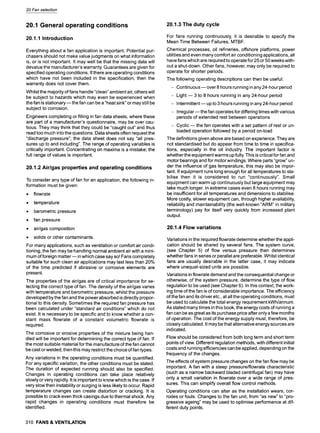
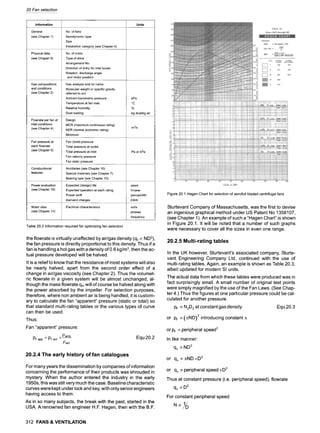
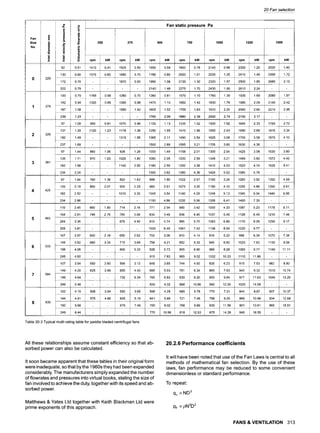
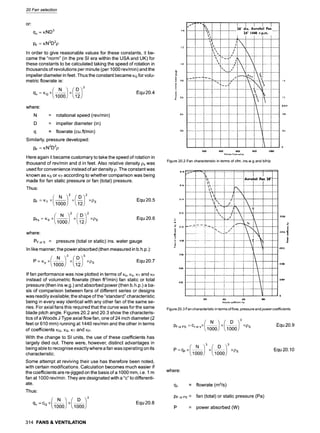
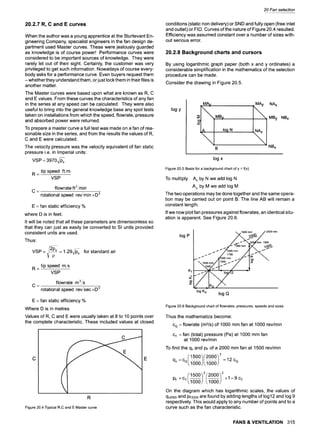
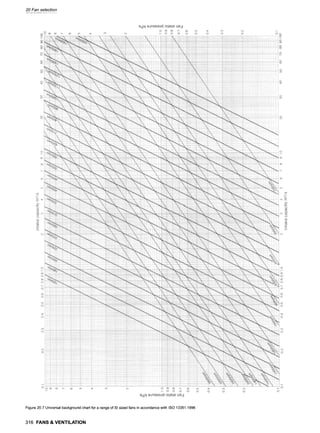
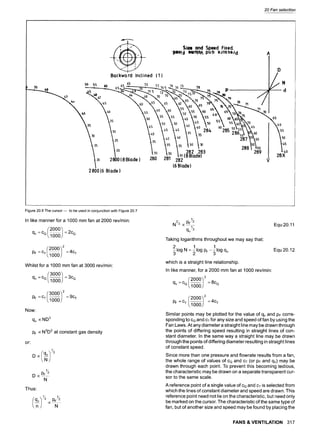
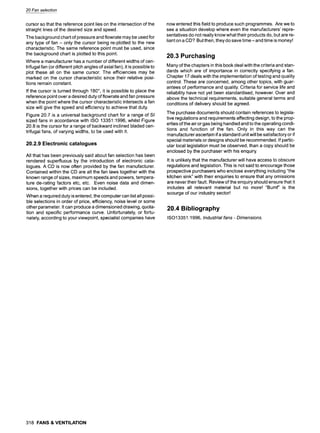
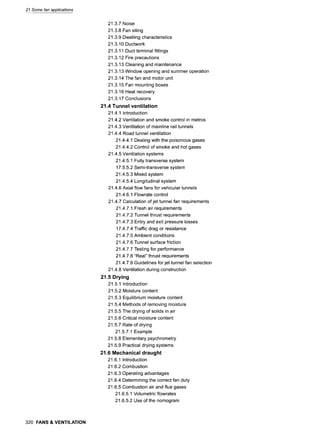
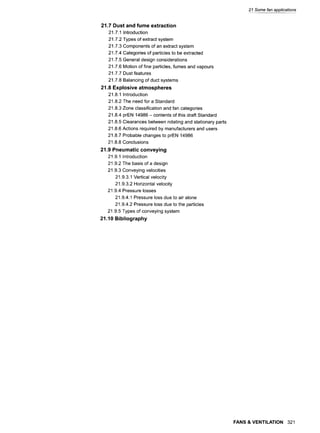
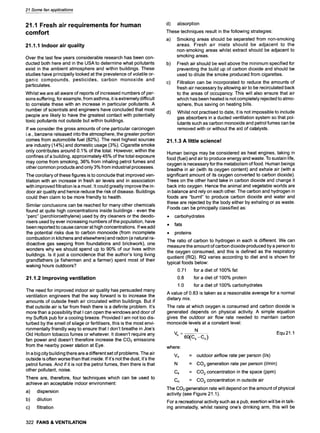
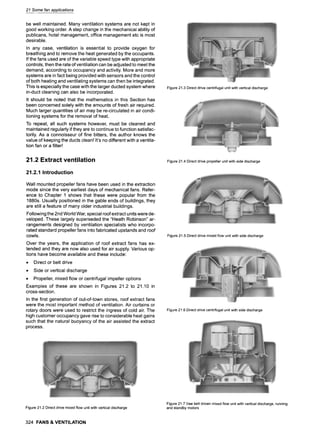
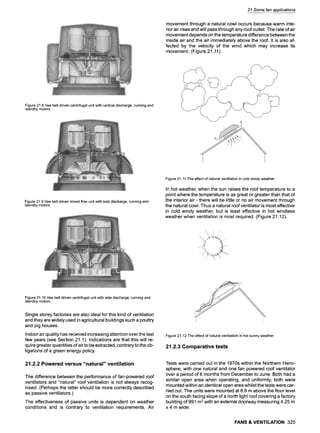
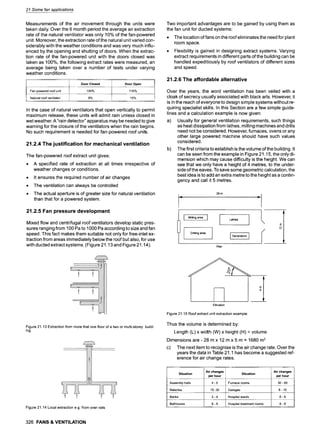
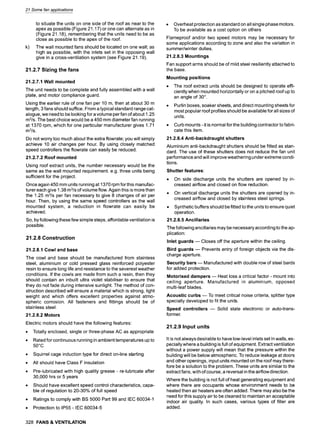
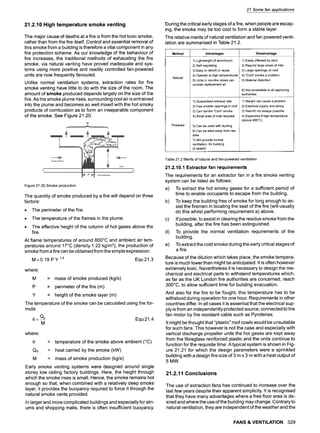
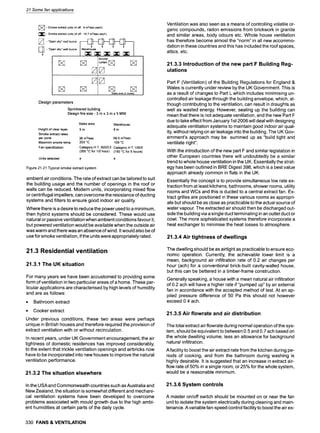
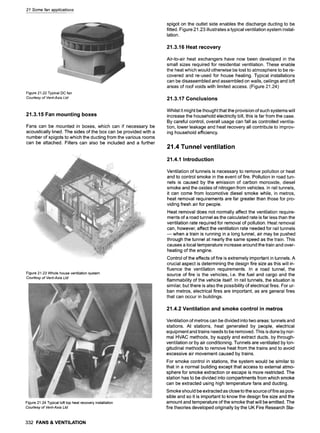
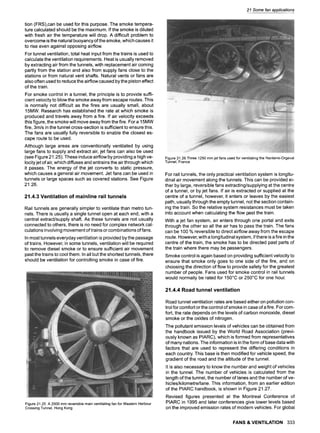
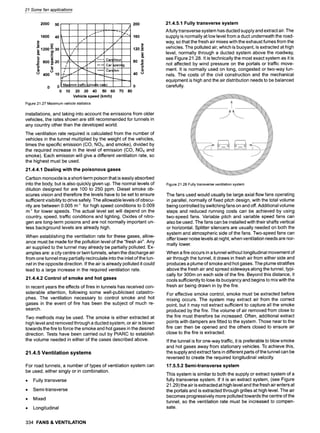
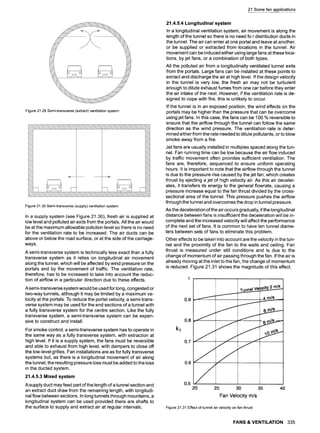
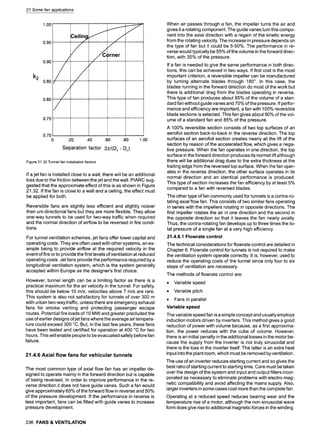
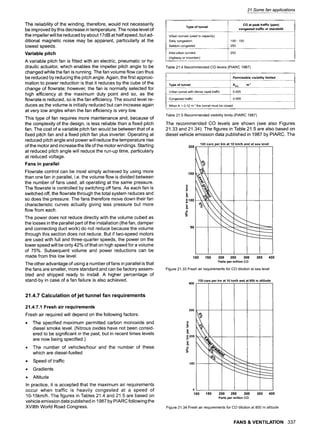
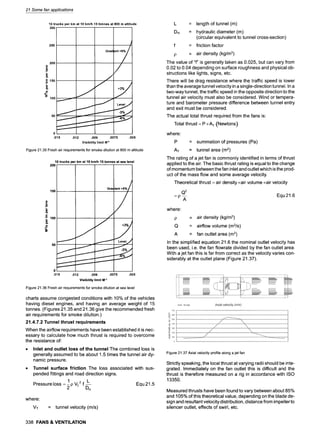
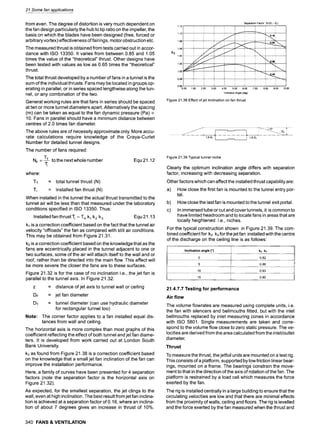
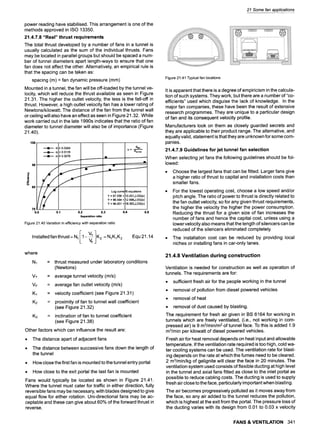
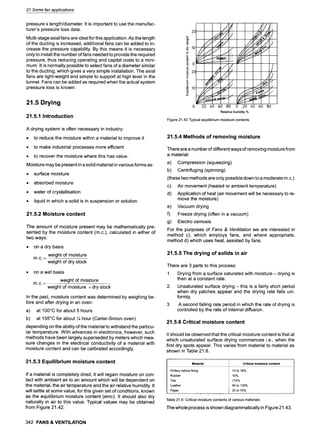
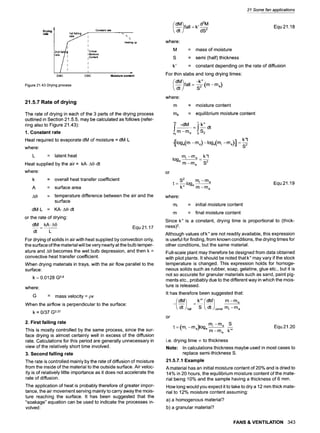
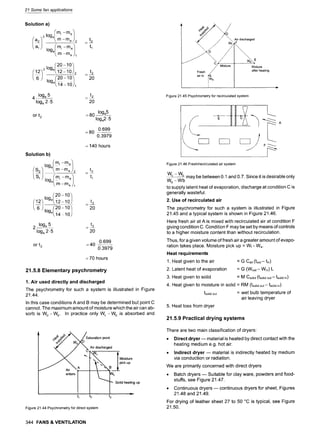
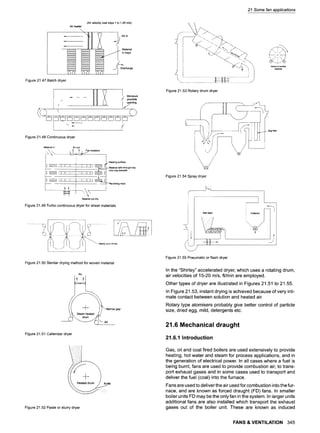
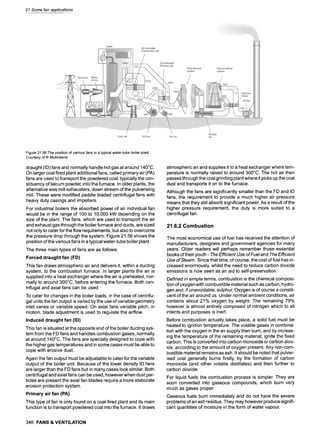
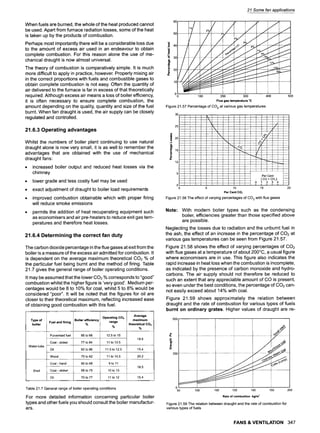
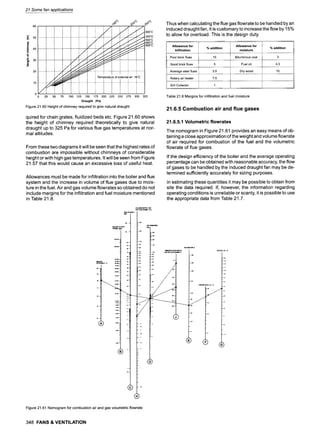
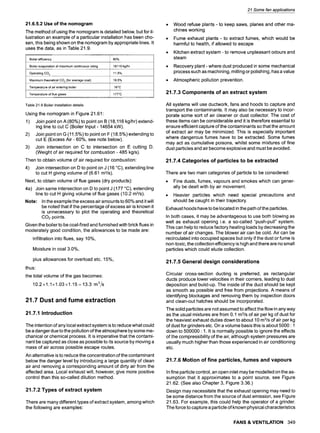
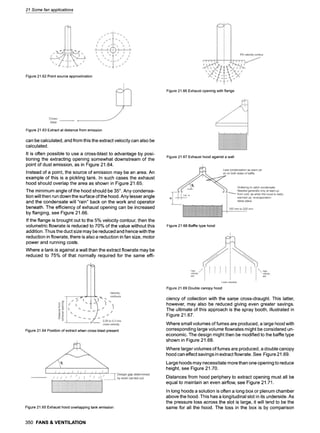
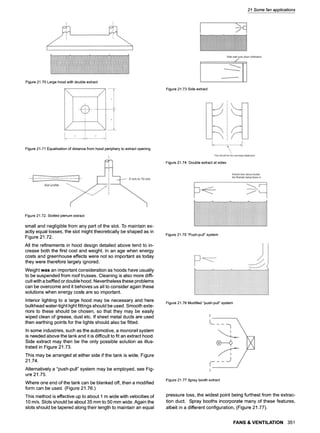
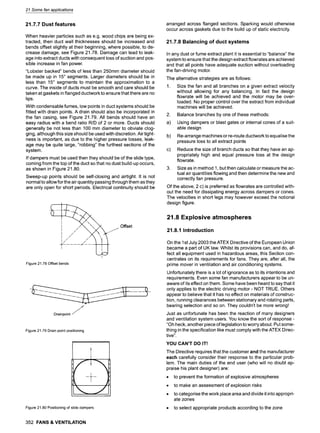
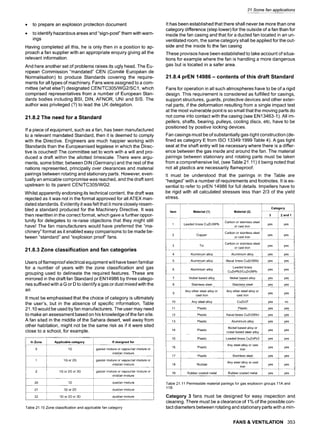
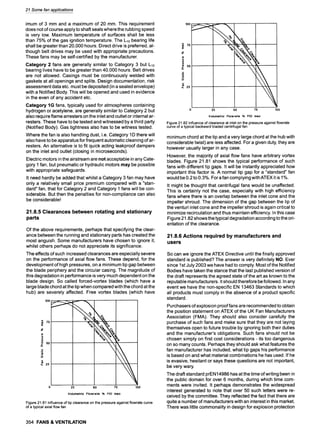
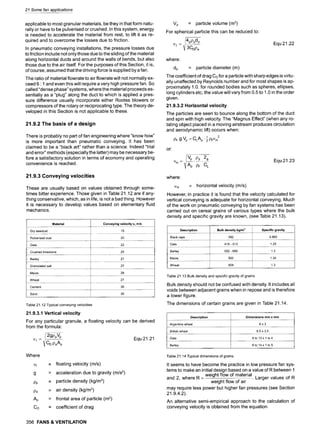
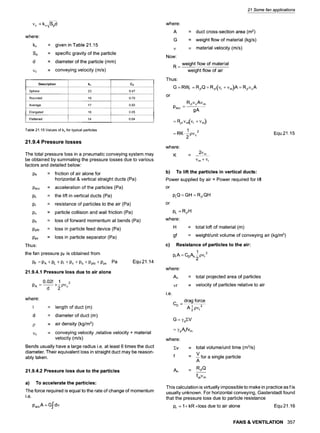
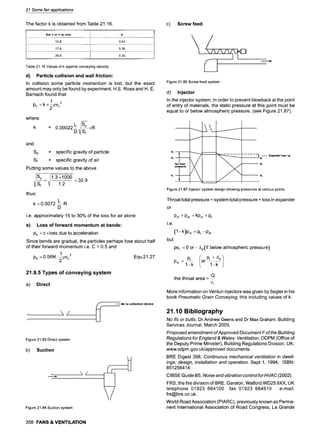

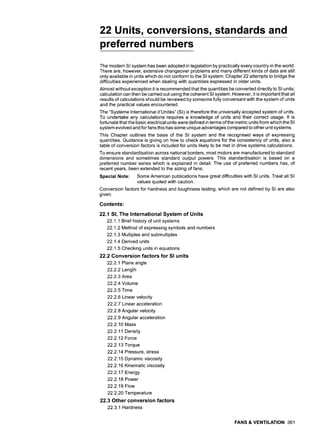

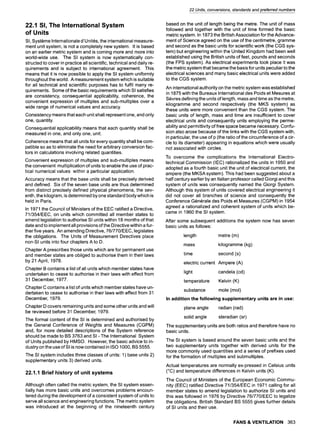
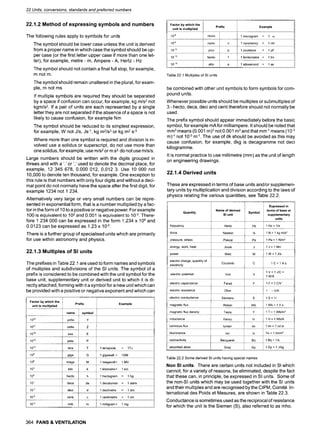
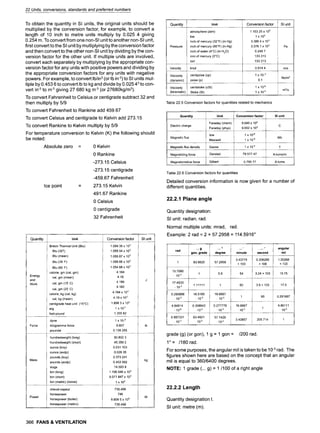
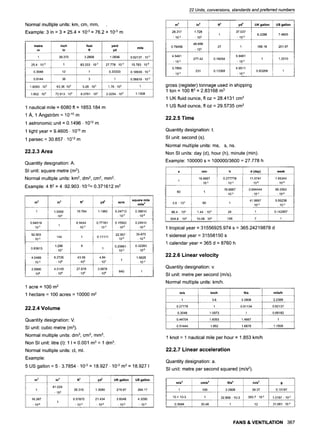
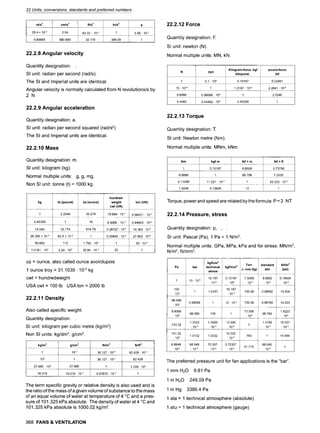
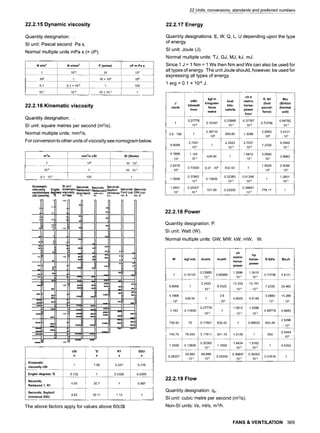
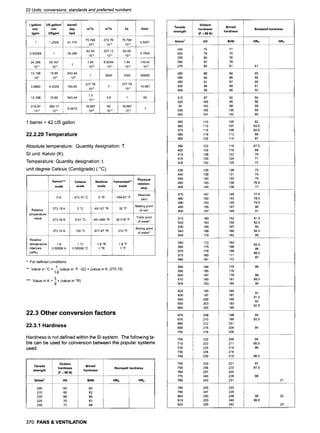
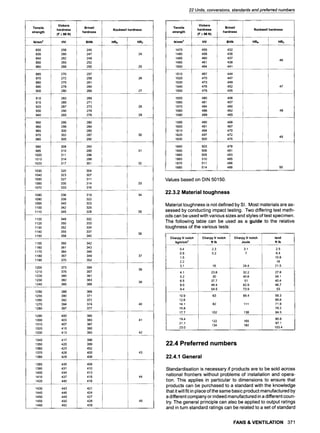
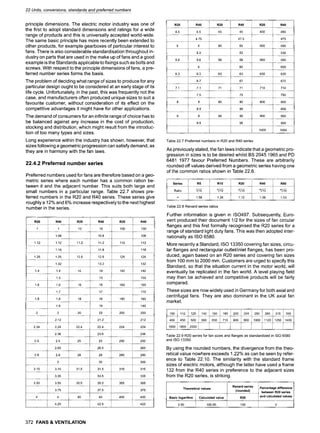


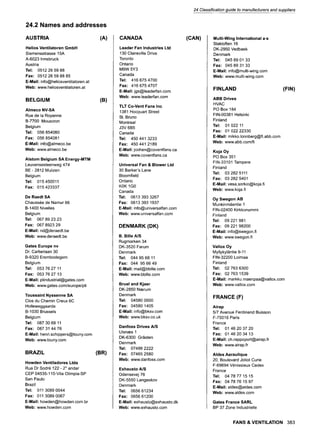
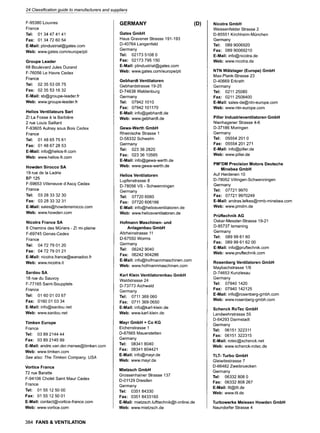
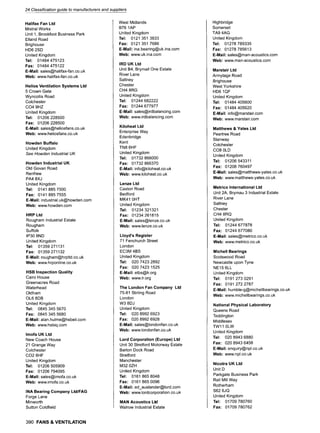
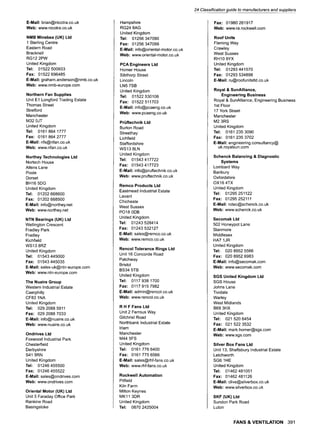
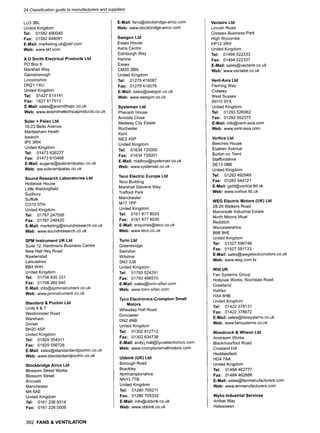
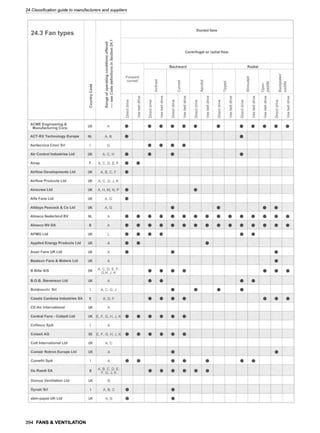
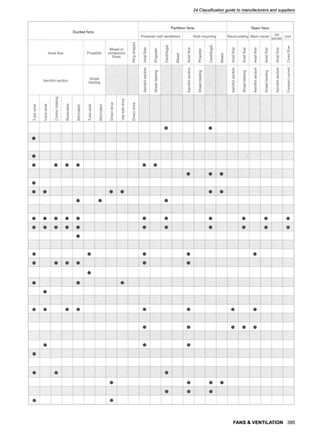
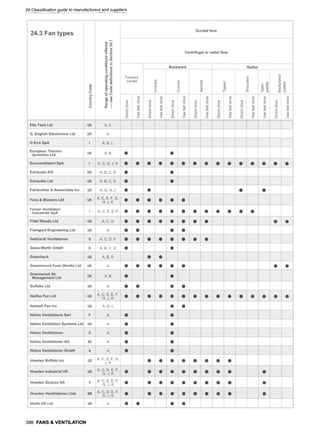
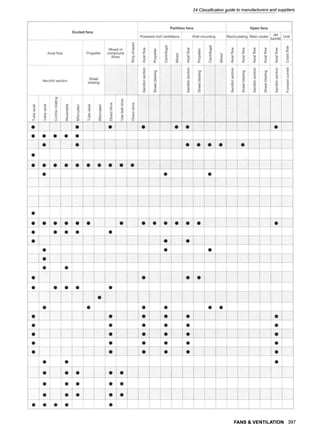
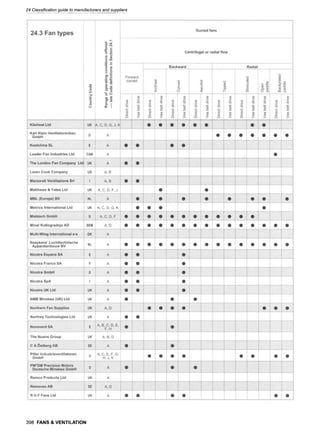

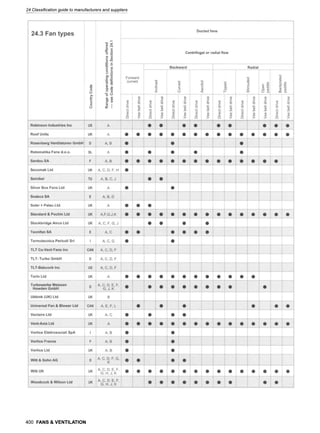
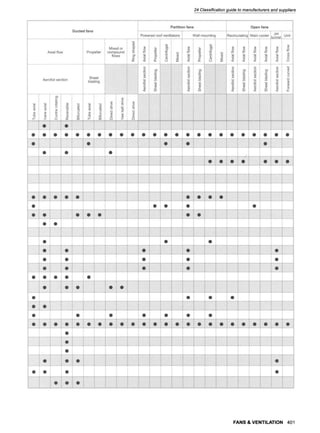


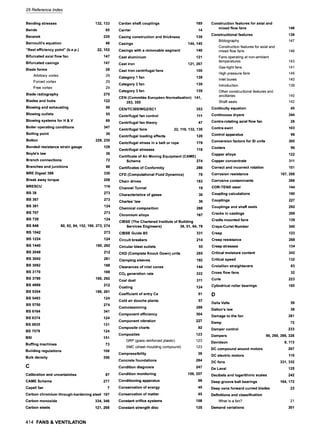
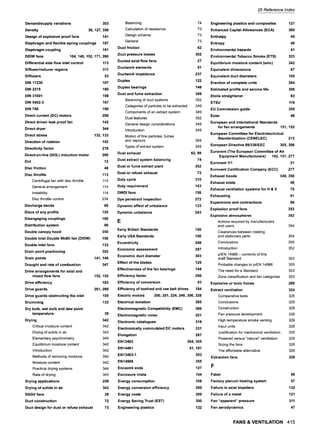


![[Deck] What's New in Spark-Iceberg Integration via DSV2.pptx](https://cdn.slidesharecdn.com/ss_thumbnails/deckwhatsnewinspark-icebergintegrationviadsv2-260210005337-25955b12-thumbnail.jpg?width=640&height=640&fit=bounds)


