The crop wild relatives of potato have been largely and successfully used in breeding to acquire agronomical attributes that can help the cultivated potato to be more resistant against pest, diseases and extreme environmental conditions. Assessing the representativeness of these species in genebanks, is a fundamental step to secure these genetic resources for plant breeding and future availability of this crop.
Poster prepared for the International Potato Center (CIP) Board of Trustees meeting, December 2014
Marker assisted breeding in Maize, genotypic selection with the help of markers increases selection efficiency and helps in quicker advancement of breeding programmes.
It comprises on mating designs used in plant breeding programs. 6 basic mating designs are briefly explained in it with their requirements as well limiting factors...
CAPFITOGEN Programme for the Strengthening of Capabilities in National Plant Genetic Resources Programmes, International Treaty on Plant Genetic Resources for Food and Agriculture - FAO
Introduction:
Proposed by Meuwissen et al. (2001)
GS is a specialized form of MAS, in which information from genotype data on marker alleles covering the entire genome forms the basis of selection.
The effects associated with all the marker loci, irrespective of whether the effects are significant or not, covering the entire genome are estimated.
The marker effect estimates are used to calculate the genomic estimated breeding values (GEBVs) of different individuals/lines, which form the basis of selection.
Why to go for genomic selection:
Marker-assisted selection (MAS) is well-suited for handling oligogenes and quantitative trait loci (QTLs) with large effects but not for minor QTLs.
MARS attempts to take into account small effect QTLs by combining trait phenotype data with marker genotype data into a combined selection index.
Based on markers showing significant association with the trait(s) and for this reason has been criticized as inefficient
The genomic selection (GS) scheme was to rectify the deficiency of MAS and MARS schemes. The GS scheme utilizes information from genome-wide marker data whether or not their associations with the concerned trait(s) are significant.
GEBV: GenomicEstimated Breeding Values-
The sum total of effects associated with all the marker alleles present in the individual and included in the GS model applied to the population under selection
Calculated on a single individual basis
Gene-assisted genomic selection:
A GS model that uses information about prior known QTLs, the targeted QTLs were accumulated in much higher frequencies than when the standard ridge regression was used
The sum total of effects associated with all the marker alleles present in the individual and included in the GS model applied to the population under selection
Calculated on a single individual basis
Population used:
Training population: used for training of the GS model and for obtaining estimates of the marker-associated effects needed for estimation of GEBVs of individuals/lines in the breeding population.
Breeding population: the population subjected to GS for achieving the desired improvement and isolation of superior lines for use as new varieties/parents of new improved hybrids.
Training population-
large enough: must be representative of the breeding population: max. trait variance with marker : by cluster analysis
should have either equal or comparable LD, LD decay rates with breeding populations
Updated by including individuals/lines from the breeding population
Training more than one generation
Low colinearity between markers is needed since high colinearity tends to reduce prediction accuracy of certain GS models. (colinearity disturbed by recombination)
Life tables concept was first formulated by Raymond Pearl (1924)
Life tables is the systematic tabulation of births and deaths of an organism. It is summary statement on the life of a typical individual of population or a cohort of individuals. .
It is an especially useful approach in entomology where developmental stages are discrete and mortality rates may vary widely from one life stage to another.
From a pest management standpoint, it is very useful to know when (and why) a pest population suffers high mortality.
The Effects of Coconut Milk on the Rooting Of Two Types of Cutting of Termina...ijsrd.com
Objectives: The trial investigated the effects of coconut milk on stem and root cuttings of Terminalia catappa. Methodology and results: Each cutting type treated with three coconut milk concentrations (0%, 50% and 100%).The experiment was a 2x3 factorial set, six treatment combinations replicated four times and laid out in a completely randomized design. The results showed that root cuttings produced significantly more cuttings with roots, number of roots on rooted cuttings and rooted cuttings with the longest roots (P<0.05)>0.05) than those treated with 50% and 0% coconut milk. There was a significant interaction (P<0.05)><0.05)><0.05) between cutting type and coconut milk concentration on the number of leaves produced. It was recommend that root cuttings treated with 100% coconut milk should be used for vegetative propagation programs of the species.
ECOL203403 – Ecology Populations to Ecosystems Assignment .docxbudabrooks46239
ECOL203/403 – Ecology: Populations to Ecosystems
Assignment 2: Predator-Prey Interactions
T1 2020
Figure 0. Tarantula Theraphosa blondi pulling a captured giant earthworm (presumably
Rhinodrilus sp.) into its burrow in rainforest in French Guiana. Photo by C.E. Timothy Paine. Find
more information about earthworm-eating tarantulas in Nyffler et. al. 2017. Journal of
Arachnology 45:242–247.
Objective
The purpose of this assignment is for you to run a manipulative experiment using
a realistic predator-prey model. In so doing, you will
1. explore how predators affect prey populations and vice versa
2. explore the linkages between ecological processes and their
representations in models
3. design and execute an ecological experiment
Introduction
This assignment demonstrates how the actions of individuals compound to
generate population dynamics. We know that all populations can grow
exponentially, and we also know that never occurs for long, as the resources
available to populations eventually restrict their growth. In this practical, you will
explore how and when this occurs. You will further explore conditions under
which more complicated – and even interesting – population dynamics occur.
In simple models, one could assume that all predators had access to all prey at
all times. In reality, however, populations have spatial structure, because
individuals are located at specific locations in space. This has several effects on
their ecology. First, an individual’s spatial location restricts the set of individuals
that it can interact with to be those in its local neighborhood. Second, space
(together with the sensory organs of the organism in question) affects the
detectability of predators and prey. Third, heterogeneity in the spatial distribution
of resource availability, refuges, mates, and abiotic conditions (etc) can strongly
influence ecological processes. Finally, the viscosity (or ‘thickness’) of the
environment, together with the dispersal abilities of the organism, affects how
quickly they can move through space. All of these factors influence ecological
interactions among organisms. A final consideration is the dimensionality of
space. For terrestrial organisms, the world is (to a first approximation) flat,
whereas for aquatic, marine or airborne organisms it is three-dimensional. In the
sky, a predator may be above you. In water, predators may lurk above or below
you. In this model, we assume that the predators and prey exist in a flat (two-
dimensional) homogeneous field.
Modeling platform
You will use a modeling platform, NetLogo, in which the spatially explicit two-
species model has been developed. NetLogo is a multi-agent programmable
modeling environment used by tens of thousands of students, teachers and
researchers worldwide. Models are written in the NetLogo language, which
provides a graphical user interface for users.
Description of model
ARENA: You will si.
ECOL203403 – Ecology Populations to Ecosystems Assignment .docxtidwellveronique
ECOL203/403 – Ecology: Populations to Ecosystems
Assignment 2: Predator-Prey Interactions
T1 2020
Figure 0. Tarantula Theraphosa blondi pulling a captured giant earthworm (presumably
Rhinodrilus sp.) into its burrow in rainforest in French Guiana. Photo by C.E. Timothy Paine. Find
more information about earthworm-eating tarantulas in Nyffler et. al. 2017. Journal of
Arachnology 45:242–247.
Objective
The purpose of this assignment is for you to run a manipulative experiment using
a realistic predator-prey model. In so doing, you will
1. explore how predators affect prey populations and vice versa
2. explore the linkages between ecological processes and their
representations in models
3. design and execute an ecological experiment
Introduction
This assignment demonstrates how the actions of individuals compound to
generate population dynamics. We know that all populations can grow
exponentially, and we also know that never occurs for long, as the resources
available to populations eventually restrict their growth. In this practical, you will
explore how and when this occurs. You will further explore conditions under
which more complicated – and even interesting – population dynamics occur.
In simple models, one could assume that all predators had access to all prey at
all times. In reality, however, populations have spatial structure, because
individuals are located at specific locations in space. This has several effects on
their ecology. First, an individual’s spatial location restricts the set of individuals
that it can interact with to be those in its local neighborhood. Second, space
(together with the sensory organs of the organism in question) affects the
detectability of predators and prey. Third, heterogeneity in the spatial distribution
of resource availability, refuges, mates, and abiotic conditions (etc) can strongly
influence ecological processes. Finally, the viscosity (or ‘thickness’) of the
environment, together with the dispersal abilities of the organism, affects how
quickly they can move through space. All of these factors influence ecological
interactions among organisms. A final consideration is the dimensionality of
space. For terrestrial organisms, the world is (to a first approximation) flat,
whereas for aquatic, marine or airborne organisms it is three-dimensional. In the
sky, a predator may be above you. In water, predators may lurk above or below
you. In this model, we assume that the predators and prey exist in a flat (two-
dimensional) homogeneous field.
Modeling platform
You will use a modeling platform, NetLogo, in which the spatially explicit two-
species model has been developed. NetLogo is a multi-agent programmable
modeling environment used by tens of thousands of students, teachers and
researchers worldwide. Models are written in the NetLogo language, which
provides a graphical user interface for users.
Description of model
ARENA: You will si.
Here, we describe a learning strategy that results an excellent choice for a first approach of students to produce scientific knowledge that can be confronted in the scientific field as well as recognize in this knowledge the transferability to the natural resources management. Nowadays, the availability of several Population Genetics software together with public molecular database represents a valuable tool of great assistance for teachers of this discipline. In this way, we implemented a
lecture where the students worked with empirical data set from a recent published article. The students joined theoretical concepts learned, computational software free available and empirical data set. The development of the activity comprised four steps: i) estimate population genetics parameters using software recommended by teachers, ii) understand results in a biological sense, iii) read the original manuscript from dataset authors and iv) compare both results in a comprehensive way. The students assumed the challenge under a reflective look and they kept a very fruitful discussion playing a role of population geneticists. Their exchange of ideas allowed them arrive to the conclusion that Manilkara zapota populations keep high levels of genetic diversity, although Ancient Maya left traces in the genetic makeup of these non-native populations with different management histories.
Comparing Evolved Extractive Text Summary Scores of Bidirectional Encoder Rep...University of Maribor
Slides from:
11th International Conference on Electrical, Electronics and Computer Engineering (IcETRAN), Niš, 3-6 June 2024
Track: Artificial Intelligence
https://www.etran.rs/2024/en/home-english/
A brief information about the SCOP protein database used in bioinformatics.
The Structural Classification of Proteins (SCOP) database is a comprehensive and authoritative resource for the structural and evolutionary relationships of proteins. It provides a detailed and curated classification of protein structures, grouping them into families, superfamilies, and folds based on their structural and sequence similarities.
Multi-source connectivity as the driver of solar wind variability in the heli...Sérgio Sacani
The ambient solar wind that flls the heliosphere originates from multiple
sources in the solar corona and is highly structured. It is often described
as high-speed, relatively homogeneous, plasma streams from coronal
holes and slow-speed, highly variable, streams whose source regions are
under debate. A key goal of ESA/NASA’s Solar Orbiter mission is to identify
solar wind sources and understand what drives the complexity seen in the
heliosphere. By combining magnetic feld modelling and spectroscopic
techniques with high-resolution observations and measurements, we show
that the solar wind variability detected in situ by Solar Orbiter in March
2022 is driven by spatio-temporal changes in the magnetic connectivity to
multiple sources in the solar atmosphere. The magnetic feld footpoints
connected to the spacecraft moved from the boundaries of a coronal hole
to one active region (12961) and then across to another region (12957). This
is refected in the in situ measurements, which show the transition from fast
to highly Alfvénic then to slow solar wind that is disrupted by the arrival of
a coronal mass ejection. Our results describe solar wind variability at 0.5 au
but are applicable to near-Earth observatories.
Slide 1: Title Slide
Extrachromosomal Inheritance
Slide 2: Introduction to Extrachromosomal Inheritance
Definition: Extrachromosomal inheritance refers to the transmission of genetic material that is not found within the nucleus.
Key Components: Involves genes located in mitochondria, chloroplasts, and plasmids.
Slide 3: Mitochondrial Inheritance
Mitochondria: Organelles responsible for energy production.
Mitochondrial DNA (mtDNA): Circular DNA molecule found in mitochondria.
Inheritance Pattern: Maternally inherited, meaning it is passed from mothers to all their offspring.
Diseases: Examples include Leber’s hereditary optic neuropathy (LHON) and mitochondrial myopathy.
Slide 4: Chloroplast Inheritance
Chloroplasts: Organelles responsible for photosynthesis in plants.
Chloroplast DNA (cpDNA): Circular DNA molecule found in chloroplasts.
Inheritance Pattern: Often maternally inherited in most plants, but can vary in some species.
Examples: Variegation in plants, where leaf color patterns are determined by chloroplast DNA.
Slide 5: Plasmid Inheritance
Plasmids: Small, circular DNA molecules found in bacteria and some eukaryotes.
Features: Can carry antibiotic resistance genes and can be transferred between cells through processes like conjugation.
Significance: Important in biotechnology for gene cloning and genetic engineering.
Slide 6: Mechanisms of Extrachromosomal Inheritance
Non-Mendelian Patterns: Do not follow Mendel’s laws of inheritance.
Cytoplasmic Segregation: During cell division, organelles like mitochondria and chloroplasts are randomly distributed to daughter cells.
Heteroplasmy: Presence of more than one type of organellar genome within a cell, leading to variation in expression.
Slide 7: Examples of Extrachromosomal Inheritance
Four O’clock Plant (Mirabilis jalapa): Shows variegated leaves due to different cpDNA in leaf cells.
Petite Mutants in Yeast: Result from mutations in mitochondrial DNA affecting respiration.
Slide 8: Importance of Extrachromosomal Inheritance
Evolution: Provides insight into the evolution of eukaryotic cells.
Medicine: Understanding mitochondrial inheritance helps in diagnosing and treating mitochondrial diseases.
Agriculture: Chloroplast inheritance can be used in plant breeding and genetic modification.
Slide 9: Recent Research and Advances
Gene Editing: Techniques like CRISPR-Cas9 are being used to edit mitochondrial and chloroplast DNA.
Therapies: Development of mitochondrial replacement therapy (MRT) for preventing mitochondrial diseases.
Slide 10: Conclusion
Summary: Extrachromosomal inheritance involves the transmission of genetic material outside the nucleus and plays a crucial role in genetics, medicine, and biotechnology.
Future Directions: Continued research and technological advancements hold promise for new treatments and applications.
Slide 11: Questions and Discussion
Invite Audience: Open the floor for any questions or further discussion on the topic.
(May 29th, 2024) Advancements in Intravital Microscopy- Insights for Preclini...Scintica Instrumentation
Intravital microscopy (IVM) is a powerful tool utilized to study cellular behavior over time and space in vivo. Much of our understanding of cell biology has been accomplished using various in vitro and ex vivo methods; however, these studies do not necessarily reflect the natural dynamics of biological processes. Unlike traditional cell culture or fixed tissue imaging, IVM allows for the ultra-fast high-resolution imaging of cellular processes over time and space and were studied in its natural environment. Real-time visualization of biological processes in the context of an intact organism helps maintain physiological relevance and provide insights into the progression of disease, response to treatments or developmental processes.
In this webinar we give an overview of advanced applications of the IVM system in preclinical research. IVIM technology is a provider of all-in-one intravital microscopy systems and solutions optimized for in vivo imaging of live animal models at sub-micron resolution. The system’s unique features and user-friendly software enables researchers to probe fast dynamic biological processes such as immune cell tracking, cell-cell interaction as well as vascularization and tumor metastasis with exceptional detail. This webinar will also give an overview of IVM being utilized in drug development, offering a view into the intricate interaction between drugs/nanoparticles and tissues in vivo and allows for the evaluation of therapeutic intervention in a variety of tissues and organs. This interdisciplinary collaboration continues to drive the advancements of novel therapeutic strategies.
Deep Behavioral Phenotyping in Systems Neuroscience for Functional Atlasing a...Ana Luísa Pinho
Functional Magnetic Resonance Imaging (fMRI) provides means to characterize brain activations in response to behavior. However, cognitive neuroscience has been limited to group-level effects referring to the performance of specific tasks. To obtain the functional profile of elementary cognitive mechanisms, the combination of brain responses to many tasks is required. Yet, to date, both structural atlases and parcellation-based activations do not fully account for cognitive function and still present several limitations. Further, they do not adapt overall to individual characteristics. In this talk, I will give an account of deep-behavioral phenotyping strategies, namely data-driven methods in large task-fMRI datasets, to optimize functional brain-data collection and improve inference of effects-of-interest related to mental processes. Key to this approach is the employment of fast multi-functional paradigms rich on features that can be well parametrized and, consequently, facilitate the creation of psycho-physiological constructs to be modelled with imaging data. Particular emphasis will be given to music stimuli when studying high-order cognitive mechanisms, due to their ecological nature and quality to enable complex behavior compounded by discrete entities. I will also discuss how deep-behavioral phenotyping and individualized models applied to neuroimaging data can better account for the subject-specific organization of domain-general cognitive systems in the human brain. Finally, the accumulation of functional brain signatures brings the possibility to clarify relationships among tasks and create a univocal link between brain systems and mental functions through: (1) the development of ontologies proposing an organization of cognitive processes; and (2) brain-network taxonomies describing functional specialization. To this end, tools to improve commensurability in cognitive science are necessary, such as public repositories, ontology-based platforms and automated meta-analysis tools. I will thus discuss some brain-atlasing resources currently under development, and their applicability in cognitive as well as clinical neuroscience.
This presentation explores a brief idea about the structural and functional attributes of nucleotides, the structure and function of genetic materials along with the impact of UV rays and pH upon them.
Observation of Io’s Resurfacing via Plume Deposition Using Ground-based Adapt...Sérgio Sacani
Since volcanic activity was first discovered on Io from Voyager images in 1979, changes
on Io’s surface have been monitored from both spacecraft and ground-based telescopes.
Here, we present the highest spatial resolution images of Io ever obtained from a groundbased telescope. These images, acquired by the SHARK-VIS instrument on the Large
Binocular Telescope, show evidence of a major resurfacing event on Io’s trailing hemisphere. When compared to the most recent spacecraft images, the SHARK-VIS images
show that a plume deposit from a powerful eruption at Pillan Patera has covered part
of the long-lived Pele plume deposit. Although this type of resurfacing event may be common on Io, few have been detected due to the rarity of spacecraft visits and the previously low spatial resolution available from Earth-based telescopes. The SHARK-VIS instrument ushers in a new era of high resolution imaging of Io’s surface using adaptive
optics at visible wavelengths.
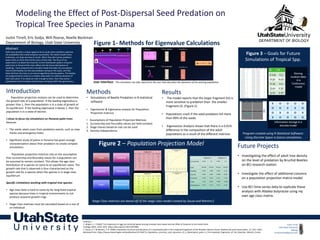
1. Introduction
Population projection analysis can be used to determine
the growth rate of a population. If the leading eigenvalue is
greater than 1, then the population is in a state of growth at
its equilibrium. If the leading eigenvalue is below 1, then the
population is in a state of decline.
I chose to focus my simulations on Panama palm trees
because:
• The seeds retain scars from predation events, such as claw
marks and emergence holes.
• Significant study of palms in Panama has given enough
characterization about their predators to create complex
simulations.
Population projection matrices rely on the assumption
that survivorship and fecundity values for a population can
be assumed to remain constant. This allows the age class
distribution of a species to come to an equilibrium value. The
growth rate that is observed is thus characterized as the
growth rate for a species when the species is in stage class
equilibrium
Specific Limitations working with tropical tree species:
• Age class Data is hard to come by for long-lived tropical
species because trees in tropical environments to not
produce seasonal growth rings.
• Stage Class matrixes must be calculated based on a size of
an individual
Modeling the Effect of Post-Dispersal Seed Predation on
Tropical Tree Species in Panama
Results
• The model reports that the larger fragment (III) is
more sensitive to predation than the smaller
Fragment (I). (Figure 2)
• Populations crash if the seed predators kill more
than 99% of the seeds
• Eigenvector Analysis shows that there is a 0.01%
difference in the composition of the adult
populations as a result of the different matrices
Future Projects
• Investigating the effect of adult tree density
on the level of predation by Bruchid Beetles
on BCI research station.
• Investigate the effect of additional columns
on a population projection matrix model
• Use BCI time-series data to replicate these
analysis with Attalea butyracea using my
own age class matrix.
Figure 2 – Population Projection Model
Figure 3 – Goals for Future
Simulations of Tropical Spp.
Figure 1- Methods for Eigenvalue Calculations
Justin Tirrell
Utah State University
Biology
tirrelljustin95@gmail.com
Stage Class matrices are based off of the stage class model created by Souza and Martins f
Program created using R Statistical Software:
Using Discrete Space in future simulations
Abstract
Palm trees provide a unique opportunity to study what conditions optimize
the probability that a seed will grow successfully. The seeds of palm trees,
endocarps, are large and easy to locate. When they don't grow, predators
leave marks on them that tell the story of their fate. The focus of my
experiment is to determine how the current distribution pattern of parent
palm trees in Panama Palm trees affects the the future distribution of
seedlings. I have programmed a versatile model that takes the assumption
that bruchid beetles are the sole predators acting on the seeds, and that
these fall from the trees in an inverse logarithmic density pattern. The beetles
are programmed to move to a random seed within an arbitrary distance of
their start point. If no seeds are near enough to them, then they starve. I
hypothesize that the beetles will decrease clumping within five generations.
Justin Tirrell, Eric Sodja, Will Pearse, Noelle Beckman
Department of Biology, Utah State University.
Methods
• Simulations of Beetle Predation in R statistical
software
• Eigenvector & Eigenvalue analysis for Population
Projection matrices
• Assumptions of Population Projection Matrices
1. Survivorship and Fecundity values are held constant
2. Stage classes based on size can be used
3. Density-independence
User Interface: This simulation can take input from the user that describes the dynamics of the existing population.
Citations:
1. Wright, S. J. (1983). The Dispersion of Eggs by a Bruchid Beetle among Scheelea Palm Seeds and the Effect of Distance to the Parent Palm.
Ecology, 64(5), 1016–1021. https://doi.org/10.2307/1937808
2. Souza, A. F. & Martins, F. R. (2004). Population structure and dynamics of a neotropical palm in fire-impacted fragments of the Brazilian Atlantic Forest. Biodiversity and Conservation, 13: 1611-1632.
Retrieved from: https://www.researchgate.net/publication/227158775_Population_structure_and_dynamics_of_a_Neotropical_palm_in_fire-impacted_fragments_of_the_Brazilian_Atlantic_Forest.
Seed Seedling
Juvenile Immature
Virgin Reproductive
Fragment 1 Fragment 3
Survivorship 0.01% 1% 0.01% 1%
Seed 98.03% 95.50% 99.61% 96.65%
Seedling 0.05% 2.48% 0.03% 1.62%
Juvenile 0.01% 0.39% ~0.00% 0.08%
Immature 0.24% 0.61% 0.22% 1.47%
Virgin 1.52% 0.85% ~0.00% ~0.00%
Reproductive 0.15% 0.17% 0.14% 0.17%