SlideShare a Scribd company logo
1 of 11
Download to read offline
American Journal of Multidisciplinary Research & Development (AJMRD)
Volume 2, Issue 11 (November- 2020), PP 34-44
ISSN: 2360-821X
www.ajmrd.com
Multidisciplinary Journal www.ajmrd.com Page | 34
Research Paper Open Access
Analysis of Long-Term Rainfall Trends in Sri Lanka Using
CHRIPS Estimates.
A.G. Amarasinghe,
Head, Department of Geography, University of Kelaniya, Dalugama, Sri Lanka.
ABSTRACT:- For a country like Sri Lanka where food security and the economy depend on timely water
availability, it is extremely important to study rainfall trends. In this work, monthly, seasonal and annual rainfall
trends were studied using a series of 30-year (1989-2019) monthly data for 30 sub-visions (sub-regions) of Sri
Lanka. The uniqueness of this study is the use of daily raster data generated by mixing satellite estimates and
location data (CRIPS) instead of traditional spatial rainfall measurements. In addition, the study was conducted
by dividing Sri Lanka into four main areas (sub-divisions) considering the climatic and geographical factors of
the country rather than finding out whether there is a significant trend in rainfall by the district level. These sub-
divisions were named as SD-01, SD-02, SD-03 and SD-04. The main statistical method used in the study was
the Man-Kandall and Sen’s slope, which looked at whether the incidence of annual, seasonal and monthly
rainfall was significantly reduced or increased. According to this analysis, all sub-divisions show an increasing
tendency for annual rainfall, all of which were statistically significant. That is to say, the most important factor
reflected in the last 30 years is the increase in annual rainfall in all parts of Sri Lanka. The special feature of the
monsoon (southwest and northeast) in Sri Lanka is that it shows a significant trend of southwest rainfall but
cannot be identified during the northeast. The study further exaggerated the long-term precipitation trend for
each month using only monthly rainfall data. In doing so, it appears that not all four major areas show a
significant trend except few months. In this regard, significant trends can be identified in March, August and
September for SD-01, while significant trends in SD-02 and SD-03 can be seen in March, but no significant
trend in any of the months can be identified in SD-04. It is further suggested that a small scale study should be
carried out to study the trend of monthly rainfall.
Key words: Rainfall, Satellite, Significant, Sub-Divisions, Trend
I. INTRODUCTION
Global average rainfall is forecast to increase, but increases and decreases on a regional and continental
scale are expected (Dor, 2005). More or less rainfall or changes in its spatial and seasonal distribution will affect
the spatial and temporal distribution of overflow, soil moisture and groundwater reserves, as well as the
frequency of droughts and floods.
According to the forecasts of the Intergovernmental Panel on Climate Change (IPCC) changes of the
global climate will affect agriculture, increase the risk of famine and water scarcity, and cause glaciers to melt
more rapidly (IPCC, 2007, 2013 and 2014). Freshwater in some river basins in Sri Lanka have already been
depleted due to climate change. This decline, along with population growth and rising living standards, could
adversely affect many people in Sri Lanka by the 2050s.
Rapid glacial melting causes increased risk factors for flooding, slope destabilization, and reduced river
flow (IPCC, 2007). Both Climate change or climate variability are not myths and there is ample evidence to
support them (Adger, et al., 2002; Schuldt et al., 2011; Spence et al., 2011; Weber et al., 2011). Many
researchers believe that human interactions have accelerated climate change (Chapin, et al., 2000; Hoegh-
Guldberg and Bruno, 2010; Karl, 2003; Pearson and Dawson, 2003; Walther et al., 2002). Although climate
variability is only one possibility, many as global warming (Schuldt et al., 2011), often refer to climate
variability. Observations (Easterling et al., 2000; Knutti et al., 2002; Soja et al., 2007) and theoretical models
(Karl, 2003; Kim et al., 2003; Tebaldi et al., 2007) are mainly used to understand current and future climate
variables.
Analysis of Long-Term Rainfall Trends in Sri Lanka Using CHRIPS Estimates.
Multidisciplinary Journal www.ajmrd.com Page | 35
Climate variability can be identified as function of changes in rainfall and atmospheric temperature,
slow winds, and acidification of the ocean. Atmospheric temperature and precipitation have also been identified
by various studies as the two most sensitive factors for people. Changes in rainfall are one of the most important
factors determining the overall impact of climate change, and it is clear that it affects society in a very big way.
Various researchers have predicted that warmer climates will intensify rainfall (Christensen and J.
Christensen, 2004). This is most evident in the fact that more intense rainfall (precipitation) events can be
identified after the onset of drier intervals. Other researchers have argued that the effects of climate change
cannot be measured by regional rainfall over natural fluctuations (Chandler, 2001; Guowei and Jingpeng, 1999;
Kundzewicz and Robson, 2000; Lindstrom, 1999; Lins, 1999; Robson, 2000; Robson, 2002; Robson, 1998).
However, some cases show a strong correlation between human activity and climate change (Kawashima et al.,
2004; Oreskes, 2004; Wang et al., 2007). Studies have shown that the unequal floods in England and Wales in
the fall of 2000 were man-made (Jones and Reynard, 2006; Lorenzoni et al., 2007; Prudhomme et al., 2003).
Rainfall trend analysis was carried out in several important catchment areas of Sri Lanka. According to
Jayawardena and others. The average annual rainfall in Colombo, Sri Lanka is a significant annual increase of
3.15 mm, while the other cities, Kandy and Nuwara Eliya, experience an annual decrease of 2.88 and 4.87,
respectively (Jayawardene et al, 2005). Literature, It can be seen that a number of other researches have
conducted precipitation research in many other important areas of Sri Lanka (Ampitiyawatta and Guo, 2010;
Herath and Ratnayake, 2004; Jayawardene et al., 2015; Malmgren et al., 2003; Ranatunge et al., 2003; Suppiah,
1997; Wickramagamage, 2015).
However, the literature does not show that a precipitation trend analysis has been carried out based on
satellite rainfall estimates at the district/regional level in Sri Lanka. Only (Alahacoon et al., 2018) done a basin
level rainfall trend analysis using satellite estimated rainfall data. This study primarily focuses on conducting
Sub-Division (SD-01 to SD-04) precipitation analysis using monthly rainfall data. Based on such studies, it is
possible to identify if there is a shortage of water in the catchments.
In order to carry out homogeneity tests, it is important in daily rainfall measurements to ensure that
data are recorded daily at the same time with the same equipment in the same location (Sahin and Cigizoglu,
2010: Perera et al., 2017; Wijemannage and Perera, 2018). However, recording daily rainfall measurements over
long time intervals (such as 30 years or 100 years) can be tedious because the measurement patterns have
changed over time, the measuring instruments have been re-installed, and so on. As literature explain by
(Alexandersson and Moberg, 1997; Khaliq and Ouarda, 2007; Sahin and Cigizoglu, 2010; Wijngaard, 2003;
Alexandersson, 1986; Buishand, 1982; Haylock et al., 2009) there are many homogeneity tests used to correct
the rainfall data. The best answer to all the problems analyzed above is to use satellite estimate rainfall data.
Study Area
Sri Lanka is an island in the Indian Ocean southwest of the Bay of Bengal, between latitudes 5 ° and 10
N and longitudes 79 ° and 82 E. The island consists mostly of flat, rolling coastal plains and with south-central
mountains. The rainfall pattern is affected by two monsoon winds in the Indian Ocean and the Bay of Bengal.
Sri Lanka is divided into three main climatic zones, namely the "wet zone", the "dry zone" and the "semi-arid
zone". The "wet zone" and southwesterly windy slopes of the country hills receive an average of 2,500 mm of
rainfall each year. Most of the "dry zone" in the eastern, southeastern and northern parts of Sri Lanka receives
between 1,200 and 1,900 mm of rainfall. This precipitation is mainly due to the northeast monsoon winds.
Similarly, the semi-arid northwestern and southeastern coasts receive the minimum rainfall of 800 to 1200 mm.
Major monsoons are known as the Northeast Monsoon and the Southwest Monsoon distributed in
December to February and May to September in each year. In addition, there are two intermittent monsoons
between the two seasons: the 1st intermediate season from March to April and the 2nd intermediate monsoon
from October to November. When consider the cultivation period it is aggregated as Yala (April to August)
season and Maha season (October to February). 103 rivers are formed in Sri Lanka with the help of the monsoon
winds and central mountains described above and cover 103 major and minor river basins. The longest of these
rivers is the Mahaweli River which stretches for 335 km.
In terms of administration in Sri Lanka, It is divided into 9 provinces and 25 districts as the main
administrative units. Each district is further subdivided into the Divisional Secretariat (DS-Divisions-256) and
the Grama Niladhari Division (GN - approximately 16000).
Analysis of Long-Term Rainfall Trends in Sri Lanka Using CHRIPS Estimates.
Multidisciplinary Journal www.ajmrd.com Page | 36
Figure 1: Sub-Division map of Sri Lanka used in this study.
As shown in Figure 1, the study initially divided Sri Lanka into four major regions, taking into account
climatic distribution and geographical settings. These were named Sub-division 1 (SD1), Sub-division 2 (SD2),
Sub-division 3 (SD3) and Sub-division 4 (SD4). Table 1 below shows the list of districts which are the
administrative units included in these sub-divisions (SD1 to SD4).
Analysis of Long-Term Rainfall Trends in Sri Lanka Using CHRIPS Estimates.
Multidisciplinary Journal www.ajmrd.com Page | 37
Table 1: List of districts fallen in to four different sub-divisions
Sub-Division name Districts
Sub-Division 01
(SD-01)
Colombo, Galle, Ganpaha, Kalutara, Kandy, Kegalle, Rathnapura, Nuvara-Eliya,
Matara
Sub-Division 02
(SD-02)
Ampara, Badulla, Baticaloa, Hambantota, Monaragala
Sub-Division 03
(SD-03)
Anuradhapura, Matake, Kurunagala, Puttalam, Polonnaruwa, Trinco,alee
Sub-Division 04
(SD-04)
Jaffna, Kilinochchi, Mannar, Mullaitivu, Vavuniya
II. DATA AND METHODOLOGY
Mann, (1945) proposed an asymmetric test to analyze the tendencies, while (Kendall, 1975) executed
the Mann test. In addition, (Harsh et al., 1982) Seasonal assessment was added to the test. This tendency is now
more widely known as the Man-Kendall test for trend analysis. It tests statistically monotonic ups and downs of
the climate trends over the time and that test is widely used around the world (Robson, 2002; Khaniya et al.,
2018; Mondal et al., 2012).
Man-Kendall's statistics
Man-Kendall's statistics S is given by the following formula (1):
xj and xi are the time series and n is the number of data points in the time series. The sign function "Sgn" can
be expressed as follows (2);
(2)
The calculation of the variables in the Man-Kendall experiment is given by the following equation (3):
Where it is the number of bonds specified in the sample i. then, Man-Kendall's statistics Zc are given by the
following expressions (4);
(4)
Zc follows the standard normal distribution. A positive Zc value shows a high (upward) tendency and a negative
Zc data gives a low (downward) tendency for the period.
Sen’s slope estimation
The magnitude of given time trend can be found in Sen's Slope estimator (Sen, 1968). The test is widely used to
estimate the magnitude of the propensity for rainfall ranges over time. Slope pairs can be calculated for all data
using the following equation (5);
Analysis of Long-Term Rainfall Trends in Sri Lanka Using CHRIPS Estimates.
Multidisciplinary Journal www.ajmrd.com Page | 38
Where, Ti is the slope and xj and xk are the data values at time j and k, respectively.
The mean of the n values of Ti is encoded as Sen,s Slope estimator (Qi) and is calculated using following
equation (6);
III. DATA
Climate Hazards Group Infra-Red Precipitation with Station Data provided (CHIPS) by the Climate
Hazard Center, are the basic data used for this study. This data is available as Daily Grinding Rainfall and can
be accessed (https://data.chc.ucsb.edu/products/CHIRPS-2.0/) from the web link from 1981 to the present.
These data were then converted into monthly rainfall data using the method of daily accumulation sum at
monthly basis. Geo-statistical Data Analysis method was apply to completed the above procedure. Finally, the
monthly average rainfall value for each area used in the study was calculated by applying the zonal statistical
method.
IV. RESULTS
Figure 2 shows the annual rainfall variation of by province. The spatial and temporal variation of
rainfall can be clearly seen in this figure. All of this annual rainfall usually show different patterns with falls and
rises and they show an increasing tendency. In addition, all regions except SD-01 received significantly less
rainfall in 2016 compared to other years. Therefore, it can be considered as a drought year for them. Tests to
show the homogeneity of rainfall data show that the data series are homogeneous for all four sub-divisions. As
shown in Figure 2, all of these annual precipitates generally show more or less similar patterns with different
annual accumulated rainfall values. For example, SD-01 has the highest annual rainfall and SD-04 shows the
lowest annual rainfall. SD-02 and SD-03 represent more or less similar patterns except in 2015, with SD-03
receiving very good rainfall, the bumper crop year of Sri Lanka (Census and Statistics).
Figure 2: Representation of Annual rainfall distribution in identified four regions of Sri Lanka
Analysis of Long-Term Rainfall Trends in Sri Lanka Using CHRIPS Estimates.
Multidisciplinary Journal www.ajmrd.com Page | 39
Table 2: Mann-Kendall and Sen’s slope calculation results for annual rainfall in four regions
Geographical
region
Kendall's tau P values
(two-tailed)
Significant (Yes)/ Insignificant (No) Sen’s Slope (Qi –
mm/year)
SD-01 0.589 < 0.0001 Yes 27.610
SD-02 0.290 0.0257 Yes 9.302
SD-03 0.419 0.0012 Yes 14.824
SD-04 0.276 0.0337 Yes 14.404
The results of the trend analysis (Mann-Kendall and Sen’s slope) for the annual rainfall data are shown
in Table 2. The table shows a very good trend in annual rainfall for SD-01, SD-02, SD-03 and SD-04 of all the
rainfall zones. The most positive precipitation trends in SD-01rainfall measurements can be identified and the
less values are shown in SD-03 and SD-04. Although the precipitation value is medium less in the SD-02
division. The annual potential rainfall increase for all of these regions is significant, and the annual precipitation
values can be seen from the Sen’s slope. The most important point here is that SD-01 represents about 90% of
the wet zone and the highest annual precipitation increase can be identified in this region, which is 27.61 mm /
yr. The other peculiarity is that the increase in potential rainfall in Sri Lanka is not negative from the trend
analysis.
Figure 3: Temporal variation of Annual rainfall according to Mann-Crandall’s and Sen’s slope
calculation, a. Sub-Division-01, b. Sub-Division-0, c. Sub-Division-03 and d. Sub-Division-04
This is an interesting finding identified in this study. According to the trend analysis, the catchment
area of SD-01 is not subject to severe water scarcity. SD-01 is the main catchment area of Sri Lanka's major
rivers Kalu Ganga, Mahaweli Ganga, Kelani Ganga and Walawe Ganga. However, due to the prevalence of this
precipitation, SD-01 is most prone to floods. The area has been hit by three major floods (2016, 2017, 2018) in
the last four years.
This analysis was expanded to identify the impact of seasonal rainfall in addition to the impact of
annual rainfall on the water resources of the area in these study zones in Sri Lanka. SD-02 to SD-04, in
particular, are famous for their irrigated agriculture and 90% of the total paddy cultivation in the country is done
from these regions. Therefore, the analysis of seasonal rainfall trends will be an interesting topic for farmers in
the area.
Analysis of Long-Term Rainfall Trends in Sri Lanka Using CHRIPS Estimates.
Multidisciplinary Journal www.ajmrd.com Page | 40
Table 3: Mann-Kendall and Sen’s slope calculation results for seasonal rainfall in four regions
Geographical
region
Rainfall season Kendall's tau P values
(two-tailed)
Significant (Yes)/
Insignificant (No)
Sen’s Slope (Qi
–mm/year)
SD-01 Yala
Maha
0.354
0.118
0.006
0.378
Yes
No
12.513
4.72
SD-02 Yala
Maha
0.299
-0.034
0.021
0.807
Yes
No
3.184
-2.743
SD-03 Yala
Maha
0.35
0.064
0.007
0.639
Yes
No
6.164
3.248
SD-04 Yala
Maha
0.331
0.202
0.011
0.129
Yes
No
3.016
11.879
Statistics from Man-Kendall's test for seasonal rainfall and Sen's slope estimation are shown in Table 2.
It is noteworthy that all divisions show significant trends for rainfall only during the Yala season. It is also
important to note that SD-02 only shows a negative value (Figure 4) during the Maha season as this could
exacerbate the drought.
Figure 4: Temporal variation of Annual rainfall according to Mann-Crandall’s and Sen’s slope
calculation, a-d Sub-Division 01, 02, 03 and 04 Yala season, e-h. Sub-Division-01, 02, 03 and 04 in
Maha Season.
Furthermore, SD-02 and SD-04 are more closely related by geography and climatology, again, these
rainfall trends and the slope of those divisions show similar variability. This is interesting and it will be
interesting to study further the topographical contribution for this rainfall trends.
Analysis of Long-Term Rainfall Trends in Sri Lanka Using CHRIPS Estimates.
Multidisciplinary Journal www.ajmrd.com Page | 41
Table 4: Mann-Kendall and Sen’s slope calculation results for monthly rainfall in four Regions
Region
Months Kendall's
tau
p-value
(Two-
tailed)
Sen's
slope (Qi
–
mm/year)
Region
Months Kendall's
tau
p-value
(Two-
tailed)
Sen's slope
(Qi –
mm/year)
SD-01
Jan -0.193 0.139 -2.597
SD-02
Jan -0.170 0.193 -4.470
Feb 0.147 0.261 1.492 Feb 0.147 0.261 1.737
Mar 0.258 0.048 3.787 Mar 0.290 0.026 2.543
Apr 0.133 0.309 2.946 Apr 0.078 0.556 1.050
May 0.092 0.486 3.352 May 0.092 0.486 0.792
Jun 0.074 0.580 0.761 Jun -0.110 0.581 -0.009
Jul -0.078 0.556 -0.293 Jul -0.009 0.957 -0.304
Aug 0.350 0.007 4.358 Aug 0.203 0.121 1.034
Sep 0.290 0.026 5.419 Sep 0.124 0.344 0.834
Oct 0.170 0.193 4.139 Oct 0.207 0.112 2.749
Nov 0.198 0.129 2.122 Nov -0.037 0.789 -0.296
Dec 0.060 0.656 0.784 Dec 0.041 0.762 1.080
SD-03
Jan -0.170 0.193 -2.899
SD-04
Jan -0.147 0.509 -1.090
Feb 0.147 0.261 1.235 Feb 0.087 0.261 0.261
Mar 0.216 0.097 1.625 Mar 0.184 0.159 0.967
Apr 0.133 0.309 1.646 Apr 0.138 0.292 1.161
May 0.175 0.203 1.635 May 0.060 0.656 0.194
Jun 0.028 0.844 0.043 Jun 0.014 0.929 0.002
Jul -0.087 0.509 -0.281 Jul 0.115 0.382 0.077
Aug 0.157 0.232 0.936 Aug 0.180 0.169 0.330
Sep 0.041 0.762 0.385 Sep 0.018 0.901 0.156
Oct 0.087 0.509 2.158 Oct 0.055 0.682 1.040
Nov 0.028 0.844 1.023 Nov 0.041 0.762 0.929
Dec 0.101 0.443 2.534 Dec 0.166 0.205 4.112
Monthly Trend Analysis Results for the four rain region areas are presented in Table 3. For SD-01, all
months except January and July show a positive trend. However, the Sen’s slope shows the highest values in
August and September, with 4.35 and 5.41, respectively. This study shows that all four major areas show no
significant trend except for a few months. In this regard, significant trends for SD-01 can be identified in March,
August and September, while significant trends in SD-02 and SD-03 can be seen in March but no significant
trend can be detected in any month SD-04.
V. CONCLUSIONS
Of paramount importance in this study is the division of Sri Lanka into four main regions and then the
examination of rainfall trends using reconstructed precipitation data using satellite estimates and location data.
The fact that the annual rainfall trend results show that no negative trends shows for any region of Sri Lanka
Kendall’s tau and Sen’s flow and p values also represent that there is a significant positive trend everywhere in
the country. When study the seasonal rainfall trend, It is clear that all zones show significant trends for rainfall
only during the Yala season (Southwestern monsoon). Long-term (30 Years) precipitation studies show that
there is no significant change in rainfall during the Maha season (Southwestern monsoon).
Furthermore, in terms of agricultural and seasonal rainfall trends, it is evident that the tendency to add
more water to the river basins of all regions increases during the Yala season. This tendency is much higher in
SD-01 compare to all other. In addition, droughts in SD-02, SD-03 and SD-04 regions can be minimized by
Analysis of Long-Term Rainfall Trends in Sri Lanka Using CHRIPS Estimates.
Multidisciplinary Journal www.ajmrd.com Page | 42
utilizing the increased rainfall during the Yala season, especially during the Maha season. Finally, it is
recommended that a detailed and fine-scale analysis be performed using satellite-estimated precipitation data
that bias corrects with gauge data to achieve much better results.
REFERENCES
[1]. A. Ampitiyawatta and S. Guo, (200). “Precipitation trends in the Kalu Ganga basin in Sri Lanka,”
Journal of Agricultural Sciences, vol. 4, no. 1, pp. 10–18.
A. J. Robson, (2002). “Evidence for trends in UK flooding,” Philosophical Transactions of the Royal
Society of London. Series A: Mathematical, Physical and Engineering Sciences, vol. 360, no. 1796, pp.
1327–1343.
[2]. J. Robson, T. K. Jones, D. W. Reed, and A. C. Bayliss, (1998). “A study of national trend and variation
in UK floods,” International Journal of Climatology, vol. 18, no. 2, pp. 165–182.
[3]. Kay, R. Jones, and N. Reynard, (2006). “RCM rainfall for UK flood frequency estimation. II. Climate
change results,” Journal of Hydrology, vol. 318, no. 1–4, pp. 163–172.
[4]. Mondal, S. Kundu, and A. Mukhopadhyay, (2012). “Rainfall trend analysis by Mann-Kendall test: a
case study of north-eastern part of Cuttack district, Orissa,” International Journal of Geology, Earth and
Environmental Sciences, vol. 2, no. 1, pp. 70–78.
[5]. Soja, N. Tchebakova, N. French et al., (2007). “Climate-induced boreal forest change: predictions
versus current observations,” Global and Planetary Change, vol. 56, no. 3-4, pp. 274–296.
[6]. Spence, W. Poortinga, and N. Pidgeon, (2011). “The psychological distance of climate change,” Risk
Analysis, vol. 32, no. 6, pp. 957–972.
[7]. A. Malmgren, R. Hulugalla, Y. Hayashi, and T. Mikami, (2003). “Precipitation trends in Sri Lanka
since the 1870s and relationships to El Niño-Southern oscillation,” International Journal of
Climatology, vol. 23, no. 10, pp. 1235–1252.
[8]. Khaniya, H. G. Priyantha, N. Baduge, H. M. Azamathulla, and U. Rathnayake, (2018). “Impact of
climate variability on hydropower generation: a case study from Sri Lanka,” ISH Journal of Hydraulic
Engineering, pp. 1–9.
[9]. Prudhomme, D. Jakob, and C. Svensson, (2003). “Uncertainty and climate change impact on the flood
regime of small UK catchments,” Journal of Hydrology, vol. 277, no. 1-2, pp. 1–23.
[10]. Tebaldi and R. Knutti, (2007) “The use of the multi-model ensemble in probabilistic climate
projections,” Philosophical Transactions of the Royal Society A: Mathematical, Physical and
Engineering Sciences, vol. 365, no. 1857, pp. 053–2075.
[11]. R. Easterling, G. Meehl, C. Parmesan, S. Changnon, T. Karl, and L. Mearns, (2000). “Climate
extremes: observations, modeling, and impacts”, Science, vol. 289, no. 5487, pp. 2068–2074.
[12]. E.N.C. Perera, D. T. Jayawardana, and P. Jayasinghe, (2017). A Rainfall Intensity-Duration Threshold
for Mass Movement in Badulla, Sri Lanka. Journal of Geoscience and Environment Protection 5, 135–
152. Doi: 10.4236/gep.2017.512010.
[13]. Ranatunge, B. Malmgren, Y. Hayashi et al., (2003). “Changes in the southwest monsoon mean daily
rainfall intensity in Sri Lanka: relationship to the El Niño-Southern Oscillation,” Paleogeography,
Paleoclimatology, Paleoecology, vol. 197, no. 1-2, pp. 1–14.
[14]. U. Weber and P. C. Stern, (2011). “Public understanding of climate change in the United States,”
American Psychologist, vol. 66, no. 4, pp. 315–328.
[15]. S. Chapin, E. S. Zavaleta, V. T. Eviner, (2000). “Consequences of changing biodiversity,” Nature, vol.
405, no. 6783, pp. 234–242.
[16]. Lindstrom, (1999). “Trends and variability in Swedish floods,” in Proceedings of the IUGG,
Hydrological Extremes: Understanding, Predicting, Mitigating, pp. 91–98, IHS Publications,
Birmingham, UK.
[17]. G.R. Walther, E. Post, P. Convey, (2002). “Ecological responses to recent climate change,” Nature,
vol. 416, no. 6879, pp. 389–395.
[18]. Alexandersson, (1986). “A homogeneity test applied to precipitation data,” Journal of Climatology,
vol. 6, no. 6, pp. 661–675.
[19]. Alexandersson and A. Moberg, (1997). “Homogenization of Swedish temperature data. Part I:
homogeneity test for linear trends,” International Journal of Climatology, vol. 17, no. 1, pp. 25–34.
[20]. H. B. Mann, (1945). “Nonparametric tests against trend,” Econometrica, vol. 13, no. 3, pp. 245–259.
[21]. H. F. Lins and J. R. Slack, (1999). “Streamflow trends in the United States,” Geophysical Research
Letters, vol. 26, no. 2, pp. 227– 230.
[22]. H. Jayawardene, D. Sonnadara, and D. Jayewardene, (2005). “Trends of rainfall in Sri Lanka over the
last century,” Sri Lankan Journal of Physics, vol. 6, pp. 7–17.
Analysis of Long-Term Rainfall Trends in Sri Lanka Using CHRIPS Estimates.
Multidisciplinary Journal www.ajmrd.com Page | 43
[23]. H. Jayawardene, D. Jayewardene, and D. Sonnadara, (2015). “Interannual variability of precipitation in
Sri Lanka,” Journal of the National Science Foundation of Sri Lanka, vol. 43, no. 1, pp. 75–82.
[24]. H. Wang, Z. Yang, Y. Saito, J. Liu, X. Sun, and Y. Wang, (2007). “Stepwise decreases of the Huanghe
(Yellow River) sediment load (1950–2005): impacts of climate change and human activities,” Global
and Planetary Change, vol. 57, no. 3-4, pp. 331–354.
[25]. Lorenzoni, S. Nicholson-Cole, and L. Whitmarsh, (2007). “Barriers perceived to engaging with climate
change among the UK public and their policy implications,” Global Environmental Change, vol. 17,
no. 3-4, pp. 445–459.
[26]. IPCC (Intergovernmental Panel on Climate Change) (2007) Summary for policymakers. In: Climate
Change 2007: The Physical Science Basis (ed. by S. Solomon, D. Qin, M. Manning, Z. Chen, M.
Marquis, K. B. Averyt, M. Tignor & H. L. Miller). Cambridge University Press, UK.
[27]. IPCC, 2013: Climate Change 2013: The Physical Science Basis, Contribution of Working Group I to
the Fifth Assessment Report of the Intergovernmental Panel on Climate Change [Stocker, T.F., D.Qin,
G.-K. Plattner, M, Tignor, S.K. Allen, J.Boschung,A. Nauels, Y.Xia, V. Bex and P.M. Midgley (eds.)].
Cambridge University Ores, Cambridge, United Kingdom and New York, NY, USA, 1535pp.
[28]. IPPC, 2014: Climate Change 2014: Impacts, Adaptation, and Vulnerability. Part A: Global and
Sectoral Aspects, Contribution of Working Group II to the Contribution of Working Group II to the
Fifth Assessment Report of the Intergovernmental Panel on Climate Change [Field, C.B., Barros, V.R.,
D.J. Dokken, K.J. Mach, M.D. Mastrandrea, T.E. Bilir, M. Chatterjee, K.L. Ebi, Y.O. Estrada, R.C.
Genova, B. Girma, E.S. Kissel, A.N. Levy, S. MacCracken, P.R. Mastrendrea, and L.L. White (eds.)].
Cambridge University Ores, Cambridge, United Kingdom and New York, NY, USA, 1132pp.
[29]. IPPC, 2014: Climate Change 2014: Impacts, Adaptation, and Vulnerability. Part B: Regional Aspects,
Contribution of Working Group II to the Contribution of Working Group I to the Fifth Assessment
Report of the Intergovernmental Panel on Climate Change [Barros, V.R., C.B. Field,D.J. Dokken,
M.D. Mastrandrea, K.J. Mach, T.E. Bilir, M. Chatterjee, K.L. Ebi, Y.O. Estrada, R.C. Genova, B.
Girma, E.S. Kissel, A.N. Levy, S. MacCracken, P.R. Mastrendrea, and L.L. White (eds.)]. Cambridge
University Ores, Cambridge, United Kingdom and New York, NY, USA, 688pp.
[30]. B. Wijngaard, A. M. G. Klein Tank, and G. P. K¨onnen, (2003). “Homogeneity of 20th century
European daily temperature and precipitation series,” International Journal of Climatology, vol. 23, no.
6, pp. 679–692.
[31]. J. P. Schuldt, S. H. Konrath, and N. Schwarz, (2011). “Global warming” or “climate change”?:
Whether the planet is warming depends on question wording,” Public Opinion Quarterly, vol. 75, no. 1,
pp. 115–124.
[32]. Guowei and W. Jingpeng, (1999) “A study of extreme floods in China for the past 100years,” in
Proceedings of the IUGG, Hydrological Extremes: Understanding, Predicting, Mitigating, pp. 109–119.
[33]. Wijemannage, E.N.C. Perera, (2018). Comparison of spatial Interpolation Methods for Rainfall data
over Sri Lank. Asian Conference in Remote Sensing, 17-21 October, Colombo: Asian Association on
Remote Sensing.
[34]. Du, S. Kawashima, S. Yonemura, X. Zhang, and S. Chen, (2004). “Mutual influence between human
activities and climate change in the Tibetan Plateau during recent years,” Global and Planetary Change,
vol. 41, no. 3-4, pp. 241–249.
[35]. M. H. I. Dore (2005) Climate change and changes in global precipitation patterns: What do we know?
Environ. Int. 31, 1167–1181.
[36]. M. Kendall, (1975).Rank Correlation Methods, Charles Griffin & Co. Ltd., London, UK, 4th edition.
[37]. M. N. Khaliq and T. B. M. J. Ouarda, (2007). “On the critical values of the standard normal
homogeneity test (SNHT),” International Journal of Climatology, vol. 27, no. 5, pp. 681–687.
[38]. Oreskes, (2004). The scientific consensus on climate change,” Science, vol. 306, no. 5702, p. 1686.
[39]. N. Alahacoon, K. Matheswaran, P. Pani, G. Amarnath, (2018). A Decadal Historical Satellite Data and
Rainfall Trend Analysis (2001–2016) for Flood Hazard Mapping in Sri Lanka. Remote Sens, 10, 448.
[40]. N. Hofstra, M. Haylock, M. New, and P. Jones, (2009). “Testing E-OBS European high-resolution
gridded data set of daily precipitation and surface temperature,” Journal of Geophysical Research, vol.
114, no. 21, pp. 1–16.
[41]. Christensen and J. Christensen, (2004). “Intensification of extreme European summer precipitation in a
warmer climate,” Global and Planetary Change, vol. 44, no. 1–4, pp. 107–117.
[42]. O. Hoegh-Guldberg and J. F. Bruno, (2010) “The impact of climate change on the world’s marine
ecosystems,” Science, vol. 328, no. 5985, pp. 1523–1528.
[43]. K. Sen, (1968). “Estimates of the regression coefficient based on Kendall’s Tau,” Journal of the
American Statistical Association, vol. 63, no. 324, pp. 1379–1389.
Analysis of Long-Term Rainfall Trends in Sri Lanka Using CHRIPS Estimates.
Multidisciplinary Journal www.ajmrd.com Page | 44
[44]. P. Wickramagamage, (2015). “Spatial and temporal variation of rainfall trends of Sri Lanka,”
Theoretical and Applied Climatology, vol. 125, no. 3-4, pp. 427–438.
[45]. Chandler, (2001).“Irish floods, changing climate and generalized linear models,” Newsletter of British
Hydrological Society, vol. 69, pp. 5–7.
[46]. G. Pearson and T. P. Dawson, (2003). “Predicting the impacts of climate change on the distribution of
species: are bioclimate envelope models useful?,” Global Ecology and Biogeography, vol. 12, no. 5,
pp. 361–371.
[47]. R. Knutti, T. F. Stocker, F. Joos, and G.-K. Plattner, (2002). “Constraints on radiative forcing and
future climate change from observations and climate model ensembles,” Nature, vol. 416, no. 6882, pp.
719–723.
[48]. R. M. Hirsch, J. R. Slack, and R. A. Smith, (1982). “Techniques of trend analysis for monthly water
quality data,” Water Resources Research, vol. 18, no. 1, pp. 107–121.
[49]. R. Suppiah, (1997). “Extremes of the southern oscillation phenomenon and the rainfall of Sri Lanka,”
International Journal of Climatology, vol. 17, no. 1, pp. 87–101.
[50]. Herath and U. Ratnayake, (2004). “Monitoring rainfall trends to predict adverse impacts-a case study
from Sri Lanka (1964–1993),” Global Environmental Change, vol. 14, pp. 71–79.
[51]. S. Sahin and H. K. Cigizoglu, (2010). “Homogeneity analysis of Turkish meteorological data set,”
Hydrological Processes, vol. 24, no. 8, pp. 981–992.
[52]. Buishand, (1982) “Some methods for testing the homogeneity of rainfall records,” Journal of
Hydrology, vol. 58, no. 1-2, pp. 11–27.
[53]. T. R. Karl, “Modern global climate change, (2003). ” Science, vol. 302, no. 5651, pp. 1719–1723.
[54]. N. Adger, S. Huq, K. Brown, D. Conway, and M. Hulme, (2003) “Adaptation to climate change in the
developing world,” Progress in Development Studies, vol. 3, no. 3, pp. 179–195.
[55]. Y. J. Kim, S. D. Eckermann, and H. Y. Chun, (2003). “An overview of the past, present and future of
gravity-wave drag parametrization for numerical climate and weather prediction models,” Atmosphere-
Ocean, vol. 41, no. 1, pp. 65–98.
[56]. Z. Kundzewicz and A. Robson, (2000). “Detecting trend and other changes in hydrological data. world
climate programme data and monitoring, WCDMP-45,” WMO/TD Report no. 1013, World
Meteorological Organization, Geneva, Switzerland.

More Related Content

What's hot

Quick Drought Response Index
Quick Drought Response IndexQuick Drought Response Index
Quick Drought Response IndexDRIscience
 
Tobias_Climate_Analysis_Final_Present
Tobias_Climate_Analysis_Final_PresentTobias_Climate_Analysis_Final_Present
Tobias_Climate_Analysis_Final_PresentJoshua Tobias
 
California Drought Update - Mike Anderson, California State Climatologist, Ca...
California Drought Update - Mike Anderson, California State Climatologist, Ca...California Drought Update - Mike Anderson, California State Climatologist, Ca...
California Drought Update - Mike Anderson, California State Climatologist, Ca...DRIscience
 
Drought Planning: A Long-Term Context
Drought Planning: A Long-Term ContextDrought Planning: A Long-Term Context
Drought Planning: A Long-Term ContextDRIscience
 
CLIMATE CHANGE AND ITS IMPACT ON GROUNDWATER TABLE FLUCTUATION IN PRECAMBRIAN...
CLIMATE CHANGE AND ITS IMPACT ON GROUNDWATER TABLE FLUCTUATION IN PRECAMBRIAN...CLIMATE CHANGE AND ITS IMPACT ON GROUNDWATER TABLE FLUCTUATION IN PRECAMBRIAN...
CLIMATE CHANGE AND ITS IMPACT ON GROUNDWATER TABLE FLUCTUATION IN PRECAMBRIAN...IAEME Publication
 
Arabian journal paper - autor copy final
Arabian journal paper - autor copy finalArabian journal paper - autor copy final
Arabian journal paper - autor copy finalSreedhar Ganapuram
 
Evaluations of Stream Flow Response to Land use and Land Cover Changes in Wab...
Evaluations of Stream Flow Response to Land use and Land Cover Changes in Wab...Evaluations of Stream Flow Response to Land use and Land Cover Changes in Wab...
Evaluations of Stream Flow Response to Land use and Land Cover Changes in Wab...IJCMESJOURNAL
 
Adding Confidence to Seasonal Drought Forecasts using reference evapotranspir...
Adding Confidence to Seasonal Drought Forecasts using reference evapotranspir...Adding Confidence to Seasonal Drought Forecasts using reference evapotranspir...
Adding Confidence to Seasonal Drought Forecasts using reference evapotranspir...DRIscience
 
Presentation flood
Presentation floodPresentation flood
Presentation floodAmitSaha123
 
Understanding the Kerala Floods of 2018: Role of Mixed Rossby-Gravity Waves
Understanding the Kerala Floods of 2018: Role of Mixed Rossby-Gravity WavesUnderstanding the Kerala Floods of 2018: Role of Mixed Rossby-Gravity Waves
Understanding the Kerala Floods of 2018: Role of Mixed Rossby-Gravity WavesS Kiran
 
A rank reduced analysis of runoff components and their response patterns to ...
A rank  reduced analysis of runoff components and their response patterns to ...A rank  reduced analysis of runoff components and their response patterns to ...
A rank reduced analysis of runoff components and their response patterns to ...Alexander Decker
 
Assessment of climate change impact on water availability of bilate watershed...
Assessment of climate change impact on water availability of bilate watershed...Assessment of climate change impact on water availability of bilate watershed...
Assessment of climate change impact on water availability of bilate watershed...Alexander Decker
 
Climatological atmospheric dilution indices
Climatological atmospheric dilution indicesClimatological atmospheric dilution indices
Climatological atmospheric dilution indicesECRD IN
 
Climatological atmospheric dilution indices
Climatological atmospheric dilution indicesClimatological atmospheric dilution indices
Climatological atmospheric dilution indicesECRD2015
 
Assessment of climate change impacts on water balance components of Heeia wat...
Assessment of climate change impacts on water balance components of Heeia wat...Assessment of climate change impacts on water balance components of Heeia wat...
Assessment of climate change impacts on water balance components of Heeia wat...Kariem Ghazal
 

What's hot (20)

Quick Drought Response Index
Quick Drought Response IndexQuick Drought Response Index
Quick Drought Response Index
 
Uncertainty in Climate Change Projections: Results from Different GCMs/RCMs i...
Uncertainty in Climate Change Projections: Results from Different GCMs/RCMs i...Uncertainty in Climate Change Projections: Results from Different GCMs/RCMs i...
Uncertainty in Climate Change Projections: Results from Different GCMs/RCMs i...
 
Watergauges
WatergaugesWatergauges
Watergauges
 
Tobias_Climate_Analysis_Final_Present
Tobias_Climate_Analysis_Final_PresentTobias_Climate_Analysis_Final_Present
Tobias_Climate_Analysis_Final_Present
 
huber_2011_RSE
huber_2011_RSEhuber_2011_RSE
huber_2011_RSE
 
California Drought Update - Mike Anderson, California State Climatologist, Ca...
California Drought Update - Mike Anderson, California State Climatologist, Ca...California Drought Update - Mike Anderson, California State Climatologist, Ca...
California Drought Update - Mike Anderson, California State Climatologist, Ca...
 
Drought Planning: A Long-Term Context
Drought Planning: A Long-Term ContextDrought Planning: A Long-Term Context
Drought Planning: A Long-Term Context
 
Abderrahim
AbderrahimAbderrahim
Abderrahim
 
CLIMATE CHANGE AND ITS IMPACT ON GROUNDWATER TABLE FLUCTUATION IN PRECAMBRIAN...
CLIMATE CHANGE AND ITS IMPACT ON GROUNDWATER TABLE FLUCTUATION IN PRECAMBRIAN...CLIMATE CHANGE AND ITS IMPACT ON GROUNDWATER TABLE FLUCTUATION IN PRECAMBRIAN...
CLIMATE CHANGE AND ITS IMPACT ON GROUNDWATER TABLE FLUCTUATION IN PRECAMBRIAN...
 
Arabian journal paper - autor copy final
Arabian journal paper - autor copy finalArabian journal paper - autor copy final
Arabian journal paper - autor copy final
 
Evaluations of Stream Flow Response to Land use and Land Cover Changes in Wab...
Evaluations of Stream Flow Response to Land use and Land Cover Changes in Wab...Evaluations of Stream Flow Response to Land use and Land Cover Changes in Wab...
Evaluations of Stream Flow Response to Land use and Land Cover Changes in Wab...
 
Adding Confidence to Seasonal Drought Forecasts using reference evapotranspir...
Adding Confidence to Seasonal Drought Forecasts using reference evapotranspir...Adding Confidence to Seasonal Drought Forecasts using reference evapotranspir...
Adding Confidence to Seasonal Drought Forecasts using reference evapotranspir...
 
Ijciet 10 01_065
Ijciet 10 01_065Ijciet 10 01_065
Ijciet 10 01_065
 
Presentation flood
Presentation floodPresentation flood
Presentation flood
 
Understanding the Kerala Floods of 2018: Role of Mixed Rossby-Gravity Waves
Understanding the Kerala Floods of 2018: Role of Mixed Rossby-Gravity WavesUnderstanding the Kerala Floods of 2018: Role of Mixed Rossby-Gravity Waves
Understanding the Kerala Floods of 2018: Role of Mixed Rossby-Gravity Waves
 
A rank reduced analysis of runoff components and their response patterns to ...
A rank  reduced analysis of runoff components and their response patterns to ...A rank  reduced analysis of runoff components and their response patterns to ...
A rank reduced analysis of runoff components and their response patterns to ...
 
Assessment of climate change impact on water availability of bilate watershed...
Assessment of climate change impact on water availability of bilate watershed...Assessment of climate change impact on water availability of bilate watershed...
Assessment of climate change impact on water availability of bilate watershed...
 
Climatological atmospheric dilution indices
Climatological atmospheric dilution indicesClimatological atmospheric dilution indices
Climatological atmospheric dilution indices
 
Climatological atmospheric dilution indices
Climatological atmospheric dilution indicesClimatological atmospheric dilution indices
Climatological atmospheric dilution indices
 
Assessment of climate change impacts on water balance components of Heeia wat...
Assessment of climate change impacts on water balance components of Heeia wat...Assessment of climate change impacts on water balance components of Heeia wat...
Assessment of climate change impacts on water balance components of Heeia wat...
 

Similar to F2113444

Trend analysis of seasonal rainfall and temperature pattern in Kalahandi, Bol...
Trend analysis of seasonal rainfall and temperature pattern in Kalahandi, Bol...Trend analysis of seasonal rainfall and temperature pattern in Kalahandi, Bol...
Trend analysis of seasonal rainfall and temperature pattern in Kalahandi, Bol...DEGU ZEWDU
 
Rainfall Trends and Variability in Tamil Nadu (1983 - 2012): Indicator of Cli...
Rainfall Trends and Variability in Tamil Nadu (1983 - 2012): Indicator of Cli...Rainfall Trends and Variability in Tamil Nadu (1983 - 2012): Indicator of Cli...
Rainfall Trends and Variability in Tamil Nadu (1983 - 2012): Indicator of Cli...IJESM JOURNAL
 
Seasonal and annual precipitation time series trend analysis in NC USA.pdf
Seasonal and annual precipitation time series trend analysis in NC USA.pdfSeasonal and annual precipitation time series trend analysis in NC USA.pdf
Seasonal and annual precipitation time series trend analysis in NC USA.pdfSayem Zaman, Ph.D, PE.
 
Analysis of rainfall trends in akwa ibom state, nigeria
Analysis of rainfall trends in akwa ibom state, nigeriaAnalysis of rainfall trends in akwa ibom state, nigeria
Analysis of rainfall trends in akwa ibom state, nigeriaAlexander Decker
 
Time Series Analysis of Rainfall in North Bangalore Metropolitan Region using...
Time Series Analysis of Rainfall in North Bangalore Metropolitan Region using...Time Series Analysis of Rainfall in North Bangalore Metropolitan Region using...
Time Series Analysis of Rainfall in North Bangalore Metropolitan Region using...Dr Ramesh Dikpal
 
Perceived and actual rainfall trends and variability in eastern uganda implic...
Perceived and actual rainfall trends and variability in eastern uganda implic...Perceived and actual rainfall trends and variability in eastern uganda implic...
Perceived and actual rainfall trends and variability in eastern uganda implic...Alexander Decker
 
Identification of three_dominant_rainfall_regions_
Identification of three_dominant_rainfall_regions_Identification of three_dominant_rainfall_regions_
Identification of three_dominant_rainfall_regions_Lasriama Siahaan
 
29 report spatial_temporal_distribution_of_temperature_crop_agriculture_full
29 report spatial_temporal_distribution_of_temperature_crop_agriculture_full29 report spatial_temporal_distribution_of_temperature_crop_agriculture_full
29 report spatial_temporal_distribution_of_temperature_crop_agriculture_fullcaltec
 
IRJET- Rainfall Analysis-A Review
IRJET- Rainfall Analysis-A ReviewIRJET- Rainfall Analysis-A Review
IRJET- Rainfall Analysis-A ReviewIRJET Journal
 
Assessment of Rural Communities' Adaptive Capacity to Climate Change in Kadun...
Assessment of Rural Communities' Adaptive Capacity to Climate Change in Kadun...Assessment of Rural Communities' Adaptive Capacity to Climate Change in Kadun...
Assessment of Rural Communities' Adaptive Capacity to Climate Change in Kadun...Dr Adamu Abdulhamed
 
Drought Index Analizes With Rainfall Patern Indicators Use SPI Method (Case S...
Drought Index Analizes With Rainfall Patern Indicators Use SPI Method (Case S...Drought Index Analizes With Rainfall Patern Indicators Use SPI Method (Case S...
Drought Index Analizes With Rainfall Patern Indicators Use SPI Method (Case S...IJERA Editor
 
Hydroclimatological assessment of Jawi River Basin, Malaysia
Hydroclimatological assessment of Jawi River Basin, MalaysiaHydroclimatological assessment of Jawi River Basin, Malaysia
Hydroclimatological assessment of Jawi River Basin, Malaysiaijtsrd
 
Tesfaye Samuel Presentation- MERGED.pptx
Tesfaye Samuel Presentation- MERGED.pptxTesfaye Samuel Presentation- MERGED.pptx
Tesfaye Samuel Presentation- MERGED.pptxTesfaye Samuel
 
Spatial and seasonal variations in rainfall and temperature across Nigeria | ...
Spatial and seasonal variations in rainfall and temperature across Nigeria | ...Spatial and seasonal variations in rainfall and temperature across Nigeria | ...
Spatial and seasonal variations in rainfall and temperature across Nigeria | ...Innspub Net
 
Inundation and Hazard Mapping on River Asa, using GIS
Inundation and Hazard Mapping on River Asa, using GISInundation and Hazard Mapping on River Asa, using GIS
Inundation and Hazard Mapping on River Asa, using GISOyeniyi Samuel
 

Similar to F2113444 (20)

Trend analysis of seasonal rainfall and temperature pattern in Kalahandi, Bol...
Trend analysis of seasonal rainfall and temperature pattern in Kalahandi, Bol...Trend analysis of seasonal rainfall and temperature pattern in Kalahandi, Bol...
Trend analysis of seasonal rainfall and temperature pattern in Kalahandi, Bol...
 
Rainfall Trends and Variability in Tamil Nadu (1983 - 2012): Indicator of Cli...
Rainfall Trends and Variability in Tamil Nadu (1983 - 2012): Indicator of Cli...Rainfall Trends and Variability in Tamil Nadu (1983 - 2012): Indicator of Cli...
Rainfall Trends and Variability in Tamil Nadu (1983 - 2012): Indicator of Cli...
 
Seasonal and annual precipitation time series trend analysis in NC USA.pdf
Seasonal and annual precipitation time series trend analysis in NC USA.pdfSeasonal and annual precipitation time series trend analysis in NC USA.pdf
Seasonal and annual precipitation time series trend analysis in NC USA.pdf
 
Analysis of rainfall trends in akwa ibom state, nigeria
Analysis of rainfall trends in akwa ibom state, nigeriaAnalysis of rainfall trends in akwa ibom state, nigeria
Analysis of rainfall trends in akwa ibom state, nigeria
 
B1303010612
B1303010612B1303010612
B1303010612
 
1 (1)
1 (1)1 (1)
1 (1)
 
Time Series Analysis of Rainfall in North Bangalore Metropolitan Region using...
Time Series Analysis of Rainfall in North Bangalore Metropolitan Region using...Time Series Analysis of Rainfall in North Bangalore Metropolitan Region using...
Time Series Analysis of Rainfall in North Bangalore Metropolitan Region using...
 
Perceived and actual rainfall trends and variability in eastern uganda implic...
Perceived and actual rainfall trends and variability in eastern uganda implic...Perceived and actual rainfall trends and variability in eastern uganda implic...
Perceived and actual rainfall trends and variability in eastern uganda implic...
 
Identification of three_dominant_rainfall_regions_
Identification of three_dominant_rainfall_regions_Identification of three_dominant_rainfall_regions_
Identification of three_dominant_rainfall_regions_
 
29 report spatial_temporal_distribution_of_temperature_crop_agriculture_full
29 report spatial_temporal_distribution_of_temperature_crop_agriculture_full29 report spatial_temporal_distribution_of_temperature_crop_agriculture_full
29 report spatial_temporal_distribution_of_temperature_crop_agriculture_full
 
1_Asokan and Dutta_HP_2008
1_Asokan and Dutta_HP_20081_Asokan and Dutta_HP_2008
1_Asokan and Dutta_HP_2008
 
IRJET- Rainfall Analysis-A Review
IRJET- Rainfall Analysis-A ReviewIRJET- Rainfall Analysis-A Review
IRJET- Rainfall Analysis-A Review
 
Assessment of Rural Communities' Adaptive Capacity to Climate Change in Kadun...
Assessment of Rural Communities' Adaptive Capacity to Climate Change in Kadun...Assessment of Rural Communities' Adaptive Capacity to Climate Change in Kadun...
Assessment of Rural Communities' Adaptive Capacity to Climate Change in Kadun...
 
Drought Index Analizes With Rainfall Patern Indicators Use SPI Method (Case S...
Drought Index Analizes With Rainfall Patern Indicators Use SPI Method (Case S...Drought Index Analizes With Rainfall Patern Indicators Use SPI Method (Case S...
Drought Index Analizes With Rainfall Patern Indicators Use SPI Method (Case S...
 
Sanogo paris2015-poster
Sanogo paris2015-posterSanogo paris2015-poster
Sanogo paris2015-poster
 
Hydroclimatological assessment of Jawi River Basin, Malaysia
Hydroclimatological assessment of Jawi River Basin, MalaysiaHydroclimatological assessment of Jawi River Basin, Malaysia
Hydroclimatological assessment of Jawi River Basin, Malaysia
 
Tesfaye Samuel Presentation- MERGED.pptx
Tesfaye Samuel Presentation- MERGED.pptxTesfaye Samuel Presentation- MERGED.pptx
Tesfaye Samuel Presentation- MERGED.pptx
 
Spatial and seasonal variations in rainfall and temperature across Nigeria | ...
Spatial and seasonal variations in rainfall and temperature across Nigeria | ...Spatial and seasonal variations in rainfall and temperature across Nigeria | ...
Spatial and seasonal variations in rainfall and temperature across Nigeria | ...
 
Heavy rainfall northeast india
Heavy rainfall northeast indiaHeavy rainfall northeast india
Heavy rainfall northeast india
 
Inundation and Hazard Mapping on River Asa, using GIS
Inundation and Hazard Mapping on River Asa, using GISInundation and Hazard Mapping on River Asa, using GIS
Inundation and Hazard Mapping on River Asa, using GIS
 

More from ajmrdjournals (20)

C372122.pdf
C372122.pdfC372122.pdf
C372122.pdf
 
E323741.pdf
E323741.pdfE323741.pdf
E323741.pdf
 
E372731.pdf
E372731.pdfE372731.pdf
E372731.pdf
 
G316268.pdf
G316268.pdfG316268.pdf
G316268.pdf
 
D312843.pdf
D312843.pdfD312843.pdf
D312843.pdf
 
D362842.pdf
D362842.pdfD362842.pdf
D362842.pdf
 
G374044.pdf
G374044.pdfG374044.pdf
G374044.pdf
 
D353451.pdf
D353451.pdfD353451.pdf
D353451.pdf
 
E314456.pdf
E314456.pdfE314456.pdf
E314456.pdf
 
F364959.pdf
F364959.pdfF364959.pdf
F364959.pdf
 
C352033.pdf
C352033.pdfC352033.pdf
C352033.pdf
 
A380114.pdf
A380114.pdfA380114.pdf
A380114.pdf
 
B340723.pdf
B340723.pdfB340723.pdf
B340723.pdf
 
H374553.pdf
H374553.pdfH374553.pdf
H374553.pdf
 
D372326.pdf
D372326.pdfD372326.pdf
D372326.pdf
 
C322330.pdf
C322330.pdfC322330.pdf
C322330.pdf
 
B381520.pdf
B381520.pdfB381520.pdf
B381520.pdf
 
C342433.pdf
C342433.pdfC342433.pdf
C342433.pdf
 
C382135.pdf
C382135.pdfC382135.pdf
C382135.pdf
 
C311327.pdf
C311327.pdfC311327.pdf
C311327.pdf
 

Recently uploaded

social pharmacy d-pharm 1st year by Pragati K. Mahajan
social pharmacy d-pharm 1st year by Pragati K. Mahajansocial pharmacy d-pharm 1st year by Pragati K. Mahajan
social pharmacy d-pharm 1st year by Pragati K. Mahajanpragatimahajan3
 
Grant Readiness 101 TechSoup and Remy Consulting
Grant Readiness 101 TechSoup and Remy ConsultingGrant Readiness 101 TechSoup and Remy Consulting
Grant Readiness 101 TechSoup and Remy ConsultingTechSoup
 
IGNOU MSCCFT and PGDCFT Exam Question Pattern: MCFT003 Counselling and Family...
IGNOU MSCCFT and PGDCFT Exam Question Pattern: MCFT003 Counselling and Family...IGNOU MSCCFT and PGDCFT Exam Question Pattern: MCFT003 Counselling and Family...
IGNOU MSCCFT and PGDCFT Exam Question Pattern: MCFT003 Counselling and Family...PsychoTech Services
 
APM Welcome, APM North West Network Conference, Synergies Across Sectors
APM Welcome, APM North West Network Conference, Synergies Across SectorsAPM Welcome, APM North West Network Conference, Synergies Across Sectors
APM Welcome, APM North West Network Conference, Synergies Across SectorsAssociation for Project Management
 
Measures of Dispersion and Variability: Range, QD, AD and SD
Measures of Dispersion and Variability: Range, QD, AD and SDMeasures of Dispersion and Variability: Range, QD, AD and SD
Measures of Dispersion and Variability: Range, QD, AD and SDThiyagu K
 
Key note speaker Neum_Admir Softic_ENG.pdf
Key note speaker Neum_Admir Softic_ENG.pdfKey note speaker Neum_Admir Softic_ENG.pdf
Key note speaker Neum_Admir Softic_ENG.pdfAdmir Softic
 
Ecosystem Interactions Class Discussion Presentation in Blue Green Lined Styl...
Ecosystem Interactions Class Discussion Presentation in Blue Green Lined Styl...Ecosystem Interactions Class Discussion Presentation in Blue Green Lined Styl...
Ecosystem Interactions Class Discussion Presentation in Blue Green Lined Styl...fonyou31
 
Unit-IV- Pharma. Marketing Channels.pptx
Unit-IV- Pharma. Marketing Channels.pptxUnit-IV- Pharma. Marketing Channels.pptx
Unit-IV- Pharma. Marketing Channels.pptxVishalSingh1417
 
1029-Danh muc Sach Giao Khoa khoi 6.pdf
1029-Danh muc Sach Giao Khoa khoi  6.pdf1029-Danh muc Sach Giao Khoa khoi  6.pdf
1029-Danh muc Sach Giao Khoa khoi 6.pdfQucHHunhnh
 
1029 - Danh muc Sach Giao Khoa 10 . pdf
1029 -  Danh muc Sach Giao Khoa 10 . pdf1029 -  Danh muc Sach Giao Khoa 10 . pdf
1029 - Danh muc Sach Giao Khoa 10 . pdfQucHHunhnh
 
SOCIAL AND HISTORICAL CONTEXT - LFTVD.pptx
SOCIAL AND HISTORICAL CONTEXT - LFTVD.pptxSOCIAL AND HISTORICAL CONTEXT - LFTVD.pptx
SOCIAL AND HISTORICAL CONTEXT - LFTVD.pptxiammrhaywood
 
BAG TECHNIQUE Bag technique-a tool making use of public health bag through wh...
BAG TECHNIQUE Bag technique-a tool making use of public health bag through wh...BAG TECHNIQUE Bag technique-a tool making use of public health bag through wh...
BAG TECHNIQUE Bag technique-a tool making use of public health bag through wh...Sapna Thakur
 
microwave assisted reaction. General introduction
microwave assisted reaction. General introductionmicrowave assisted reaction. General introduction
microwave assisted reaction. General introductionMaksud Ahmed
 
fourth grading exam for kindergarten in writing
fourth grading exam for kindergarten in writingfourth grading exam for kindergarten in writing
fourth grading exam for kindergarten in writingTeacherCyreneCayanan
 
Interactive Powerpoint_How to Master effective communication
Interactive Powerpoint_How to Master effective communicationInteractive Powerpoint_How to Master effective communication
Interactive Powerpoint_How to Master effective communicationnomboosow
 
The Most Excellent Way | 1 Corinthians 13
The Most Excellent Way | 1 Corinthians 13The Most Excellent Way | 1 Corinthians 13
The Most Excellent Way | 1 Corinthians 13Steve Thomason
 
BASLIQ CURRENT LOOKBOOK LOOKBOOK(1) (1).pdf
BASLIQ CURRENT LOOKBOOK  LOOKBOOK(1) (1).pdfBASLIQ CURRENT LOOKBOOK  LOOKBOOK(1) (1).pdf
BASLIQ CURRENT LOOKBOOK LOOKBOOK(1) (1).pdfSoniaTolstoy
 
Activity 01 - Artificial Culture (1).pdf
Activity 01 - Artificial Culture (1).pdfActivity 01 - Artificial Culture (1).pdf
Activity 01 - Artificial Culture (1).pdfciinovamais
 

Recently uploaded (20)

social pharmacy d-pharm 1st year by Pragati K. Mahajan
social pharmacy d-pharm 1st year by Pragati K. Mahajansocial pharmacy d-pharm 1st year by Pragati K. Mahajan
social pharmacy d-pharm 1st year by Pragati K. Mahajan
 
Grant Readiness 101 TechSoup and Remy Consulting
Grant Readiness 101 TechSoup and Remy ConsultingGrant Readiness 101 TechSoup and Remy Consulting
Grant Readiness 101 TechSoup and Remy Consulting
 
IGNOU MSCCFT and PGDCFT Exam Question Pattern: MCFT003 Counselling and Family...
IGNOU MSCCFT and PGDCFT Exam Question Pattern: MCFT003 Counselling and Family...IGNOU MSCCFT and PGDCFT Exam Question Pattern: MCFT003 Counselling and Family...
IGNOU MSCCFT and PGDCFT Exam Question Pattern: MCFT003 Counselling and Family...
 
Advance Mobile Application Development class 07
Advance Mobile Application Development class 07Advance Mobile Application Development class 07
Advance Mobile Application Development class 07
 
APM Welcome, APM North West Network Conference, Synergies Across Sectors
APM Welcome, APM North West Network Conference, Synergies Across SectorsAPM Welcome, APM North West Network Conference, Synergies Across Sectors
APM Welcome, APM North West Network Conference, Synergies Across Sectors
 
Measures of Dispersion and Variability: Range, QD, AD and SD
Measures of Dispersion and Variability: Range, QD, AD and SDMeasures of Dispersion and Variability: Range, QD, AD and SD
Measures of Dispersion and Variability: Range, QD, AD and SD
 
Key note speaker Neum_Admir Softic_ENG.pdf
Key note speaker Neum_Admir Softic_ENG.pdfKey note speaker Neum_Admir Softic_ENG.pdf
Key note speaker Neum_Admir Softic_ENG.pdf
 
Ecosystem Interactions Class Discussion Presentation in Blue Green Lined Styl...
Ecosystem Interactions Class Discussion Presentation in Blue Green Lined Styl...Ecosystem Interactions Class Discussion Presentation in Blue Green Lined Styl...
Ecosystem Interactions Class Discussion Presentation in Blue Green Lined Styl...
 
Unit-IV- Pharma. Marketing Channels.pptx
Unit-IV- Pharma. Marketing Channels.pptxUnit-IV- Pharma. Marketing Channels.pptx
Unit-IV- Pharma. Marketing Channels.pptx
 
1029-Danh muc Sach Giao Khoa khoi 6.pdf
1029-Danh muc Sach Giao Khoa khoi  6.pdf1029-Danh muc Sach Giao Khoa khoi  6.pdf
1029-Danh muc Sach Giao Khoa khoi 6.pdf
 
1029 - Danh muc Sach Giao Khoa 10 . pdf
1029 -  Danh muc Sach Giao Khoa 10 . pdf1029 -  Danh muc Sach Giao Khoa 10 . pdf
1029 - Danh muc Sach Giao Khoa 10 . pdf
 
SOCIAL AND HISTORICAL CONTEXT - LFTVD.pptx
SOCIAL AND HISTORICAL CONTEXT - LFTVD.pptxSOCIAL AND HISTORICAL CONTEXT - LFTVD.pptx
SOCIAL AND HISTORICAL CONTEXT - LFTVD.pptx
 
BAG TECHNIQUE Bag technique-a tool making use of public health bag through wh...
BAG TECHNIQUE Bag technique-a tool making use of public health bag through wh...BAG TECHNIQUE Bag technique-a tool making use of public health bag through wh...
BAG TECHNIQUE Bag technique-a tool making use of public health bag through wh...
 
Mattingly "AI & Prompt Design: Structured Data, Assistants, & RAG"
Mattingly "AI & Prompt Design: Structured Data, Assistants, & RAG"Mattingly "AI & Prompt Design: Structured Data, Assistants, & RAG"
Mattingly "AI & Prompt Design: Structured Data, Assistants, & RAG"
 
microwave assisted reaction. General introduction
microwave assisted reaction. General introductionmicrowave assisted reaction. General introduction
microwave assisted reaction. General introduction
 
fourth grading exam for kindergarten in writing
fourth grading exam for kindergarten in writingfourth grading exam for kindergarten in writing
fourth grading exam for kindergarten in writing
 
Interactive Powerpoint_How to Master effective communication
Interactive Powerpoint_How to Master effective communicationInteractive Powerpoint_How to Master effective communication
Interactive Powerpoint_How to Master effective communication
 
The Most Excellent Way | 1 Corinthians 13
The Most Excellent Way | 1 Corinthians 13The Most Excellent Way | 1 Corinthians 13
The Most Excellent Way | 1 Corinthians 13
 
BASLIQ CURRENT LOOKBOOK LOOKBOOK(1) (1).pdf
BASLIQ CURRENT LOOKBOOK  LOOKBOOK(1) (1).pdfBASLIQ CURRENT LOOKBOOK  LOOKBOOK(1) (1).pdf
BASLIQ CURRENT LOOKBOOK LOOKBOOK(1) (1).pdf
 
Activity 01 - Artificial Culture (1).pdf
Activity 01 - Artificial Culture (1).pdfActivity 01 - Artificial Culture (1).pdf
Activity 01 - Artificial Culture (1).pdf
 

F2113444

  • 1. American Journal of Multidisciplinary Research & Development (AJMRD) Volume 2, Issue 11 (November- 2020), PP 34-44 ISSN: 2360-821X www.ajmrd.com Multidisciplinary Journal www.ajmrd.com Page | 34 Research Paper Open Access Analysis of Long-Term Rainfall Trends in Sri Lanka Using CHRIPS Estimates. A.G. Amarasinghe, Head, Department of Geography, University of Kelaniya, Dalugama, Sri Lanka. ABSTRACT:- For a country like Sri Lanka where food security and the economy depend on timely water availability, it is extremely important to study rainfall trends. In this work, monthly, seasonal and annual rainfall trends were studied using a series of 30-year (1989-2019) monthly data for 30 sub-visions (sub-regions) of Sri Lanka. The uniqueness of this study is the use of daily raster data generated by mixing satellite estimates and location data (CRIPS) instead of traditional spatial rainfall measurements. In addition, the study was conducted by dividing Sri Lanka into four main areas (sub-divisions) considering the climatic and geographical factors of the country rather than finding out whether there is a significant trend in rainfall by the district level. These sub- divisions were named as SD-01, SD-02, SD-03 and SD-04. The main statistical method used in the study was the Man-Kandall and Sen’s slope, which looked at whether the incidence of annual, seasonal and monthly rainfall was significantly reduced or increased. According to this analysis, all sub-divisions show an increasing tendency for annual rainfall, all of which were statistically significant. That is to say, the most important factor reflected in the last 30 years is the increase in annual rainfall in all parts of Sri Lanka. The special feature of the monsoon (southwest and northeast) in Sri Lanka is that it shows a significant trend of southwest rainfall but cannot be identified during the northeast. The study further exaggerated the long-term precipitation trend for each month using only monthly rainfall data. In doing so, it appears that not all four major areas show a significant trend except few months. In this regard, significant trends can be identified in March, August and September for SD-01, while significant trends in SD-02 and SD-03 can be seen in March, but no significant trend in any of the months can be identified in SD-04. It is further suggested that a small scale study should be carried out to study the trend of monthly rainfall. Key words: Rainfall, Satellite, Significant, Sub-Divisions, Trend I. INTRODUCTION Global average rainfall is forecast to increase, but increases and decreases on a regional and continental scale are expected (Dor, 2005). More or less rainfall or changes in its spatial and seasonal distribution will affect the spatial and temporal distribution of overflow, soil moisture and groundwater reserves, as well as the frequency of droughts and floods. According to the forecasts of the Intergovernmental Panel on Climate Change (IPCC) changes of the global climate will affect agriculture, increase the risk of famine and water scarcity, and cause glaciers to melt more rapidly (IPCC, 2007, 2013 and 2014). Freshwater in some river basins in Sri Lanka have already been depleted due to climate change. This decline, along with population growth and rising living standards, could adversely affect many people in Sri Lanka by the 2050s. Rapid glacial melting causes increased risk factors for flooding, slope destabilization, and reduced river flow (IPCC, 2007). Both Climate change or climate variability are not myths and there is ample evidence to support them (Adger, et al., 2002; Schuldt et al., 2011; Spence et al., 2011; Weber et al., 2011). Many researchers believe that human interactions have accelerated climate change (Chapin, et al., 2000; Hoegh- Guldberg and Bruno, 2010; Karl, 2003; Pearson and Dawson, 2003; Walther et al., 2002). Although climate variability is only one possibility, many as global warming (Schuldt et al., 2011), often refer to climate variability. Observations (Easterling et al., 2000; Knutti et al., 2002; Soja et al., 2007) and theoretical models (Karl, 2003; Kim et al., 2003; Tebaldi et al., 2007) are mainly used to understand current and future climate variables.
  • 2. Analysis of Long-Term Rainfall Trends in Sri Lanka Using CHRIPS Estimates. Multidisciplinary Journal www.ajmrd.com Page | 35 Climate variability can be identified as function of changes in rainfall and atmospheric temperature, slow winds, and acidification of the ocean. Atmospheric temperature and precipitation have also been identified by various studies as the two most sensitive factors for people. Changes in rainfall are one of the most important factors determining the overall impact of climate change, and it is clear that it affects society in a very big way. Various researchers have predicted that warmer climates will intensify rainfall (Christensen and J. Christensen, 2004). This is most evident in the fact that more intense rainfall (precipitation) events can be identified after the onset of drier intervals. Other researchers have argued that the effects of climate change cannot be measured by regional rainfall over natural fluctuations (Chandler, 2001; Guowei and Jingpeng, 1999; Kundzewicz and Robson, 2000; Lindstrom, 1999; Lins, 1999; Robson, 2000; Robson, 2002; Robson, 1998). However, some cases show a strong correlation between human activity and climate change (Kawashima et al., 2004; Oreskes, 2004; Wang et al., 2007). Studies have shown that the unequal floods in England and Wales in the fall of 2000 were man-made (Jones and Reynard, 2006; Lorenzoni et al., 2007; Prudhomme et al., 2003). Rainfall trend analysis was carried out in several important catchment areas of Sri Lanka. According to Jayawardena and others. The average annual rainfall in Colombo, Sri Lanka is a significant annual increase of 3.15 mm, while the other cities, Kandy and Nuwara Eliya, experience an annual decrease of 2.88 and 4.87, respectively (Jayawardene et al, 2005). Literature, It can be seen that a number of other researches have conducted precipitation research in many other important areas of Sri Lanka (Ampitiyawatta and Guo, 2010; Herath and Ratnayake, 2004; Jayawardene et al., 2015; Malmgren et al., 2003; Ranatunge et al., 2003; Suppiah, 1997; Wickramagamage, 2015). However, the literature does not show that a precipitation trend analysis has been carried out based on satellite rainfall estimates at the district/regional level in Sri Lanka. Only (Alahacoon et al., 2018) done a basin level rainfall trend analysis using satellite estimated rainfall data. This study primarily focuses on conducting Sub-Division (SD-01 to SD-04) precipitation analysis using monthly rainfall data. Based on such studies, it is possible to identify if there is a shortage of water in the catchments. In order to carry out homogeneity tests, it is important in daily rainfall measurements to ensure that data are recorded daily at the same time with the same equipment in the same location (Sahin and Cigizoglu, 2010: Perera et al., 2017; Wijemannage and Perera, 2018). However, recording daily rainfall measurements over long time intervals (such as 30 years or 100 years) can be tedious because the measurement patterns have changed over time, the measuring instruments have been re-installed, and so on. As literature explain by (Alexandersson and Moberg, 1997; Khaliq and Ouarda, 2007; Sahin and Cigizoglu, 2010; Wijngaard, 2003; Alexandersson, 1986; Buishand, 1982; Haylock et al., 2009) there are many homogeneity tests used to correct the rainfall data. The best answer to all the problems analyzed above is to use satellite estimate rainfall data. Study Area Sri Lanka is an island in the Indian Ocean southwest of the Bay of Bengal, between latitudes 5 ° and 10 N and longitudes 79 ° and 82 E. The island consists mostly of flat, rolling coastal plains and with south-central mountains. The rainfall pattern is affected by two monsoon winds in the Indian Ocean and the Bay of Bengal. Sri Lanka is divided into three main climatic zones, namely the "wet zone", the "dry zone" and the "semi-arid zone". The "wet zone" and southwesterly windy slopes of the country hills receive an average of 2,500 mm of rainfall each year. Most of the "dry zone" in the eastern, southeastern and northern parts of Sri Lanka receives between 1,200 and 1,900 mm of rainfall. This precipitation is mainly due to the northeast monsoon winds. Similarly, the semi-arid northwestern and southeastern coasts receive the minimum rainfall of 800 to 1200 mm. Major monsoons are known as the Northeast Monsoon and the Southwest Monsoon distributed in December to February and May to September in each year. In addition, there are two intermittent monsoons between the two seasons: the 1st intermediate season from March to April and the 2nd intermediate monsoon from October to November. When consider the cultivation period it is aggregated as Yala (April to August) season and Maha season (October to February). 103 rivers are formed in Sri Lanka with the help of the monsoon winds and central mountains described above and cover 103 major and minor river basins. The longest of these rivers is the Mahaweli River which stretches for 335 km. In terms of administration in Sri Lanka, It is divided into 9 provinces and 25 districts as the main administrative units. Each district is further subdivided into the Divisional Secretariat (DS-Divisions-256) and the Grama Niladhari Division (GN - approximately 16000).
  • 3. Analysis of Long-Term Rainfall Trends in Sri Lanka Using CHRIPS Estimates. Multidisciplinary Journal www.ajmrd.com Page | 36 Figure 1: Sub-Division map of Sri Lanka used in this study. As shown in Figure 1, the study initially divided Sri Lanka into four major regions, taking into account climatic distribution and geographical settings. These were named Sub-division 1 (SD1), Sub-division 2 (SD2), Sub-division 3 (SD3) and Sub-division 4 (SD4). Table 1 below shows the list of districts which are the administrative units included in these sub-divisions (SD1 to SD4).
  • 4. Analysis of Long-Term Rainfall Trends in Sri Lanka Using CHRIPS Estimates. Multidisciplinary Journal www.ajmrd.com Page | 37 Table 1: List of districts fallen in to four different sub-divisions Sub-Division name Districts Sub-Division 01 (SD-01) Colombo, Galle, Ganpaha, Kalutara, Kandy, Kegalle, Rathnapura, Nuvara-Eliya, Matara Sub-Division 02 (SD-02) Ampara, Badulla, Baticaloa, Hambantota, Monaragala Sub-Division 03 (SD-03) Anuradhapura, Matake, Kurunagala, Puttalam, Polonnaruwa, Trinco,alee Sub-Division 04 (SD-04) Jaffna, Kilinochchi, Mannar, Mullaitivu, Vavuniya II. DATA AND METHODOLOGY Mann, (1945) proposed an asymmetric test to analyze the tendencies, while (Kendall, 1975) executed the Mann test. In addition, (Harsh et al., 1982) Seasonal assessment was added to the test. This tendency is now more widely known as the Man-Kendall test for trend analysis. It tests statistically monotonic ups and downs of the climate trends over the time and that test is widely used around the world (Robson, 2002; Khaniya et al., 2018; Mondal et al., 2012). Man-Kendall's statistics Man-Kendall's statistics S is given by the following formula (1): xj and xi are the time series and n is the number of data points in the time series. The sign function "Sgn" can be expressed as follows (2); (2) The calculation of the variables in the Man-Kendall experiment is given by the following equation (3): Where it is the number of bonds specified in the sample i. then, Man-Kendall's statistics Zc are given by the following expressions (4); (4) Zc follows the standard normal distribution. A positive Zc value shows a high (upward) tendency and a negative Zc data gives a low (downward) tendency for the period. Sen’s slope estimation The magnitude of given time trend can be found in Sen's Slope estimator (Sen, 1968). The test is widely used to estimate the magnitude of the propensity for rainfall ranges over time. Slope pairs can be calculated for all data using the following equation (5);
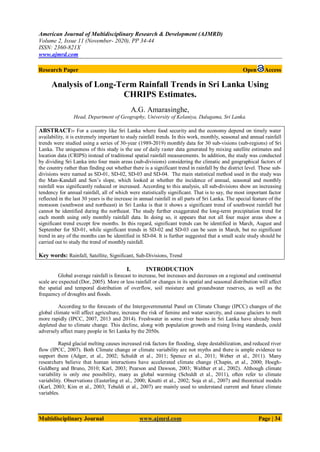
  • 5. Analysis of Long-Term Rainfall Trends in Sri Lanka Using CHRIPS Estimates. Multidisciplinary Journal www.ajmrd.com Page | 38 Where, Ti is the slope and xj and xk are the data values at time j and k, respectively. The mean of the n values of Ti is encoded as Sen,s Slope estimator (Qi) and is calculated using following equation (6); III. DATA Climate Hazards Group Infra-Red Precipitation with Station Data provided (CHIPS) by the Climate Hazard Center, are the basic data used for this study. This data is available as Daily Grinding Rainfall and can be accessed (https://data.chc.ucsb.edu/products/CHIRPS-2.0/) from the web link from 1981 to the present. These data were then converted into monthly rainfall data using the method of daily accumulation sum at monthly basis. Geo-statistical Data Analysis method was apply to completed the above procedure. Finally, the monthly average rainfall value for each area used in the study was calculated by applying the zonal statistical method. IV. RESULTS Figure 2 shows the annual rainfall variation of by province. The spatial and temporal variation of rainfall can be clearly seen in this figure. All of this annual rainfall usually show different patterns with falls and rises and they show an increasing tendency. In addition, all regions except SD-01 received significantly less rainfall in 2016 compared to other years. Therefore, it can be considered as a drought year for them. Tests to show the homogeneity of rainfall data show that the data series are homogeneous for all four sub-divisions. As shown in Figure 2, all of these annual precipitates generally show more or less similar patterns with different annual accumulated rainfall values. For example, SD-01 has the highest annual rainfall and SD-04 shows the lowest annual rainfall. SD-02 and SD-03 represent more or less similar patterns except in 2015, with SD-03 receiving very good rainfall, the bumper crop year of Sri Lanka (Census and Statistics). Figure 2: Representation of Annual rainfall distribution in identified four regions of Sri Lanka
  • 6. Analysis of Long-Term Rainfall Trends in Sri Lanka Using CHRIPS Estimates. Multidisciplinary Journal www.ajmrd.com Page | 39 Table 2: Mann-Kendall and Sen’s slope calculation results for annual rainfall in four regions Geographical region Kendall's tau P values (two-tailed) Significant (Yes)/ Insignificant (No) Sen’s Slope (Qi – mm/year) SD-01 0.589 < 0.0001 Yes 27.610 SD-02 0.290 0.0257 Yes 9.302 SD-03 0.419 0.0012 Yes 14.824 SD-04 0.276 0.0337 Yes 14.404 The results of the trend analysis (Mann-Kendall and Sen’s slope) for the annual rainfall data are shown in Table 2. The table shows a very good trend in annual rainfall for SD-01, SD-02, SD-03 and SD-04 of all the rainfall zones. The most positive precipitation trends in SD-01rainfall measurements can be identified and the less values are shown in SD-03 and SD-04. Although the precipitation value is medium less in the SD-02 division. The annual potential rainfall increase for all of these regions is significant, and the annual precipitation values can be seen from the Sen’s slope. The most important point here is that SD-01 represents about 90% of the wet zone and the highest annual precipitation increase can be identified in this region, which is 27.61 mm / yr. The other peculiarity is that the increase in potential rainfall in Sri Lanka is not negative from the trend analysis. Figure 3: Temporal variation of Annual rainfall according to Mann-Crandall’s and Sen’s slope calculation, a. Sub-Division-01, b. Sub-Division-0, c. Sub-Division-03 and d. Sub-Division-04 This is an interesting finding identified in this study. According to the trend analysis, the catchment area of SD-01 is not subject to severe water scarcity. SD-01 is the main catchment area of Sri Lanka's major rivers Kalu Ganga, Mahaweli Ganga, Kelani Ganga and Walawe Ganga. However, due to the prevalence of this precipitation, SD-01 is most prone to floods. The area has been hit by three major floods (2016, 2017, 2018) in the last four years. This analysis was expanded to identify the impact of seasonal rainfall in addition to the impact of annual rainfall on the water resources of the area in these study zones in Sri Lanka. SD-02 to SD-04, in particular, are famous for their irrigated agriculture and 90% of the total paddy cultivation in the country is done from these regions. Therefore, the analysis of seasonal rainfall trends will be an interesting topic for farmers in the area.
  • 7. Analysis of Long-Term Rainfall Trends in Sri Lanka Using CHRIPS Estimates. Multidisciplinary Journal www.ajmrd.com Page | 40 Table 3: Mann-Kendall and Sen’s slope calculation results for seasonal rainfall in four regions Geographical region Rainfall season Kendall's tau P values (two-tailed) Significant (Yes)/ Insignificant (No) Sen’s Slope (Qi –mm/year) SD-01 Yala Maha 0.354 0.118 0.006 0.378 Yes No 12.513 4.72 SD-02 Yala Maha 0.299 -0.034 0.021 0.807 Yes No 3.184 -2.743 SD-03 Yala Maha 0.35 0.064 0.007 0.639 Yes No 6.164 3.248 SD-04 Yala Maha 0.331 0.202 0.011 0.129 Yes No 3.016 11.879 Statistics from Man-Kendall's test for seasonal rainfall and Sen's slope estimation are shown in Table 2. It is noteworthy that all divisions show significant trends for rainfall only during the Yala season. It is also important to note that SD-02 only shows a negative value (Figure 4) during the Maha season as this could exacerbate the drought. Figure 4: Temporal variation of Annual rainfall according to Mann-Crandall’s and Sen’s slope calculation, a-d Sub-Division 01, 02, 03 and 04 Yala season, e-h. Sub-Division-01, 02, 03 and 04 in Maha Season. Furthermore, SD-02 and SD-04 are more closely related by geography and climatology, again, these rainfall trends and the slope of those divisions show similar variability. This is interesting and it will be interesting to study further the topographical contribution for this rainfall trends.
  • 8. Analysis of Long-Term Rainfall Trends in Sri Lanka Using CHRIPS Estimates. Multidisciplinary Journal www.ajmrd.com Page | 41 Table 4: Mann-Kendall and Sen’s slope calculation results for monthly rainfall in four Regions Region Months Kendall's tau p-value (Two- tailed) Sen's slope (Qi – mm/year) Region Months Kendall's tau p-value (Two- tailed) Sen's slope (Qi – mm/year) SD-01 Jan -0.193 0.139 -2.597 SD-02 Jan -0.170 0.193 -4.470 Feb 0.147 0.261 1.492 Feb 0.147 0.261 1.737 Mar 0.258 0.048 3.787 Mar 0.290 0.026 2.543 Apr 0.133 0.309 2.946 Apr 0.078 0.556 1.050 May 0.092 0.486 3.352 May 0.092 0.486 0.792 Jun 0.074 0.580 0.761 Jun -0.110 0.581 -0.009 Jul -0.078 0.556 -0.293 Jul -0.009 0.957 -0.304 Aug 0.350 0.007 4.358 Aug 0.203 0.121 1.034 Sep 0.290 0.026 5.419 Sep 0.124 0.344 0.834 Oct 0.170 0.193 4.139 Oct 0.207 0.112 2.749 Nov 0.198 0.129 2.122 Nov -0.037 0.789 -0.296 Dec 0.060 0.656 0.784 Dec 0.041 0.762 1.080 SD-03 Jan -0.170 0.193 -2.899 SD-04 Jan -0.147 0.509 -1.090 Feb 0.147 0.261 1.235 Feb 0.087 0.261 0.261 Mar 0.216 0.097 1.625 Mar 0.184 0.159 0.967 Apr 0.133 0.309 1.646 Apr 0.138 0.292 1.161 May 0.175 0.203 1.635 May 0.060 0.656 0.194 Jun 0.028 0.844 0.043 Jun 0.014 0.929 0.002 Jul -0.087 0.509 -0.281 Jul 0.115 0.382 0.077 Aug 0.157 0.232 0.936 Aug 0.180 0.169 0.330 Sep 0.041 0.762 0.385 Sep 0.018 0.901 0.156 Oct 0.087 0.509 2.158 Oct 0.055 0.682 1.040 Nov 0.028 0.844 1.023 Nov 0.041 0.762 0.929 Dec 0.101 0.443 2.534 Dec 0.166 0.205 4.112 Monthly Trend Analysis Results for the four rain region areas are presented in Table 3. For SD-01, all months except January and July show a positive trend. However, the Sen’s slope shows the highest values in August and September, with 4.35 and 5.41, respectively. This study shows that all four major areas show no significant trend except for a few months. In this regard, significant trends for SD-01 can be identified in March, August and September, while significant trends in SD-02 and SD-03 can be seen in March but no significant trend can be detected in any month SD-04. V. CONCLUSIONS Of paramount importance in this study is the division of Sri Lanka into four main regions and then the examination of rainfall trends using reconstructed precipitation data using satellite estimates and location data. The fact that the annual rainfall trend results show that no negative trends shows for any region of Sri Lanka Kendall’s tau and Sen’s flow and p values also represent that there is a significant positive trend everywhere in the country. When study the seasonal rainfall trend, It is clear that all zones show significant trends for rainfall only during the Yala season (Southwestern monsoon). Long-term (30 Years) precipitation studies show that there is no significant change in rainfall during the Maha season (Southwestern monsoon). Furthermore, in terms of agricultural and seasonal rainfall trends, it is evident that the tendency to add more water to the river basins of all regions increases during the Yala season. This tendency is much higher in SD-01 compare to all other. In addition, droughts in SD-02, SD-03 and SD-04 regions can be minimized by
  • 9. Analysis of Long-Term Rainfall Trends in Sri Lanka Using CHRIPS Estimates. Multidisciplinary Journal www.ajmrd.com Page | 42 utilizing the increased rainfall during the Yala season, especially during the Maha season. Finally, it is recommended that a detailed and fine-scale analysis be performed using satellite-estimated precipitation data that bias corrects with gauge data to achieve much better results. REFERENCES [1]. A. Ampitiyawatta and S. Guo, (200). “Precipitation trends in the Kalu Ganga basin in Sri Lanka,” Journal of Agricultural Sciences, vol. 4, no. 1, pp. 10–18. A. J. Robson, (2002). “Evidence for trends in UK flooding,” Philosophical Transactions of the Royal Society of London. Series A: Mathematical, Physical and Engineering Sciences, vol. 360, no. 1796, pp. 1327–1343. [2]. J. Robson, T. K. Jones, D. W. Reed, and A. C. Bayliss, (1998). “A study of national trend and variation in UK floods,” International Journal of Climatology, vol. 18, no. 2, pp. 165–182. [3]. Kay, R. Jones, and N. Reynard, (2006). “RCM rainfall for UK flood frequency estimation. II. Climate change results,” Journal of Hydrology, vol. 318, no. 1–4, pp. 163–172. [4]. Mondal, S. Kundu, and A. Mukhopadhyay, (2012). “Rainfall trend analysis by Mann-Kendall test: a case study of north-eastern part of Cuttack district, Orissa,” International Journal of Geology, Earth and Environmental Sciences, vol. 2, no. 1, pp. 70–78. [5]. Soja, N. Tchebakova, N. French et al., (2007). “Climate-induced boreal forest change: predictions versus current observations,” Global and Planetary Change, vol. 56, no. 3-4, pp. 274–296. [6]. Spence, W. Poortinga, and N. Pidgeon, (2011). “The psychological distance of climate change,” Risk Analysis, vol. 32, no. 6, pp. 957–972. [7]. A. Malmgren, R. Hulugalla, Y. Hayashi, and T. Mikami, (2003). “Precipitation trends in Sri Lanka since the 1870s and relationships to El Niño-Southern oscillation,” International Journal of Climatology, vol. 23, no. 10, pp. 1235–1252. [8]. Khaniya, H. G. Priyantha, N. Baduge, H. M. Azamathulla, and U. Rathnayake, (2018). “Impact of climate variability on hydropower generation: a case study from Sri Lanka,” ISH Journal of Hydraulic Engineering, pp. 1–9. [9]. Prudhomme, D. Jakob, and C. Svensson, (2003). “Uncertainty and climate change impact on the flood regime of small UK catchments,” Journal of Hydrology, vol. 277, no. 1-2, pp. 1–23. [10]. Tebaldi and R. Knutti, (2007) “The use of the multi-model ensemble in probabilistic climate projections,” Philosophical Transactions of the Royal Society A: Mathematical, Physical and Engineering Sciences, vol. 365, no. 1857, pp. 053–2075. [11]. R. Easterling, G. Meehl, C. Parmesan, S. Changnon, T. Karl, and L. Mearns, (2000). “Climate extremes: observations, modeling, and impacts”, Science, vol. 289, no. 5487, pp. 2068–2074. [12]. E.N.C. Perera, D. T. Jayawardana, and P. Jayasinghe, (2017). A Rainfall Intensity-Duration Threshold for Mass Movement in Badulla, Sri Lanka. Journal of Geoscience and Environment Protection 5, 135– 152. Doi: 10.4236/gep.2017.512010. [13]. Ranatunge, B. Malmgren, Y. Hayashi et al., (2003). “Changes in the southwest monsoon mean daily rainfall intensity in Sri Lanka: relationship to the El Niño-Southern Oscillation,” Paleogeography, Paleoclimatology, Paleoecology, vol. 197, no. 1-2, pp. 1–14. [14]. U. Weber and P. C. Stern, (2011). “Public understanding of climate change in the United States,” American Psychologist, vol. 66, no. 4, pp. 315–328. [15]. S. Chapin, E. S. Zavaleta, V. T. Eviner, (2000). “Consequences of changing biodiversity,” Nature, vol. 405, no. 6783, pp. 234–242. [16]. Lindstrom, (1999). “Trends and variability in Swedish floods,” in Proceedings of the IUGG, Hydrological Extremes: Understanding, Predicting, Mitigating, pp. 91–98, IHS Publications, Birmingham, UK. [17]. G.R. Walther, E. Post, P. Convey, (2002). “Ecological responses to recent climate change,” Nature, vol. 416, no. 6879, pp. 389–395. [18]. Alexandersson, (1986). “A homogeneity test applied to precipitation data,” Journal of Climatology, vol. 6, no. 6, pp. 661–675. [19]. Alexandersson and A. Moberg, (1997). “Homogenization of Swedish temperature data. Part I: homogeneity test for linear trends,” International Journal of Climatology, vol. 17, no. 1, pp. 25–34. [20]. H. B. Mann, (1945). “Nonparametric tests against trend,” Econometrica, vol. 13, no. 3, pp. 245–259. [21]. H. F. Lins and J. R. Slack, (1999). “Streamflow trends in the United States,” Geophysical Research Letters, vol. 26, no. 2, pp. 227– 230. [22]. H. Jayawardene, D. Sonnadara, and D. Jayewardene, (2005). “Trends of rainfall in Sri Lanka over the last century,” Sri Lankan Journal of Physics, vol. 6, pp. 7–17.
  • 10. Analysis of Long-Term Rainfall Trends in Sri Lanka Using CHRIPS Estimates. Multidisciplinary Journal www.ajmrd.com Page | 43 [23]. H. Jayawardene, D. Jayewardene, and D. Sonnadara, (2015). “Interannual variability of precipitation in Sri Lanka,” Journal of the National Science Foundation of Sri Lanka, vol. 43, no. 1, pp. 75–82. [24]. H. Wang, Z. Yang, Y. Saito, J. Liu, X. Sun, and Y. Wang, (2007). “Stepwise decreases of the Huanghe (Yellow River) sediment load (1950–2005): impacts of climate change and human activities,” Global and Planetary Change, vol. 57, no. 3-4, pp. 331–354. [25]. Lorenzoni, S. Nicholson-Cole, and L. Whitmarsh, (2007). “Barriers perceived to engaging with climate change among the UK public and their policy implications,” Global Environmental Change, vol. 17, no. 3-4, pp. 445–459. [26]. IPCC (Intergovernmental Panel on Climate Change) (2007) Summary for policymakers. In: Climate Change 2007: The Physical Science Basis (ed. by S. Solomon, D. Qin, M. Manning, Z. Chen, M. Marquis, K. B. Averyt, M. Tignor & H. L. Miller). Cambridge University Press, UK. [27]. IPCC, 2013: Climate Change 2013: The Physical Science Basis, Contribution of Working Group I to the Fifth Assessment Report of the Intergovernmental Panel on Climate Change [Stocker, T.F., D.Qin, G.-K. Plattner, M, Tignor, S.K. Allen, J.Boschung,A. Nauels, Y.Xia, V. Bex and P.M. Midgley (eds.)]. Cambridge University Ores, Cambridge, United Kingdom and New York, NY, USA, 1535pp. [28]. IPPC, 2014: Climate Change 2014: Impacts, Adaptation, and Vulnerability. Part A: Global and Sectoral Aspects, Contribution of Working Group II to the Contribution of Working Group II to the Fifth Assessment Report of the Intergovernmental Panel on Climate Change [Field, C.B., Barros, V.R., D.J. Dokken, K.J. Mach, M.D. Mastrandrea, T.E. Bilir, M. Chatterjee, K.L. Ebi, Y.O. Estrada, R.C. Genova, B. Girma, E.S. Kissel, A.N. Levy, S. MacCracken, P.R. Mastrendrea, and L.L. White (eds.)]. Cambridge University Ores, Cambridge, United Kingdom and New York, NY, USA, 1132pp. [29]. IPPC, 2014: Climate Change 2014: Impacts, Adaptation, and Vulnerability. Part B: Regional Aspects, Contribution of Working Group II to the Contribution of Working Group I to the Fifth Assessment Report of the Intergovernmental Panel on Climate Change [Barros, V.R., C.B. Field,D.J. Dokken, M.D. Mastrandrea, K.J. Mach, T.E. Bilir, M. Chatterjee, K.L. Ebi, Y.O. Estrada, R.C. Genova, B. Girma, E.S. Kissel, A.N. Levy, S. MacCracken, P.R. Mastrendrea, and L.L. White (eds.)]. Cambridge University Ores, Cambridge, United Kingdom and New York, NY, USA, 688pp. [30]. B. Wijngaard, A. M. G. Klein Tank, and G. P. K¨onnen, (2003). “Homogeneity of 20th century European daily temperature and precipitation series,” International Journal of Climatology, vol. 23, no. 6, pp. 679–692. [31]. J. P. Schuldt, S. H. Konrath, and N. Schwarz, (2011). “Global warming” or “climate change”?: Whether the planet is warming depends on question wording,” Public Opinion Quarterly, vol. 75, no. 1, pp. 115–124. [32]. Guowei and W. Jingpeng, (1999) “A study of extreme floods in China for the past 100years,” in Proceedings of the IUGG, Hydrological Extremes: Understanding, Predicting, Mitigating, pp. 109–119. [33]. Wijemannage, E.N.C. Perera, (2018). Comparison of spatial Interpolation Methods for Rainfall data over Sri Lank. Asian Conference in Remote Sensing, 17-21 October, Colombo: Asian Association on Remote Sensing. [34]. Du, S. Kawashima, S. Yonemura, X. Zhang, and S. Chen, (2004). “Mutual influence between human activities and climate change in the Tibetan Plateau during recent years,” Global and Planetary Change, vol. 41, no. 3-4, pp. 241–249. [35]. M. H. I. Dore (2005) Climate change and changes in global precipitation patterns: What do we know? Environ. Int. 31, 1167–1181. [36]. M. Kendall, (1975).Rank Correlation Methods, Charles Griffin & Co. Ltd., London, UK, 4th edition. [37]. M. N. Khaliq and T. B. M. J. Ouarda, (2007). “On the critical values of the standard normal homogeneity test (SNHT),” International Journal of Climatology, vol. 27, no. 5, pp. 681–687. [38]. Oreskes, (2004). The scientific consensus on climate change,” Science, vol. 306, no. 5702, p. 1686. [39]. N. Alahacoon, K. Matheswaran, P. Pani, G. Amarnath, (2018). A Decadal Historical Satellite Data and Rainfall Trend Analysis (2001–2016) for Flood Hazard Mapping in Sri Lanka. Remote Sens, 10, 448. [40]. N. Hofstra, M. Haylock, M. New, and P. Jones, (2009). “Testing E-OBS European high-resolution gridded data set of daily precipitation and surface temperature,” Journal of Geophysical Research, vol. 114, no. 21, pp. 1–16. [41]. Christensen and J. Christensen, (2004). “Intensification of extreme European summer precipitation in a warmer climate,” Global and Planetary Change, vol. 44, no. 1–4, pp. 107–117. [42]. O. Hoegh-Guldberg and J. F. Bruno, (2010) “The impact of climate change on the world’s marine ecosystems,” Science, vol. 328, no. 5985, pp. 1523–1528. [43]. K. Sen, (1968). “Estimates of the regression coefficient based on Kendall’s Tau,” Journal of the American Statistical Association, vol. 63, no. 324, pp. 1379–1389.
  • 11. Analysis of Long-Term Rainfall Trends in Sri Lanka Using CHRIPS Estimates. Multidisciplinary Journal www.ajmrd.com Page | 44 [44]. P. Wickramagamage, (2015). “Spatial and temporal variation of rainfall trends of Sri Lanka,” Theoretical and Applied Climatology, vol. 125, no. 3-4, pp. 427–438. [45]. Chandler, (2001).“Irish floods, changing climate and generalized linear models,” Newsletter of British Hydrological Society, vol. 69, pp. 5–7. [46]. G. Pearson and T. P. Dawson, (2003). “Predicting the impacts of climate change on the distribution of species: are bioclimate envelope models useful?,” Global Ecology and Biogeography, vol. 12, no. 5, pp. 361–371. [47]. R. Knutti, T. F. Stocker, F. Joos, and G.-K. Plattner, (2002). “Constraints on radiative forcing and future climate change from observations and climate model ensembles,” Nature, vol. 416, no. 6882, pp. 719–723. [48]. R. M. Hirsch, J. R. Slack, and R. A. Smith, (1982). “Techniques of trend analysis for monthly water quality data,” Water Resources Research, vol. 18, no. 1, pp. 107–121. [49]. R. Suppiah, (1997). “Extremes of the southern oscillation phenomenon and the rainfall of Sri Lanka,” International Journal of Climatology, vol. 17, no. 1, pp. 87–101. [50]. Herath and U. Ratnayake, (2004). “Monitoring rainfall trends to predict adverse impacts-a case study from Sri Lanka (1964–1993),” Global Environmental Change, vol. 14, pp. 71–79. [51]. S. Sahin and H. K. Cigizoglu, (2010). “Homogeneity analysis of Turkish meteorological data set,” Hydrological Processes, vol. 24, no. 8, pp. 981–992. [52]. Buishand, (1982) “Some methods for testing the homogeneity of rainfall records,” Journal of Hydrology, vol. 58, no. 1-2, pp. 11–27. [53]. T. R. Karl, “Modern global climate change, (2003). ” Science, vol. 302, no. 5651, pp. 1719–1723. [54]. N. Adger, S. Huq, K. Brown, D. Conway, and M. Hulme, (2003) “Adaptation to climate change in the developing world,” Progress in Development Studies, vol. 3, no. 3, pp. 179–195. [55]. Y. J. Kim, S. D. Eckermann, and H. Y. Chun, (2003). “An overview of the past, present and future of gravity-wave drag parametrization for numerical climate and weather prediction models,” Atmosphere- Ocean, vol. 41, no. 1, pp. 65–98. [56]. Z. Kundzewicz and A. Robson, (2000). “Detecting trend and other changes in hydrological data. world climate programme data and monitoring, WCDMP-45,” WMO/TD Report no. 1013, World Meteorological Organization, Geneva, Switzerland.