2. of climate and its fluctuations through time. They can either be very
simple, for example only calculated from SSTs, or integrate a larger
number of climate variables, such as temperature, pressure or surface
winds. Some relate to interannual climate patterns, while others reflect
decadal to inter-decadal phenomena. The El Niño-Southern Oscillation
(ENSO) is one of the best known indices of interannual climate
variability. However, its impact on the Sahelian vegetation is still
debated. While several studies have reported no or only a minor
influence (Anyamba et al., 2001; Anyamba and Eastman, 1996;
Anyamba and Tucker, 2005; Philippon et al., 2007; Propastin et al.,
2010), others have shown that the Sahelian climate is related to ENSO
events (Camberlin et al., 2001; Oba et al., 2001; Ward, 1998). Other
climate indices that were associated to the Sahelian vegetation
dynamics are the North Atlantic Oscillation (NAO), the Pacific Decadal
Oscillation (PDO) and the Indian Ocean Dipole (IOD). Oba et al. (2001)
attributed in their study large parts of the interannual variation of
vegetation productivity during the 1980s to the NAO while Wang
(2003) could not find a consistent relationship. The influence of the
PDO and the IOD on the Sahelian climate is less studied. Brown et al.
(2010) found significant relationships between the PDO and the
growing season in West Africa while the IOD was found to have
virtually no influence in the Sahel. Also Williams and Hanan (2011)
found only weak responses across the Sahelian zone in their study
when looking at the IOD and the Multivariate ENSO Index (MEI)
individually but not when investigating interacting effects of the two
indices. All these findings suggest some contradiction in the Sahelian
response to changes as characterized by climate indices, which could
partly be caused by the variations in spatial extent respectively
definitions of climate indices and size of the region studied.
The goal of this paper is to analyze the linkage between these
climate indices, pixel-wise spatio-temporal patterns of global sea
surface temperature and the Sahelian vegetation dynamics. In this
analysis the Sahel, an ecoregion covering an area of more than
3 million km2
, was divided into five subregions because it has been
shown that the Atlantic section of the Sahel is only weakly related
with the rest of the zone (Moron, 1994). Moreover the definition of
the “Sahel window” varies considerably among different studies, in
particular in the longitudinal extent. For example Giannini et al.
(2003) referred to the 20°W–35°E/10–20°N extent, Mohino et al.
(2010) used the area 15°W–15°E/10–17°N, Jarlan et al. (2005) studied
the window 18°W–18°E/12–18°N and Rowell (2003) defined the area
16.875°W–35.625°E/11.25–18.75°N as the Sahel. Here we used the
longitudinal extent defined in the study of Giannini et al. (2003)
(20°W–35°E) but stratified the Sahel into five subregions as displayed
in Fig. 1 to account for the longitudinal variability in rainfall.
Using Pearson's correlation analysis between climate indices,
remotely sensed time series of SST and NDVI corrected for seasonality
and trend, the following research questions were investigated: a) is
there a statistically significant relationship between global SST
anomalies/climate indices and NDVI in the Sahel and are the spatial
patterns consistent; b) which ocean regions explain most of the NDVI
dynamics across the subdivided Sahel; c) which time lags are involved
in the interrelations between SST/climate indices and NDVI and d) do
certain areas in the Sahel exhibit stronger teleconnections to SST
anomalies than others. The spatio-temporal correlation analysis also
including sea surface temperature may help to unveil new options to
develop tools for forecasting the Sahelian resource base, which is
largely dependent on rainfall.
2. Data
Four climate indices and two different satellite-based gridded
monthly time series (NDVI and SST) were used in this study. High-
temporal continuous EO-based NDVI and SST is currently available from
1982 to 2007 (full year coverage=312 months). This time period thus
determines the temporal extent of the analyses performed.
2.1. Climate indices
We used four climate indices based on global climate variations
from various oceanic regions (Fig. 2).
2.1.1. Indian Ocean Dipole (IOD)
The Indian Ocean Dipole (IOD) is an interannual climate
phenomenon in the tropical Indian Ocean, first defined by Saji et al.
(1999). In the positive phase of the IOD, trade winds are stronger than
usual and cooler-than-average sea-surface temperatures are preva-
lent across the eastern tropical Indian Ocean, near Indonesia and
Australia. To the west, near Madagascar, waters are warmer than
average and convection is intensified. These patterns are reversed
during the IOD's negative phase (UCAR, 2011). Intensity of the IOD is
represented by anomalous SST gradients between the western
equatorial Indian Ocean (50E–70E and 10S–10N) and the south
eastern equatorial Indian Ocean (90E–110E and 10S–0N). We used
the IOD based on HadlSST SST (monthly from 1982 to 2007)
downloaded from: http://www.jamstec.go.jp/frsgc/research/d1/iod/.
2.1.2. Multivariate ENSO Index (MEI)
The Multivariate El Niño-Southern Oscillation (ENSO) Index (MEI)
is a measure to monitor the strength of ENSO conditions. ENSO is the
most important coupled ocean–atmosphere phenomenon to cause
global climate variability on interannual time scales. MEI is derived by
combining the six main observed variables in the tropical Pacific: SST,
sea-level pressure, surface winds, surface air temperature, cloudiness
and precipitation (Wolter and Timlin, 1998). The MEI key regions for
the variable measurements can be seen in Wolter and Timlin (1998,
Fig. 1). MEI is favored over conventional indices, since it combines the
significant features of all observed surface parameters in the tropical
Pacific (Wolter and Timlin, 1998). MEI was obtained from: http://
www.esrl.noaa.gov/psd/data/climateindices/.
2.1.3. North Atlantic Oscillation Index (NAO)
The North Atlantic Oscillation (NAO) is typically measured
through variations in the normal pattern of lower atmospheric
Fig. 1. Map of the average annual rainfall in the Sahel (1996–2007) and the areas of study: two regions have been selected in the western (W1, W2) and central Sahel (C1, C2) and
one region in the eastern Sahel (E1).
3277S. Huber, R. Fensholt / Remote Sensing of Environment 115 (2011) 3276–3285
3. pressure over Iceland and higher pressure near the Azores and Iberian
Peninsula (UCAR, 2011). A positive NAO index refers to stronger than
usual subtropical high pressure center around the Azores and a deeper
than normal Icelandic low, with increased pressure generating more
and stronger winter storms crossing the Atlantic Ocean on a more
northerly track. Europe tends towards warm and wet winters while
northern Canada and Greenland will usually have cold and dry
winters, with the eastern United States generally experiencing mild,
wet winter conditions.
A negative NAO index (when there is less difference than usual in
pressure across the two regions) features a weakened Atlantic storm
track, a greater risk for Arctic outbreaks of cold air across the
northeastern United States and northern Europe, and moist air to the
Mediterranean (UCAR, 2011). NAO varies from year to year but has a
roughly decadal pattern with a dominant period of 12 years (Deser
and Blackmon, 1993). The index can be obtained from: http://www.
esrl.noaa.gov/psd/data/climateindices/.
2.1.4. Pacific Decadal Oscillation (PDO)
The Pacific Decadal Oscillation (PDO) is a multi-decadal pattern
of climate variability across the North Pacific Ocean (Mantua et al.,
1997). The positive (warm) mode of PDO features colder than
average SSTs in the central North Pacific along a narrow band of
warmer SSTs along the west coast of North America and in the
eastern tropical Pacific. During the negative (cool) phase of PDO,
the opposite has been observed: a warm pool of sea surface waters
in the central north Pacific and cold SSTs along the west coast
(Mantua et al., 1997).
Each phase typically persists for 20 to 30 years, with a warm phase
predominating since the late 1970s. The PDO may be related to ENSO,
but differs mainly because the timescale for the PDO is much longer
(several decades) and because the PDO more clearly involves the
extratropical Pacific and the Aleutian Low pressure system (UCAR,
2011). Even though PDO is mirroring decadal patterns, it involves
sufficient interannual variability to relate to productivity in Africa
(Brown et al., 2010). The index is available at http://jisao.washington.
edu/pdo/PDO.latest.
2.2. Normalized Difference Vegetation Index (NDVI)
We used AVHRR (Advanced Very High Resolution Radiometer)
GIMMS (Global Inventory Modeling and Mapping Studies) NDVI data
as a proxy for vegetation productivity. Monthly maximum NDVI
composites with an 8 km spatial resolution used in this study were
processed by the GIMMS Group at NASA's Goddard Space Flight
Center, as described by Tucker et al. (2005) and Pinzon et al. (2005).
More details about the binning and band calibration can be found in
James and Kalluri (1994), Vermote and Kaufman (1995) and Los
(1998). No atmospheric correction is applied to the GIMMS data
except for volcanic stratospheric aerosol periods (1982–1984 and
1991–1994) (Tucker et al., 2005). A satellite orbital drift correction is
performed using an empirical mode decomposition (EMD) transfor-
mation method of Pinzon et al. (2005) removing common trends
between time series of solar zenith angle (SZA) and NDVI. The original
16-bit GIMMS NDVI was converted into real NDVI values (range −1 to
1) for further analysis.
2.3. Sea surface temperature (SST)
NOAA Optimum Interpolation (OI) SST v2 data, provided by the
NOAA-CIRES Climate Diagnostics Center, Boulder, USA were used in
this paper (http://www.esrl.noaa.gov/psd/data/gridded/data.noaa.
oisst.v2.html). The NOAA SST OIv2 product integrates both in situ
and satellite data from November 1981 to the present at 1.0° spatial
resolution globally in degrees Celsius (Reynolds et al., 2002). The in
situ SST data are determined from observations from ships and buoys
(Reynolds et al., 2002). Satellite data is also obtained from the AVHRR
instrument. The NOAA OI.v2 SST monthly fields are derived by a linear
interpolation of the weekly optimum interpolation (OI) version 2
fields to daily fields and then averaging the daily values over a month.
More details about the product can be found in Reynolds et al. (2002).
3. Methods
The boundary of the Sahel used in this paper (indicated on the
maps in Figs. 1, 4 and 5) is defined by Le Houérou (1989) using the
IOD
-3.5
-2.5
-1.5
-0.5
0.5
1.5
2.5
3.5
1982 1985 1988 1991 1994 1997 2000 2003 2006
Year
1982 1985 1988 1991 1994 1997 2000 2003 2006
Year
1982 1985 1988 1991 1994 1997 2000 2003 2006
Year
1982 1985 1988 1991 1994 1997 2000 2003 2006
Year
NormalizedIndex
-3.5
-2.5
-1.5
-0.5
0.5
1.5
2.5
3.5
NormalizedIndex
-3.5
-2.5
-1.5
-0.5
0.5
1.5
2.5
3.5
NormalizedIndex
-3.5
-2.5
-1.5
-0.5
0.5
1.5
2.5
3.5
NormalizedIndex
MEI
NAO PDO
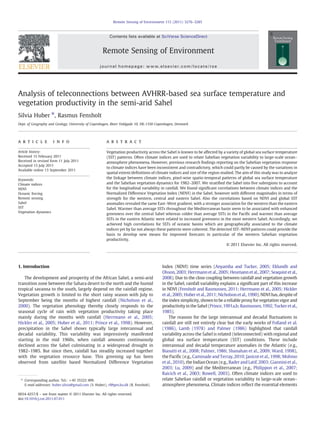
Fig. 2. Monthly climate indices Indian Ocean Dipole (IOD), Multivariate ENSO Index (MEI), North Atlantic Oscillation Index (NAO) and Pacific Decadal Oscillation (PDO) from 1982 to
2007.
3278 S. Huber, R. Fensholt / Remote Sensing of Environment 115 (2011) 3276–3285
4. 150 (to the north) and 700 mm (to the south) annual rainfall isohyets
as borders of the Sahelian area based on rainfall mean annual values of
the Rainfall Estimate (RFE) blended gage-satellite rainfall product
(NOAA Climate Prediction Center) for 1996–2007 (Herman et al.,
1997). Within this boundary we defined five subregions (Fig. 1): two
in the Western (W1, W2), two in the Central (C1, C2) and one in the
Eastern Sahel (E1) to account for different rainfall regimes in the East–
West orientation at the interannual scale. The longitudinal division
was partly based on the analysis conducted by Moron (1994) and
Lebel and Ali (2009). Three subregions (W1, W2 and C2) are 10° wide
in longitude and C1 and E1 were chosen to be 15° wide in latitude. It
was decided to define C1 with a larger width to keep Chad incl. the
Marra mountains as well as the Sahelian part of Sudan as an entity. E1
was enlarged to 15° since rainfall anomalies of the most eastern Sahel
(35–40°E) and the region between 25° and 35°E are highly correlated.
3.1. Preprocessing
All analyses were performed on linearly detrended NDVI and SST
time series. Further, for both time series standardized anomalies were
computed to remove the seasonal component from the data. The
original 15-day NDVI composite data were aggregated to months
using a maximum value composite approach to further reduce the
influence from clouds (Holben, 1986). Monthly anomalies for each
26-year data record (1982–2007=312 images) were obtained by
computing the median value for each pixel for each month
(=climatology value) which was then subtracted from each image.
Median values rather than mean values were used because the time
series of this study are shorter than the standard 30-year baseline
period defined by the World Meteorological Organization (WMO) to
calculate climatology values. The SST time series as well as the climate
indices were additionally smoothed using a moving average filter over
a 3-month period (Jan–March, Feb–April etc.) to reduce noise
(Plisnier et al., 2000).
From the NDVI time series mean values for the period July–
September (termed JAS hereafter) were calculated for each of the five
subregions in the Sahel. Finally, area-average mean JAS NDVI were
extracted for all subregions, termed hereafter NDVI Anomaly Indices
(NAI) (Fig. 3).
3.2. Teleconnections
Pixel-wise Pearson correlation coefficients were calculated be-
tween the four climate indices (IOD, MEI, NAO and PDO), global SST
anomalies (3-month means) and NAI values for each of the five
subregions from 1982 to 2007. Since changes in ocean-atmospheric
patterns can affect the Sahelian rainfall regime and hence the
vegetation development with a delay of several months, lagged
correlation was used, with climate indices and SST observed at steps
0 to 9 months prior to the NDVI observations in the Sahel. Next,
oceanic regions (all substantially larger than the Sahel) with highest
positive or negative correlations with JAS NDVI were identified and
three indices of SST anomalies extracted (Fig. 4). Two indices were
extracted in the northern Atlantic Ocean. The first one for January–
March mean SSTs as displayed in Fig. 6b: JFM) (N3.5 million km2
) and
the second one for June–August mean SSTs as illustrated in Fig. 6a:
JJA) (N4.5 million km2
). The third index covers an area of more than
5 million km2
in the equatorial Pacific and was extracted from March–
May mean SSTs (Fig. 6a: MAM). These three SST indices (JFM Atlantic,
JJA Atlantic and MAM pacific) were correlated with JAS NDVI across
the Sahel and the results compared with the commonly used climate
indices. To explore combined effects of the indices, partial correlation
analysis was applied.
4. Results and discussion
Correlations of JAS NDVI anomalies (NAI) between the different
sub-regions of the Sahel confirm that the NDVI dynamics of the
Atlantic section (W1) is to a certain degree decoupled from the rest of
the region (Table 1) as also suggested by (Moron, 1994). The
subregion W2 is closer related to the central Sahel (C1) than to W1.
The highest correlation was found between W2 and C1 (r=0.78).
4.1. Correlations between climate indices and Sahelian NDVI dynamics
The analysis revealed that the western and central Sahel is better
correlated to predefined climate indices (IOD, MEI, NAO and PDO)
than the eastern Sahel. Most significant correlations were achieved for
MEI and PDO (Fig. 5a and b). In particular for Senegal, southern
Mauritania and western Mali we found highly significant r-values for
MEI with the highest number of significant pixels for the periods AMJ
and MJJ. Brown et al. (2010) also reported significant correlations
between MEI aggregated over June to August (JJA) and the start of the
growing season (SOS) for the westernmost Sahel, however in their
study they report positive correlations while we found values of the
opposite sign. Other studies report only modest to small ENSO
response of NDVI for the Sahel (Anyamba and Eastman, 1996;
Philippon et al., 2007; Williams and Hanan, 2011).
Also for PDO significant negative correlations were found
throughout the western to central Sahel; in particular areas of Mali
Fig. 3. Area-averaged JAS NDVI standardized anomalies (NAI) obtained from linearly detrended time-series from 1982 to 2007 for the five Sahelian subregions as outlined in Fig. 1.
3279S. Huber, R. Fensholt / Remote Sensing of Environment 115 (2011) 3276–3285
5. and Burkina Faso were related to the index (Fig. 5b). The highest
anticorrelations for PDO and JAS NAI were found when averaging PDO
over JFM and JAS. In contrast to the results obtained for MEI and PDO,
we found some positive correlations when testing associations
between JAS NAI and IOD and NAO indices, respectively, (Fig. 5c
and d); yet a smaller number of pixels with significant r-values was
found as compared to MEI and PDO which is in accordance with the
findings of Brown et al. (2010).
4.2. Correlations between global SST and Sahelian NDVI dynamics
The pixel-wise correlation analysis revealed several significant
relationships between SST and vegetation dynamics in the Sahel
(Fig. 6). In general larger oceanic areas with significant correlations
were found for the western and central Sahel than for the eastern
Sahel. This is in accordance with the findings presented in the
previous section. Subsequently we report teleconnections between
JAS NAI and SST anomalies for the five different subregions. Only large
scale patterns of significant correlations that are persistent over at
least three aggregated time periods will be commented on.
4.2.1. Sahel subregion W1 (20–10° W)
The results obtained for W1 differ from the other four subregions,
corroborating the fact that the Atlantic section of the Sahel is less well
related to the rest of the ecoregion as described above. Compared to
the other subregions, W1 in general shows stronger associations to
oceanic temperature anomalies reflected by more pixels with
significant r-values (Fig. 6a).
In particular large areas of the Pacific Ocean emerge with significant
correlations (p≤0.01), both positive and negative. Anticorrelations are
very distinct in the tropical Pacific, with decreasing r-values for shorter
lag-periods while the areas to the north and south of the tropical Pacific
exhibit positive correlations. For the Philippine Sea also positive
relationships were found between SST and JAS NAI anomalies for the
periods JFM, FMA and MAM. The anticorrelations imply that lower than
average SSTs in the tropical Pacific Ocean are statistically related to
higher boreal summer precipitation in the West Sahel (W1). These
results are consistent with other research. Ward (1998) found similar
patterns for “no dipole years”, i.e., years with rainfall anomalies of the
same sign in the Sahel and the Guinean Coast at high-frequency
timescale, when correlating JAS SST and Sahelian rainfall. Higher
photosynthetic activity over the Sahel was also associated to negative
summer SST anomalies in the tropical eastern Pacific in the study of
Philippon et al. (2007). However, in this study we could link winter/
spring SSTs to summer NDVI in the Sahel. This time lag could be
important for predictive purposes. The strong pattern we obtained in
the Pacific Ocean would suggest that there is also a link between PDO
and JAS NAI in the Western Sahel, but this was not the case (Fig. 5b).
For shorter lag-periods (starting with MJJ) high anticorrelations
emerged in the Indian and Southern Ocean, with r-values between −
0.60 and −0.68. Jury and Mpeta (2009) showed an association
between the westerly wind anomalies and sea-level pressure of the
South Indian Ocean and Sahel rainfall with a 12-month lead time. The
Indian Ocean in general plays an important role in forcing the Sahelian
climate, in particular at decadal time scales, as reported in various
studies (e.g., Bader and Latif, 2003; Giannini et al., 2003; Hagos and
Cook, 2008). Philippon et al. (2007) however did not find any
significant signal over the tropical Indian Ocean. They argue in their
study that this is merely attributed to the time period that is restricted
to the recent two decades, which does not capture longterm decadal
variability. Even though the time scale covered in this study does not
allow detecting decadal or multi-decadal patterns, patterns in the
Indian Ocean showed to be associated with JAS NAI.
Together with the occurrence of significant patterns in the Indian
Ocean, positive correlations occur in the western part of the North
Atlantic Ocean, from the MJJ period onwards (p≤0.01, with highest
correlations for JAS (r=0.84)) characterizing a large region of pixels
(horseshoe shaped) stretching from just off the coast of Senegal to the
Atlantic ocean west of the European continent. This spatial extent
corresponds well with the cold ocean current associated with one of
the five major existing gyres (the North Atlantic gyre) (Heinemann
and Open University Course Team, 1989).
However, even though we found these positive correlations in the
northern Atlantic and a weak correlation (r=0.35) between JAS NAO
and the JJA Atlantic index (extracted in this study and described in
Section 3.2), almost no significant relationships were found when
correlating NAO with JAS NAI for the subregion W1.
4.2.2. Sahel subregion W2 (10–0° W)
For JAS NAI of W2 in particular two oceanic areas emerged with
highly significant negative correlations (p≤0.01): an area of the
Atlantic Ocean for longer lag-periods (JFM, FMA and MAM) and an
area of the Indian Ocean with a maximum r value of −0.8 for SST
anomalies averaged for MJJ (Fig. 6b). The strong link between
northern Atlantic SSTs and NDVI anomalies in the subregion W2 is
in agreement with the findings of the correlation analysis between JAS
NAI and NAO. Also for NAO we found significant (but weak)
correlations with W2 NDVI for long lag-periods, in particular JFM,
Fig. 4. Extracted SST anomaly indices for the Atlantic averaged over January–March (JFM) and June–August (JJA), respectively, and the equatorial Pacific for March–May (MAM).
Table 1
Pearson's correlation coefficients between area-averaged JAS NDVI anomaly indices
(NAI) for the five subregions in the Sahel.
Subregion W1 W2 C1 C2 E1
W1 [20–10°W] 0.44 0.17 0.12 0.03
W2 [10–0°W] 0.44 0.78 0.43 0.26
C1 [0–15°E] 0.17 0.78 0.63 0.35
C2 [15–25°E] 0.12 0.43 0.63 0.63
E1 [25–40°E] 0.03 0.26 0.35 0.63
3280 S. Huber, R. Fensholt / Remote Sensing of Environment 115 (2011) 3276–3285
6. even though NAO represents pressures which are not directly
comparable to SST patterns.
Compared to the results of W1 a general decrease in the
geographical extent of significant pixels can be observed. In particular
the association to the Pacific Ocean is much weaker. For example, W2
is the only subregion for which almost no significant relationships
were detected in the Western Pacific. But still we identified significant
negative correlations between JAS NAI of this region (and also C1 and
C2, but not for W1) and the PDO. Interestingly some SST patterns in
the North Pacific and the Aleutian Islands temporally coincide with
the strongest NAI–PDO relationships. PDO has been shown to clearly
involve the extratropical Pacific and the Aleutian low pressure system
(UCAR, 2011).
Finally, while we detected for W1 strong positive correlations from
MJJ onwards in the northern Atlantic, for W2 the analysis revealed
negative correlations for JFM until AMJ. The reason for this pattern
needs to be further investigated.
4.2.3. Sahel subregion C1 (0–15° E)
Similar to W2, also for the JAS NDVI dynamics of C1 anticorrelations
were discovered in the Indian Basin with max. r-values of −0.63 for the
period MAM (Fig. 6c). Starting with AMJ the Eastern Mediterranean Sea
showed increasing associations with NAI. The findings that the
Mediterranean plays an important role in the Sahelian climate are
consistentwiththoseof other studies (Raicich et al., 2003; Rowell, 2003)
and suggest that a warming of the Mediterranean is often associated
with enhanced Sahelian rainfall and hence increased vegetation growth.
The main reason for the regional teleconnection leading to additional
moisture over the Sahel in warm Mediterranean years is increased
evaporation over the sea surface leading to an enhanced moisture
content of the air that is advected southwards across the eastern Sahara
into the Sahel (Rowell, 2003). During winter, the whole Mediterranean
is influenced by westerlies (Raicich et al., 2003). During summer the
westerlies are weaker and a meridional regime develops, especially over
the eastern Mediterranean basin (=Etesian wind regime) which
connects the eastern Mediterranean area with the sub-Saharan
ecoregion (Raicich et al., 2003). For the period JFM and FMA the
western Pacific also partly contributes to JAS NDVI variability.
4.2.4. Sahel subregion C2 (15–25° E)
For C2 positive relationships were found between JAS NAI and SST
anomalies in the South West pacific for longer lag-periods (JFM, FMA,
MAM) (Fig. 6d). Only in July–September (JAS) the SST anomalies
measured in the SE Mediterranean and the Red Sea corresponded well
with NAI (r=0.65). As for C1, the study also revealed significant
positive correlations for the western Pacific for JFM, FMA and MAM.
4.2.5. Sahel subregion E1 (25–40° E)
With the JS NAI of this region the SST anomalies of only a few
oceanic areas were significantly correlated (Fig. 6e). Teleconnections
were found almost exclusively in the Atlantic Ocean and Western
Pacific for longer lag-periods. The last two periods analyzed (JJA and
Fig. 5. Maps of significant r-values from correlation analyses between JAS NDVI anomalies and a) the Multivariate ENSO Index (MEI) averaged over May–July, b) the Pacific Decadal
Oscillation (PDO) averaged over July–September, c) the North Atlantic Oscillation (NAO) averaged over January–March and d) the Indian Ocean Dipole (IOD) averaged over April–
June from 1982 to 2007.
3281S. Huber, R. Fensholt / Remote Sensing of Environment 115 (2011) 3276–3285
7. Fig. 6. Maps of correlation coefficients (r) between the Sahel NDVI anomaly index (NAI) extracted from the five subregions: a) W1, b) W2, c) C1, d) C2 and e) E1) and mean SST
anomalies from 1982 to 2007 for different time lags (e.g., JFM: January–March). Only correlations between the 1 and 5% confidence levels are shown.
3282 S. Huber, R. Fensholt / Remote Sensing of Environment 115 (2011) 3276–3285
8. JAS) revealed positive associations between the SST of the Red Sea and
the NDVI dynamics of the Eastern Sahel as it was the case for the
neighboring subregion C2. These findings correspond with the climate
indices analysis, which revealed hardly any significant correlations for
the most eastern Sahel.
4.3. Joint correlations between climate/SST indices and Sahelian NDVI
dynamics
The results obtained from a partial correlation analysis are
presented in Fig. 7. It can be seen that in certain hotspot regions
across the Sahel up to 50% of the interannual variability in NDVI can be
explained by the combined indices. With the combined JFM Atlantic
and MAM Pacific indices hotspots of high r2
-values were mapped
across the Sahel, except for C2 (Fig. 7b). Interestingly, highest
correlations were achieved for C2 with MJJ MEI and JAS PDO
(Fig. 7a). When the JJA Atlantic index was used in combination with
the MAM Pacific index, in particular large parts of the NDVI variability
of the western Sahel can be explained (Fig. 7c). In Senegal, Mali and
Mauritania large areas are mapped with r2
-values between 0.4 and
0.5. These results illustrate that a larger amount of the JAS NDVI
variability in the western Sahel can be explained when using
extracted SST indices as compared to the well known MEI and PDO.
Yet the latter were able to explain more of the JAS NDVI variability in
subregion C2.
5. Conclusions
Using EO-based time series of SST and NDVI covering 1982–2007
provides the possibility of performing analyses based on observations
continuous in space and time but on the other hand the time record of
the AVHRR sensors is not long enough to discover decadal patterns.
We therefore focused on interannual patterns in this study. From this
analysis we conclude that significant correlations exist between
global SST anomalies and Sahelian NDVI, however with different
characteristics for western, central and eastern Sahel. Whereas the
vegetation productivity in the western Sahel could be associated with
large oceanic areas of the Pacific, the Atlantic as well as the Indian
Ocean, for the eastern Sahel only small areas in the Atlantic were
found to be significantly related to dynamics in NDVI. The Eastern
Mediterranean emerged only with significant r-values when related
to NDVI in the central Sahel. Warmer than average SSTs throughout
the Mediterranean basin seem to be associated with enhanced
greenness over the central Sahel whereas colder than average SSTs
in the Pacific and warmer than average SSTs in the eastern Atlantic
were related to increased greenness in the most western Sahel.
The correlations based on NAI and climate indices revealed the
same East–West gradient, with stronger associations for the western
than the eastern Sahel. Accordingly, we achieved high correlations for
SSTs of oceanic basins which are associated to the indices (e.g., for
W1: MEI and equatorial Pacific) yet by far not always. For instance
relating IOD with Sahelian NDVI did not result in higher correlations
even though the SSTs of the Indian Ocean played an important role for
the NDVI dynamics in W1, W2 and C1. This result may be explained by
the fact that IOD is defined as a gradient in the equatorial Indian
Ocean. However, for W2 and C1 the most significant correlations were
found in the southern Indian Ocean, away from the Equator and for
W1, the correlations are significant over the Equator but show the
same signed structure and no gradient.
For NDVI of W1 the study showed a strong association to the SST
anomalies of the Pacific Ocean but when relating PDO to JAS NAI this
link could not be reproduced for W1.
Overall, these large scale climate indices do have predictive power
but they might be defined too broad thereby suppressing predictive
capabilities of more localized areas like it seems to be the case for the
Atlantic SST anomaly we found along the Senegal–Europe area for JAS.
This is reflected in the findings of the correlation analysis based on
combined indices. It illustrates that with extracted SST indices for
Fig. 7. Maps of joint correlations (r2
) from partial correlation analysis of JAS NDVI anomalies and a) the Multivariate ENSO Index (MEI) averaged over May–June and the Pacific
Decadal Oscillation (PDO) averaged over June–August, b) the SST indices extracted from the Atlantic and Pacific for January–March and March–May, respectively, and c) the SST
indices extracted from the Atlantic and Pacific for June–August and March–May, respectively.
3283S. Huber, R. Fensholt / Remote Sensing of Environment 115 (2011) 3276–3285
9. specific oceanic areas the percentage of explained NDVI variability can
be increased and extended to larger areas as compared to traditional
climate indices. However, in this paper we only investigated linear
SST–NDVI relationships. Also non-linear features or interferences
between climate patterns might play a role and this should be
considered in future studies.
The detected SST–NDVI patterns could provide the basis to
develop new means for improved forecasts in particular of the
western Sahelian vegetation resource base for pastoralism and
agricultural production.
Acknowledgements
The authors thank the NASA Global Inventory Modeling and
Mapping Studies (GIMMS) group for producing and sharing the
AVHRR GIMMS NDVI data set as well as the NOAA-CIRES Climate
Diagnostics Center, Boulder, USA, for providing the NOAA Optimum
Interpolation (OI) SST v2 data. Thanks to two anonymous reviewers
for their helpful comments.
References
Anyamba, A., & Eastman, J. R. (1996). Interannual variability of NDVI over Africa and its
relation to El Nino Southern Oscillation. International Journal of Remote Sensing, 17,
2533–2548.
Anyamba, A., & Tucker, C. J. (2005). Analysis of Sahelian vegetation dynamics using
NOAA-AVHRR NDVI data from 1981–2003. Journal of Arid Environments, 63,
596–614.
Anyamba, A., Tucker, C. J., & Eastman, J. R. (2001). NDVI anomaly patterns over Africa
during the 1997/98 ENSO warm event. International Journal of Remote Sensing, 22,
1847–1859.
Bader, J., & Latif, M. (2003). The impact of decadal-scale Indian Ocean sea surface
temperature anomalies on Sahelian rainfall and the North Atlantic Oscillation.
Geophysical Research Letters, 30.
Biasutti, M., Held, I. M., Sobel, A. H., & Giannini, A. (2008). SST forcings and Sahel rainfall
variability in simulations of the twentieth and twenty-first centuries. Journal of
Climate, 21, 3471–3486.
Brown, M. E., de Beurs, K., & Vrieling, A. (2010). The response of African land surface
phenology to large scale climate oscillations. Remote Sensing of Environment, 114,
2286–2296.
Camberlin, P., Janicot, S., & Poccard, I. (2001). Seasonality and atmospheric dynamics of
the teleconnection between African rainfall and tropical sea-surface temperature:
Atlantic vs. ENSO. International Journal of Climatology, 21, 973–1005.
Caminade, C., & Terray, L. (2010). Twentieth century Sahel rainfall variability as
simulated by the ARPEGE AGCM, and future changes. Climate Dynamics, 35, 75–94.
Deser, C., & Blackmon, M. L. (1993). Surface climate variations over the North Atlantic
Ocean during winter: 1900–1989. American Meteorological Society, 1743–1753.
Eklundh, L., & Olsson, L. (2003). Vegetation index trends for the African Sahel 1982–
1999. Geophysical Research Letters, 30.
Fensholt, R., & Rasmussen, K. (2011). Analysis of trends in the Sahelian ‘rain-use
efficiency’ using GIMMS NDVI, RFE and GPCP rainfall data. Remote Sensing of
Environment, 115, 438–451.
Folland, C. K., Palmer, T. N., & Parker, D. E. (1986). Sahel rainfall and worldwide sea
temperatures, 1901–85. Nature, 320, 602–607.
Giannini, A., Saravanan, R., & Chang, P. (2003). Oceanic forcing of Sahel rainfall on
interannual to interdecadal time scales. Science, 302, 1027–1030.
Hagos, S. M., & Cook, K. H. (2008). Ocean warming and late-twientieth-century Sahel
drought and recovery. Journal of Climate, 21, 3797–3814.
Heinemann, B.Open University Course Team. (1989). Ocean circulation. Oxford, U.K.
Pergamon Press.
Herman, A., Kumar, V. B., Arkin, P. A., & Kousky, J. V. (1997). Objectively determined 10-
day African rainfall estimates created for famine early warning systems.
International Journal of Remote Sensing, 18, 2147–2159.
Herrmann, S. M., Anyamba, A., & Tucker, C. J. (2005). Recent trends in vegetation
dynamics in the African Sahel and their relationship to climate. Global Environ-
mental Change-Human and Policy Dimensions, 15, 394–404.
Heumann, B. W., Seaquist, J. W., Eklundh, L., & Jonsson, P. (2007). AVHRR derived
phenological change in the Sahel and Soudan, Africa, 1982–2005. Remote Sensing of
Environment, 108, 385–392.
Hickler, T., Eklundh, L., Seaquist, J. W., Smith, B., Ardo, J., Olsson, L., Sykes, M. T., &
Sjostrom, M. (2005). Precipitation controls Sahel greening trend. Geophysical
Research Letters, 32.
Holben, B. N. (1986). Characteristics of maximum-value composite images from
temporal AVHRR data. International Journal of Remote Sensing, 7, 1417–1434.
Huber, S., Fensholt, R., & Rasmussen, K. (2011). Water availability as the driver of
vegetation dynamics in the African Sahel from 1982–2007. Global and Planetary
Change, 76, 186–195.
James, M. E., & Kalluri, S. N. V. (1994). The Pathfinder AVHRR land data set — An
improved coarse resolution data set for terrestrial monitoring. International Journal
of Remote Sensing, 15, 3347–3363.
Janicot, S., Harzallah, A., Fontaine, B., & Moron, V. (1998). West African monsoon
dynamics and eastern equatorial Atlantic and Pacific SST anomalies (1970–88).
Journal of Climate, 11, 1874–1882.
Jarlan, L., Tourre, Y. M., Mougin, E., Philippon, N., & Mazzega, P. (2005). Dominant
patterns of AVHRR NDVI interannual variability over the Sahel and linkages with
key climate signals (1982–2003). Geophysical Research Letters, 32.
Jury, M. R., & Mpeta, E. J. (2009). African climate variability in the satellite era.
Theoretical and Applied Climatology, 98, 279–291.
Lamb, P. J. (1978). Large-scale tropical Atlantic surface circulation patterns associated
with sub-Saharan weather anomalies. Tellus, 30, 240–251.
Le Houérou, H. N. (1989). The grazing land ecosystems of the African Sahel. Berlin; New
York: Springer-Verlag.
Lebel, T., & Ali, A. (2009). Recent trends in the Central and Western Sahel rainfall regime
(1990–2007). Journal of Hydrology, 375, 52–64.
Los, S. O. (1998). Estimation of the ratio of sensor degradation between NOAA AVHRR
channels 1 and 2 from monthly NDVI composites. IEEE Transactions on Geoscience
and Remote Sensing, 36, 206–213.
Lu, J. (2009). The dynamics of the Indian Ocean sea surface temperature forcing of Sahel
drought. Climate Dynamics, 33, 445–460.
Mantua, N. J., Hare, S. R., Zhang, Y., Wallace, J. M., & Francis, R. C. (1997). A Pacific
interdecadal climate oscillation with impacts on salmon production. Bulletin of the
American Meteorological Society, 78, 1069–1079.
Mohino, E., Janicot, S., & Bader, J. (2010). Sahel rainfall and decadal to multi-decadal sea
surface temperature variability. Climate Dynamics, 1–22.
Moron, V. (1994). Guinean and Sahelian rainfall anomaly indexes at annual and
monthly scales (1933–1990). International Journal of Climatology, 14, 325–341.
Nicholson, S. E., Davenport, M. L., & Malo, A. R. (1990). A comparison of the vegetation
response to rainfall in the Sahel and East-Africa, using Normalized Difference
Vegetation Index from NOAA AVHRR. Climatic Change, 17, 209–241.
Nicholson, S. E., Some, B., & Kone, B. (2000). An analysis of recent rainfall conditions in
West Africa, including the rainy seasons of the 1997 El Nino and the 1998 La Nina
years. Journal of Climate, 13, 2628–2640.
Oba, G., Post, E., & Stenseth, N. C. (2001). Sub-saharan desertification and productivity
are linked to hemispheric climate variability. Global Change Biology, 7, 241–246.
Palmer, T. N. (1986). Influence of the Atlantic, Pacific and Indian Oceans on Sahel
rainfall. Nature, 322, 251–253.
Philippon, N., Jarlan, L., Martiny, N., Camberlin, P., & Mougin, E. (2007). Characterization
of the interannual and intraseasonal variability of West African vegetation between
1982 and 2002 by means of NOAA AVHRR NDVI data. Journal of Climate, 20,
1202–1218.
Pinzon, J. E., Brown, M. E., & Tucker, C. J. (2005). Hilbert–Huang transform and its
applications. In N. E. Huang (Ed.), Interdisciplinary mathematical sciences, v. 5, (pp.
xii, 311 p.). Singapore; Hackensack, NJ; London: World Scientific.
Plisnier, P. D., Serneels, S., & Lambin, E. F. (2000). Impact of ENSO on East African
ecosystems: a multivariate analysis based on climate and remote sensing data.
Global Ecology and Biogeography, 9, 481–497.
Prince, S. D. (1991). A model of regional primary production for use with coarse
resolution satellite data. International Journal of Remote Sensing, 12, 1313–1330.
Prince, S. D. (1991). Satellite remote-sensing of primary production — Comparison of
results for Sahelian grasslands 1981–1988. International Journal of Remote Sensing,
12, 1301–1311.
Prince, S. D., De Colstoun, E. B., & Kravitz, L. L. (1998). Evidence from rain-use
efficiencies does not indicate extensive Sahelian desertification. Global Change
Biology, 4, 359–374.
Propastin, P., Fotso, L., & Kappas, M. (2010). Assessment of vegetation vulnerability to
ENSO warm events over Africa. International Journal of Applied Earth Observation
and Geoinformation, 12S, 83–89.
Raicich, F., Pinardi, N., & Navarra, A. (2003). Teleconnections between Indian monsoon
and Sahel rainfall and the Mediterranean. International Journal of Climatology, 23,
173–186.
Rasmussen, M. S. (1992). Assessment of millet yields and production in northern
Burkina Faso using integrated NDVI from the AVHRR. International Journal of
Remote Sensing, 13, 3431–3442.
Reynolds, R. W., Rayner, N. A., Smith, T. M., Stokes, D. C., & Wang, W. Q. (2002). An
improved in situ and satellite SST analysis for climate. Journal of Climate, 15,
1609–1625.
Rowell, D. P. (2003). The impact of Mediterranean SSTs on the Sahelian rainfall season.
Journal of Climate, 16, 849–862.
Saji, N. H., Goswami, B. N., Vinayachandran, P. N., & Yamagata, T. (1999). A dipole mode
in the tropical Indian Ocean. Nature, 401, 360–363.
Seaquist, J. W., Hickler, T., Eklundh, L., Ardo, J., & Heumann, B. (2008). Disentangling the
effects of climate and people on Sahel vegetation dynamics. Biogeosciences
Discussions, 5, 3045–3067.
Shanahan, T. M., Overpeck, J. T., Anchukaitis, K. J., Beck, J. W., Cole, J. E., Dettman, D. L.,
Peck, J. A., Scholz, C. A., & King, J. W. (2009). Atlantic forcing of persistent drought in
West Africa. Science, 324, 377–380.
Tucker, C. J., Pinzon, J. E., Brown, M. E., Slayback, D. A., Pak, E. W., Mahoney, R., Vermote,
E. F., & El Saleous, N. (2005). An extended AVHRR 8-km NDVI dataset compatible
with MODIS and SPOT vegetation NDVI data. International Journal of Remote
Sensing, 26, 4485–4498.
Tucker, C. J., Vanpraet, C. L., Sharman, M. J., & Vanittersum, G. (1985). Satellite remote-
sensing of total herbaceous biomass production in the Senegalese Sahel — 1980–
1984. Remote Sensing of Environment, 17, 233–249.
3284 S. Huber, R. Fensholt / Remote Sensing of Environment 115 (2011) 3276–3285
10. UCAR (2011). http://www2.ucar.edu/news/backgrounders/arctic-oscillation-pineapple-
express-weather-maker-glossary (accessed Jan 2011)
Vermote, E., & Kaufman, Y. J. (1995). Absolute calibration of AVHRR visible and near-
infrared channels using ocean and cloud views. International Journal of Remote
Sensing, 16, 2317–2340.
Wang, G. L. (2003). Reassessing the impact of North Atlantic Oscillation on the sub-
Saharan vegetation productivity. Global Change Biology, 9, 493–499.
Ward,M. N. (1998). Diagnosis and short-lead time prediction ofsummerrainfall intropical
North Africa at interannual and multidecadal timescales. Journal of Climate, 11, 3167.
Williams, C. A., & Hanan, N. P. (2011). ENSO and IOD teleconnections for African
ecosystems: evidence of destructive interference between climate oscillations.
Biogeosciences, 8, 27–40.
Wolter, K., & Timlin, M. S. (1998). Measuring the strength of ENSO events: How does
1997/98 rank? Weather, 53, 315–324.
3285S. Huber, R. Fensholt / Remote Sensing of Environment 115 (2011) 3276–3285