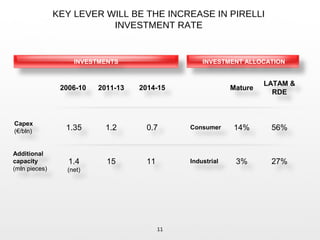
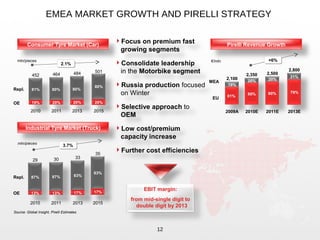
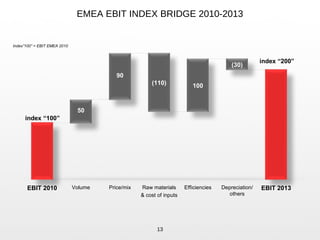
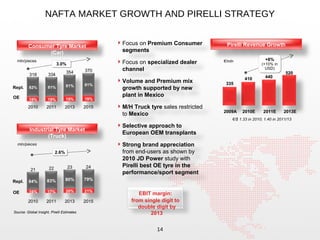
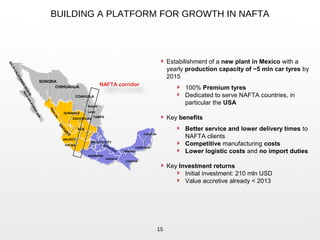
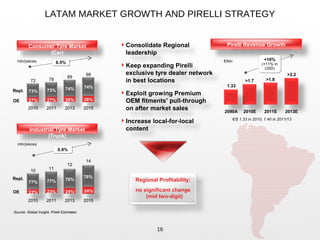
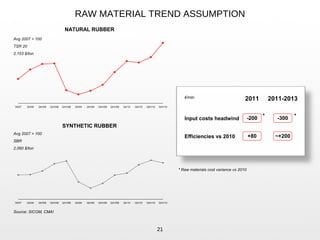
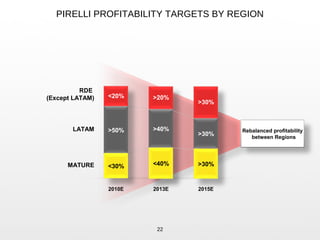
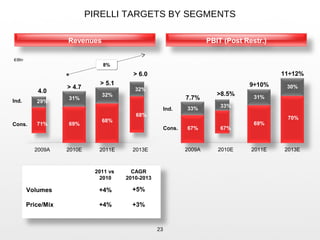
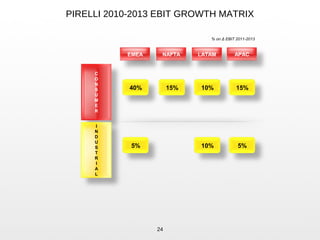
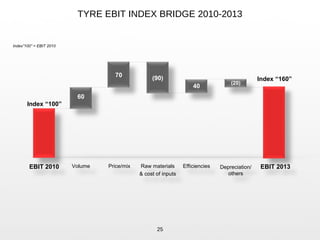
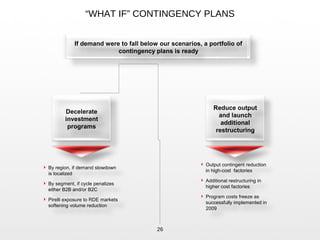
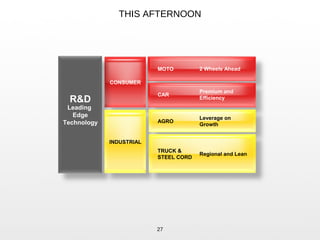
The document summarizes Pirelli's investments and targets from 2010-2013. It outlines Pirelli's strategy to increase investments and capacity across regions to capitalize on market growth, especially in premium segments. Key targets include doubling EBIT margins across most regions by 2013, growing revenues by over 30% with higher volumes and prices, and rebalancing profitability across consumer and industrial segments. Contingency plans and flexibility in sourcing strategies are also discussed to mitigate raw material cost risks.
Global Automotive Tires Market 2013-2023Visiongain
For more information on this report please contact ediz.ibrahim@visiongain.com (+44 (0) 2075499976) or refer to our website http://www.visiongain.com/Report/1089/Global-Automotive-Tires-Market-2013-2023
The report gives a quick overview of leading names in global tyre market - their size, history, country of origin, and they products and services they offer.
In cases where the companies are listed, their key financial numbers are also presented.
IBR is positive on tyre retail business - we find retail margins are good, and it is possible to offer various other auto products and services from the same outlets. Hence there is scope to value add, and increase margins even further
The us replacement tires industry outlook to 2016 sample reportAMMindpower
The present report offer detailed analysis on the US replacement tire industry with market size by value & volume, segmentation, regulations, competition and players profiling. Industry forecasting is an important part of the report which may help industry players to make strategies accordingly.
According to www.techsciresearch.com report “Vietnam Tire Market Forecast & Opportunities, 2021”, tire market in Vietnam is projected to cross US$ 3 billion by the end of 2021.
Comparison of Michelin, Goodyear, Continental, Firestone and Other Top Tire B...Unmetric
Take a deep dive into the social media habits of the products that keep you firmly on the road - your car tires. We look at how Michelin, Firestone, Bridgestone, Continental and other top tire brands engage their audiences and the content and strategies they use to market their brand to customers.
Study of e-commerce market for smartphones in IndiaPartha Bose
This is a subset of a market assessment done by IBM in early 2014. The assessment looked at the potential for e-commerce for the smartphone market in India. IBM colleagues, Sanjay Panikkar and Murali Tirupati, worked with me on this study.
Pinpoint is helping companies redefine commerce in the age of the customer. Small increases in average order frequency/size and average customer tenure translate into large increases in revenue and profit. Pinpoint shows you how implementing a campaign management solution is a key enabler of evolving to intelligent relationship marketing. This presentation outlines the following:
E-commerce and customer relationship marketing overview:
-Customer engagement
-Market opportunities
-Moving from transactional marketing to relationship marketing
-Business impacts
Adding campaign management to E-commerce:
-Solution components
-Merging online behavior with e-commerce activity
-Data organization
-Cross-brand integration- the enterprise customer model
-Coordinating promotions
-Marketing performance measurement and reporting
Business Advantages of Enhanced CRM:
-Greater average order size
-Increased revenue per customer
-Longer average customer tenure
-Improved customer profitability
-Reduced time to market for new programs/offers
-Continuous improvement in messaging relevance
-Ease of integrating additional brands
Importance of advertisement in e commerceyatheesh km
Importance of Advertisement ,types of advertisement ,result of advertisement ,how advertisement help to e-commerce ,result of advertisement ,internet growth in advertisement
Sip presentation (Market Analytics of Bridges tone Tyres in Jaipur)Siddharth Bothra
This is Brief sip Presentation on Bridgestone india Pvt. Ltd.. i think it is very much useful for those who are in need of Matters related to tyres and how to execute it.
With more than 200 million users‚ India has the third largest number of internet users in the world after China and USA. And yet‚ online retail stands at 8% of organized retail and only 0.5% of overall retail market in India. The e–tailing market is thus poised to grow at a massive 55% p.a. from INR 139 billion in FY13 to INR 504 billion in FY16. A major reason for this rapid growth has been consumer access to products at attractive prices. The e–commerce business model has facilitated cutting out expensive real estate by reaching the consumer directly and thereby being able to offer better prices to consumers.
Taobao vs. eBay - The battle within the Chinese eCommerce marketYannick Pinkinelli
Team presentation in the module Global Strategy with the task to analyze the battle between eBay and Taobao within the Chinese eCommerce market and its inferences.
ARTIFICIAL INTELLIGENCE (AI) ENABLED TRANSPORTATION - DISRUPTING AND OPTIMIZI...ANNATHOMAS89
Transport in developing or emerging markets often faces severe challenges due to growing populations, urbanization, poor infrastructure, and rising prosperity in some regions, increasing cargo volumes, vehicle traffic, and pollution. Artificial intelligence (AI) offers new solutions to these challenges by making market entry more comfortable and allowing countries/geographies to reach underserved populations, creating market opportunities and private sector investment opportunities associated with them.
AUTOMOTIVE TYRE INDUSTRY: RESTRATEGIZING DURING PANDEMICShellyBhede
Tyre manufacturing and its distribution or service shops around the globe have adjusted to a new way of business with safety precautions in the worksite and less foot traffic as efforts to stop the COVID-19 virus spread.
Resurrecting indian automobile industryVivek Yadav
India is one of the largest markets of automotive industry in the world. It had previously been one of the fastest growing industries globally, but is currently experiencing flat or negative growth rates. The automotive industry comprises of the automobile and the auto component sectors. It includes passenger cars, utility vehicles, vans; light, medium and heavy commercial vehicles; passenger carriers and goods carrier three wheelers; scooters, motor‐ cycles, mopeds; jeeps, tractors etc; and auto components like engine parts, suspension and braking parts, drive and transmission parts, electrical, body and chassis parts; etc.
The financial figures of Indian automotive segments show that there was a substantial growth rate till FY 2010-11. But these margins have declined in FY 2011-12 and further dipped in FY 2012-13. And these margins have declined for the entire industry and not only for a single segment or player.
Pirelli 1Q 2010 Financial Results and Pirelli Real Estate Separation Plan with Financial Review, Pirelli Real Estate Results 1Q 2010, Pirelli Tyre and Parts Results 1Q 2010, presented in Milan on May 5, 2010.
Abstract from Pirelli Group H1-’09 Financial Results, this presentation is about Pirelli Real Estate results.
More on: http://pirelli.webcasting.it/2907/client/?lang=eng
Claudio De Conto, General Manager Operations at Pirelli & C. S.p.A. illustrates both a) Pirelli Group 2008 Key Financial Results and b) Pirelli Group ‘09 –‘11: Net Financial Position Targets.
More on: http://industrial-plan.pirelli.com/idayPost/jsp/downloadArea.jsp
Pirelli Presentation of 1H 2009 Group Results.
Pirelli & C. Group Revenues: 2,137.6 Million Euros (2,454.8 Million Euros As Of 30 June 2008). Ebit 101.1 Million Euros (180.9 Million Euros As Of 30 June 2008) After Restructuring Charges Of 21.2 Million Euros; Incidence On Revenues Of 4.7% In Line With Industrial Plan Targets. Attributable Consolidated Net Result: 6.3 Million Euros (-36.2 Million Euros As Of 30 June 2008; Total Consolidated Net Result Negative For 12.4 Million Euros (-9.5 Million Euros As Of 30 June 2008), Positive Net Of Further 19.8 Million Euro Writedown Of Telecom Italia Stake. Net Financial Position Negative For 1,107.6 Million Euros, from 1,278.9 Million Euros As Of 31 March 2009.
Pirelli Tyre Revenues 1,915.9 Million Euros (-9.3% On A Like-For-Like Basis, Net Of Exchange Rate Effects, Compared With First Half 2008); Ebit Before Restructuring Costs: 146.5 Million Euros, Or 7.6% Of Revenues. Second Quarter Revenues Up 6.7% Compared With The First Quarter Of 2009; Second Quarter Ebit Margin Before Restructuring Charges Rose To 8.6% From 8.1% In The Second Quarter Of 2008.
More on: http://www.pirelli.com/web/investors/presentation/archive_pres/default.page
2009-2011 Industrial Plan: Strategic Guidelines and Targets.
Pirelli Group has and will continue to develop measures to increase its competitiveness and enhance its efficiency.
More on: http://industrial-plan.pirelli.com/idayPost/jsp/downloadArea.jsp
Reorganization, Business rationalization as well as the development of "green" technologies and products will be the levers supporting Pirelli in this process.
More from PIRELLI OFFICIAL SLIDESHARE NETWORK (10)
3. AGENDA
INVESTMENT ALLOCATION
TYRE MARKET VALUE
PLAN ORGANIZATION: A TIGHT MATRIX
PIRELLI BY REGION
TYRE MARKET VOLUME AND INDUSTRY INVESTMENTS
STRATEGY IMPLEMENTATION
PIRELLI TARGETS BY MATRIX
“WHAT IF” CONTINGENCY PLANS
3
4. WORLD TYRE MARKET TREND
Source: Tire Business reports for 2000-2009
+9%+9%
-10.0%-10.0%
2000 2001 2002 2003 2004 2005 2006 2007 2008 2009
70
69
72
80
93
103
112
128
140
126
4
CAGR
$/bln
6. WORLD TYRE MARKET: 5-YEAR FORECAST
Source: 2010-2015 Global Insight, Pirelli Estimates
>190
10%10%
+7%+7%
2009 2010 2011 2012 2013 2014 2015
126
140
~150
6
$/bln
Total Market
CAGR
7. PIRELLI ESTIMATES MATCH INDUSTRY ANNOUNCEMENTS IN THE
TYRE MARKET FOR CARS
7
~50% ~20%
~30%
In 2015, China will represent
~20% of world capacity
2011-2015 ADDITIONAL INDUSTRY CAPACITY
CAGR
1.5
+3.6%+3.6%
+4.7%+4.7%
CAR TYRES
LATAM+APAC
EMEA+NAFTA
bln/pieces
1.2
1.4
46%44%
2010 201
3
201
5
Source: Global Insight, Pirelli Estimates
+6.6%
+2.3%+2.3%
No foreseen
overcapacity
China India Others Total
56% 54%
41%
59%
~300 mln pcs Net Capex for 15 $/bln
(-30 mln pcs divested)
Source: Pirelli Estimates based on tyre manifactures announcements
8. AND FOR TRUCKS
8
~40%
~40%
~20%
~40 mln pcs Net Capex for 10 $/bln
(-2 mln pcs divested)
China India Others Total
No foreseen
overcapacity
+5.3%+5.3%
+6.2%+6.2%
mln/pieces (All Steel)
2010 2013 2015
+7.5%
+2.1%+2.1%
124
70%
148
164
2011-2015 ADDITIONAL INDUSTRY CAPACITYTRUCK TYRES
LATAM+APAC
EMEA+NAFTA
In 2015, China will represent
~50% of world capacity
30%
67%
73%
27%33%
CAGRSource: Global Insight, Pirelli Estimates Source: Pirelli Estimates based on tyre manifactures announcements
2010 201
3
201
5
9. PIRELLI MANAGED THROUGH A TIGHT MATRIX
Strategic deployment
Value proposition
Best practices
Digital innovation
9
EMEA NAFTA LATAM APAC
Product & Process
proprietary
technology
Breakthrough design
Time-to-market
Day-to-day delivery
Cost optimization
Regional adaptation
People development
Revenues size indication
C
O
N
S
U
M
E
R
I
N
D
U
S
T
R
I
A
L
R&D
10. PIRELLI STRATEGIC IMPLEMENTATION
10
EMEA NAFTA LATAM APAC
Improve focus
Streamline
operations
Increase
efficiency
Keep lean
Improve scale
economies
Stay regional
Time-to-market
and Premium
customization
Platform and
component
standardization
Innovative
material
solutions and
processing
Revenues size indication
C
O
N
S
U
M
E
R
I
N
D
U
S
T
R
I
A
L
R&D
11. KEY LEVER WILL BE THE INCREASE IN PIRELLI
INVESTMENT RATE
1.2 0.7
15 11
1.35
1.4
(net)
11
Capex
(€/bln)
Additional
capacity
(mln pieces)
2011-13 2014-152006-10
INVESTMENT ALLOCATIONINVESTMENTS
Consumer
Industrial
14% 56%
3% 27%
Mature
LATAM &
RDE
12. EMEA MARKET GROWTH AND PIRELLI STRATEGY
12
EBIT margin:
from mid-single digit to
double digit by 2013
80%
464 484 501
81%
452
2.1%2.1%
Consumer Tyre Market (Car)
mln/pieces
OE
Repl.
2011 2013 20152010
19% 20%
80% 80%
87% 83%
29 30 33
35
3.7%3.7%
83%
87%
Industrial Tyre Market (Truck)
mln/pieces
OE
Repl.
2011 2013 20152010
13% 17%
Focus on premium fast
growing segments
Consolidate leadership
in the Motorbike segment
Russia production focused
on Winter
Selective approach to
OEM
Low cost/premium
capacity increase
Further cost efficiencies
Source: Global Insight, Pirelli Estimates
Pirelli Revenue Growth
MEA
EU
+6%+6%
2,500
2,800
21%
2,350
20%
€/mln
2011E 2013E2010E
2,100
19%
2009A
20%
13% 17%
20% 20%
79%
81%
80% 80%
13. EMEA EBIT INDEX BRIDGE 2010-2013
Depreciation/
others
EfficienciesPrice/mix Raw materials
& cost of inputs
Volume EBIT 2013EBIT 2010
index “200”
(30)
100
90
index “100”
50
(110)
13
Index”100” = EBIT EMEA 2010
14. Focus on Premium Consumer
segments
Focus on specialized dealer
channel
Volume and Premium mix
growth supported by new
plant in Mexico
M/H Truck tyre sales restricted
to Mexico
Selective approach to
European OEM transplants
Strong brand appreciation
from end-users as shown by
2010 JD Power study with
Pirelli best OE tyre in the
performance/sport segment
NAFTA MARKET GROWTH AND PIRELLI STRATEGY
14
EBIT margin:
from single digit to
double digit by
2013
2.6%2.6%
22 23 24
21
83% 80% 79%84%
Industrial Tyre Market
(Truck)
2011 2013 20152010
OE
Repl.
mln/pieces
16% 17% 20% 21%
81% 81% 81%
82%
3.0%3.0%
334
354 370
318
Consumer Tyre Market
(Car)
2011 2013 20152010
OE
Repl.
mln/pieces
18% 19% 19% 19%
Source: Global Insight, Pirelli Estimates
410 440
Pirelli Revenue Growth
2011E 2013E2010E
335
2009A
+8%
(+10% in
USD)
+8%
(+10% in
USD)
520
€/mln
€/$ 1.33 in 2010; 1.40 in 2011/13
16. LATAM MARKET GROWTH AND PIRELLI STRATEGY
16
Regional Profitability:
no significant change
(mid two-digit)
76%
76%
10
77%77%
11
12
14
6.8%6.8%
2011 2013 20152010
Industrial Tyre Market
(Truck)
mln/pieces
OE
Repl.
23% 23% 24% 24%
6.5%6.5%
78
89
98
72
73% 74% 74%
73%
2011 2013 20152010
Consumer Tyre Market
(Car)
mln/pieces
OE
Repl.
27% 27% 26% 26%
Consolidate Regional
leadership
Keep expanding Pirelli
exclusive tyre dealer network
in best locations
Exploit growing Premium
OEM fitments’ pull-through
on after market sales
Increase local-for-local
content
Source: Global Insight, Pirelli Estimates
>1.7
>2.2
>1.8
2011E 2013E2010E
Pirelli Revenue Growth
1.33
2090A
€/$ 1.33 in 2010; 1.40 in 2011/13
+10%
(+11% in
USD)
+10%
(+11% in
USD)
€/bln
17. brand, dealer exclusivity and product
range
an historical presence in terms of local
production
a leading market share in all business
segment
LATAM
0.9
2005 2007 2009
1.2 1.3
2010E
1.7
… and over 11,000
employees
Campinas
7 plants
Santo André
Gravatai
Sumaré
No.1 Brand
Top-of-mind brand in Mercosur
Elected no. 1 brand in all sectors
Strongest dealers network
Best range
No. 1 local OEM strategic supplier
The only full range player: from 2 wheels to
Truck to Agro
17
A success story of regional leadership,
with sales exceeding 1.7 bln €
#1 #1 #1 #1
Feira de Santana
Merlo
Guacara
€/bln
18. ASIA – PACIFIC MARKET GROWTH AND PIRELLI STRATEGY
Focus on China Premium
consumer market
OEM selection among
premium (EU transplants)
Leverage on F1 to enhance
brand awareness across the
region
China factory becoming high-
end full range: Truck, Car,
Moto, Steelcord
Export hub also for MEA and
Nafta markets (not only APAC)
Regional Profitability:
from single digit to
double digit by 2013
18
OE
Repl.
mln/pieces
55
%
55%
7.2%7.2%
412
474
536
378
2011 2013 20152010
54%54%
Consumer Tyre Market
(Car)
46% 46% 45% 45%
mln/pieces
OE
Repl.
80%
79%
78%
63
81%
80
91
69
7.6%7.6%
2011 2013 20152010
Industrial Tyre Market
(Truck)
19% 20% 21% 22%
Source: Global Insight, Pirelli Estimates
€/mln
2011E 2013E2010E
270
470
310
Pirelli Revenue Growth
2009A
231
+20%
(+22% in
USD)
+20%
(+22% in
USD)
€/$ 1.33 in 2010; 1.40 in 2011/13
19. DEVELOPING PIRELLI PRESENCE IN THE CHINESE MARKET
Planned investments will raise
Pirelli capacity to serve the fast
growing Chinese mkt
Truck tyres Car tyres
+40%
+100%
19
Optimal location: half way
between seaside and
metropolitan areas
Competitive labor cost
Competitive energy cost
Additional capacity by 2013
Largest and best located industrial
compound among tyre peers
20. STRATEGIC SOURCING: FOUR KEY DIRECTIONS
Source: SICOM, oilnergy.com
20
GETTING CLOSER TO NATURAL RUBBER
PLANTATIONS
OPEN INNOVATION WITH KEY SYNTHETIC
RUBBER PLAYERS
DEVELOPING NEW BIOMATERIALS
REPLACING NON-GREEN ONES
INCREASING STEEL CORD PRODUCTION
TO MAINTAIN VERTICALIZATION
Brazil
Turkey
Cina
Romania
BrazilBrazil
Brazil
Italy
Germany
Russia Cina
Japan
Liberia
Vietnam
Indonesia
24. PIRELLI 2010-2013 EBIT GROWTH MATRIX
40% 15% 10% 15%
5% 10% 5%
24
% on Δ EBIT 2011-2013
EMEA NAFTA LATAM APAC
C
O
N
S
U
M
E
R
I
N
D
U
S
T
R
I
A
L
25. TYRE EBIT INDEX BRIDGE 2010-2013
25
Index”100” = EBIT 2010
Depreciation/
others
Raw materials
& cost of inputs
EfficienciesPrice/mixVolume EBIT 2013EBIT 2010
Index “160”
Index “100”
40
(20)
60
70 (90)70
26. “WHAT IF” CONTINGENCY PLANS
If demand were to fall below our scenarios, a portfolio of
contingency plans is ready
Decelerate
investment
programs
Reduce output
and launch
additional
restructuring
26
By region, if demand slowdown
is localized
By segment, if cycle penalizes
either B2B and/or B2C
Pirelli exposure to RDE markets
softening volume reduction
Output contingent reduction
in high-cost factories
Additional restructuring in
higher cost factories
Program costs freeze as
successfully implemented in
2009
28. DISCLAIMER
28
This presentation contains statements that constitute forward-looking statements based on Pirelli & C SpA’s
current expectations and projections about future events and does not constitute an offer or solicitation for the
sale, purchase or acquisition of securities of any of the companies mentioned and is directed to professionals of
the financial community.
These statements appear in a number of places in this presentation and include statements regarding the intent,
belief or current expectations of the customer base, estimates regarding future growth in the different business
lines and the global business, market share, financial results and other aspects of the activities and situation
relating to the Company.
Such forward looking statements are not guarantees of future performance and involve risks and uncertainties,
and actual results may differ materially from those expressed in or implied by these forward looking statements as
a result of various factors, many of which are beyond the ability of Pirelli & C SpA to control or estimate precisely.
Consequently it is recommended that they be viewed as indicative only.
Analysts are cautioned not to place undue reliance on those forward looking statements, which speak only as of
the date of this presentation.
Pirelli & C. SpA undertakes no obligation to release publicly the results of any revisions to these forward looking
statements which may be made to reflect events and circumstances after the date of this presentation, including,
without limitation, changes in Pirelli & C. SpA business or acquisition strategy or to reflect the occurrence of
unanticipated events.
The Manager mandated to draft corporate accounting documents of Pirelli & C. SpA. Francesco Tanzi, attests –
as per art.154-bis. comma 2 of the Testo Unico della Finanza (D.Lgs. 58/1998) – that all the accounting
information contained in this presentation correspond to the documented results, books and accounting of the
Company.