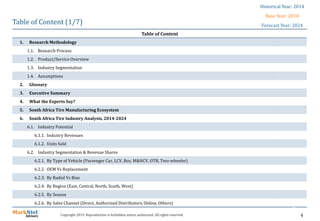
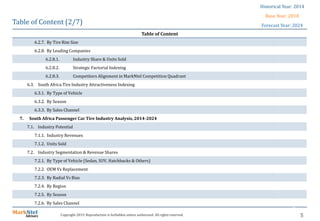
The document provides an overview of the South Africa tire market analysis for 2019-2024. Some key points:
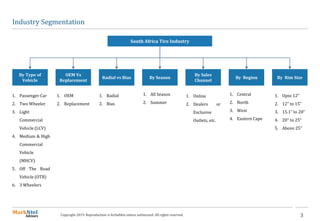
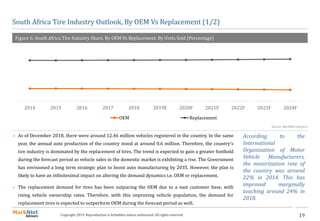
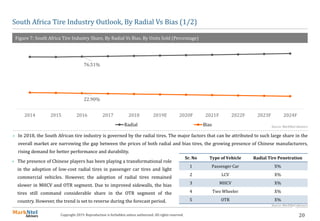
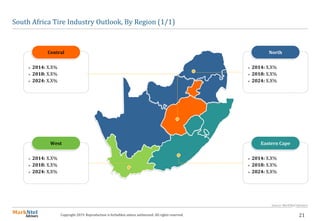
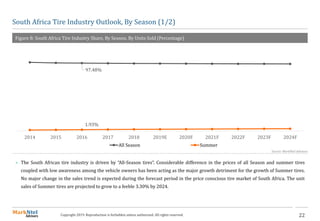
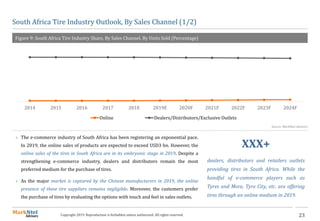
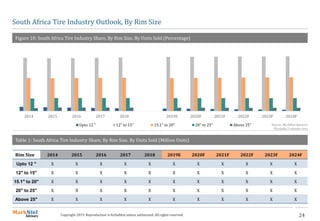
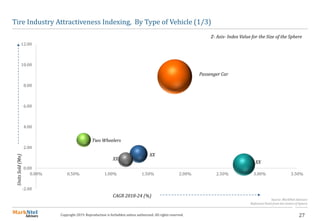
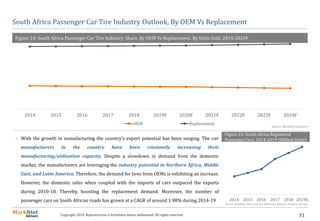
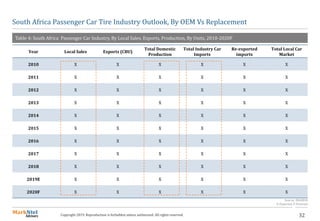
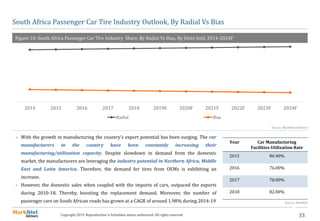
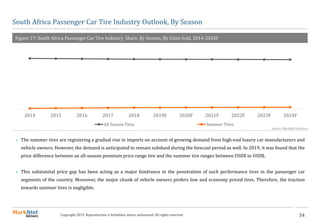
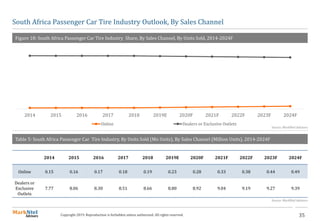
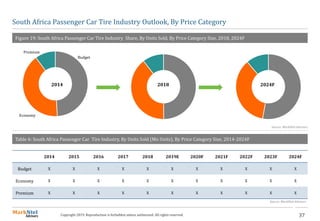
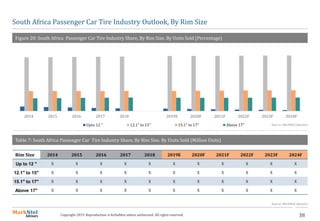
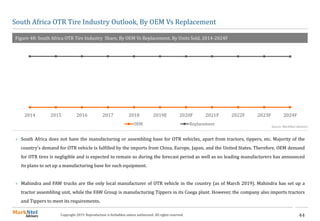
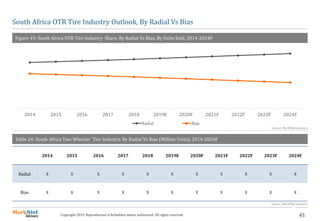
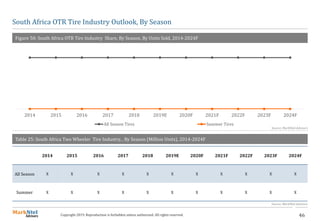
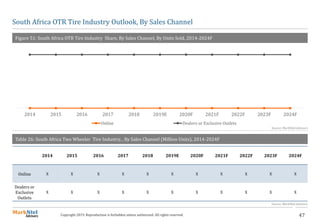
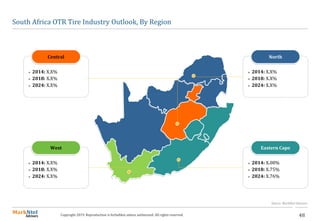
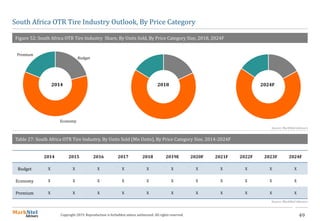
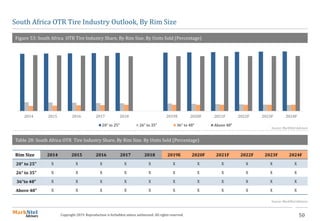
- The tire market is segmented by type of vehicle, OEM vs replacement, radial vs bias, region, season, sales channel, and rim size.
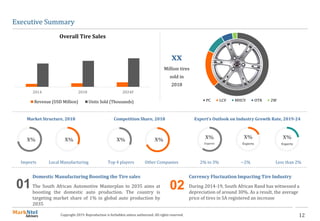
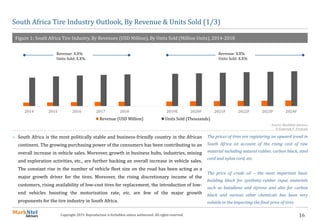
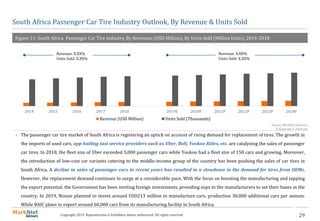
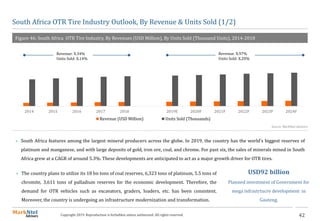
- Total tire sales are expected to grow from $X million in 2018 to $X million in 2024, with units sold growing from X million in 2018 to X million in 2024.
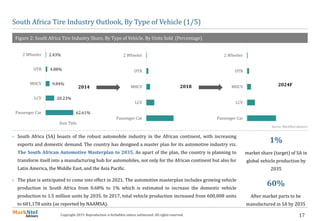
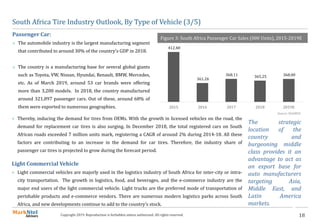
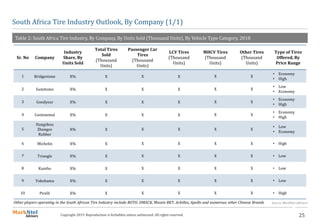
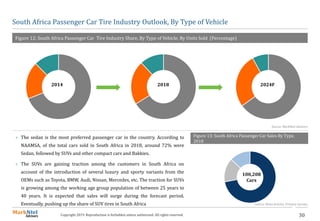
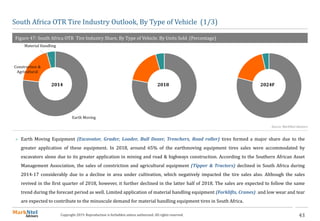
- Passenger cars account for over 60% of tire sales currently, though the share of commercial vehicles is growing due to increasing transportation and logistics needs. The passenger car market is supported by growing vehicle production and ownership in South Africa.


![[DSC Europe 25] Bojan Djuricic - Predictive Design Process.pdf](https://cdn.slidesharecdn.com/ss_thumbnails/5awdrbedqdek3gqu2ezy-4-the-predictive-design-bojan-djuricic-260120105856-6c399e9b-thumbnail.jpg?width=640&height=640&fit=bounds)


![[DSC Europe 25] Slobodan Dolinic - Smart and Intelligent Green Region.pptx](https://cdn.slidesharecdn.com/ss_thumbnails/0bribinjsp6ghwtvsvor-2-sigre-slobodan-dolinic-260115093812-c9c10e90-thumbnail.jpg?width=640&height=640&fit=bounds)

![[DSC Europe 25] Ivan Lukovic & Marija Djukic - From Data to Value: Why Maturi...](https://cdn.slidesharecdn.com/ss_thumbnails/ahrfps8xr6knowwhacxh-1-ivan-marija-dsc-2025-ld-v1-presentation-260115093812-be21adfc-thumbnail.jpg?width=640&height=640&fit=bounds)
![[DSC Europe 25] Andrzej Kowalczyk - AI - how to start small and grow in the f...](https://cdn.slidesharecdn.com/ss_thumbnails/oy1zmo94qv6vpcqjvno2-andrzej-kowalczyk-ai-how-to-start-small-and-grow-in-the-future-1-260119121559-cf093b23-thumbnail.jpg?width=640&height=640&fit=bounds)


