Downloaded 1,194 times

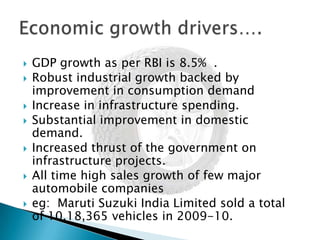
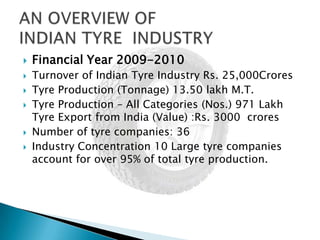
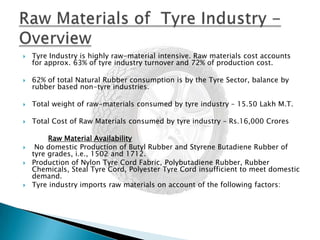

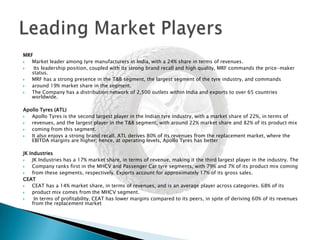


The document provides an overview of the Indian tyre industry. Some key points: - The Indian tyre industry had a turnover of Rs. 25,000 crores in 2009-2010, producing 13.5 lakh metric tons of tyres. The top 10 companies account for over 95% of production. - Raw materials like natural rubber, butyl rubber, and nylon account for 63% of industry costs. India imports some raw materials due to insufficient domestic production. - Growth in the automobile industry, driven by rising incomes, GDP growth, and infrastructure spending, is driving demand for tyres. Major automobile companies are expanding production. - Leading tyre manufacturers include MRF,