Investigation on ext4 filesystem of current Linux
This slide focuses on ext4 disk layout.
Ext4 filesystem(2)
http://www.slideshare.net/YoshihiroYunomae/ext4-filesystem2
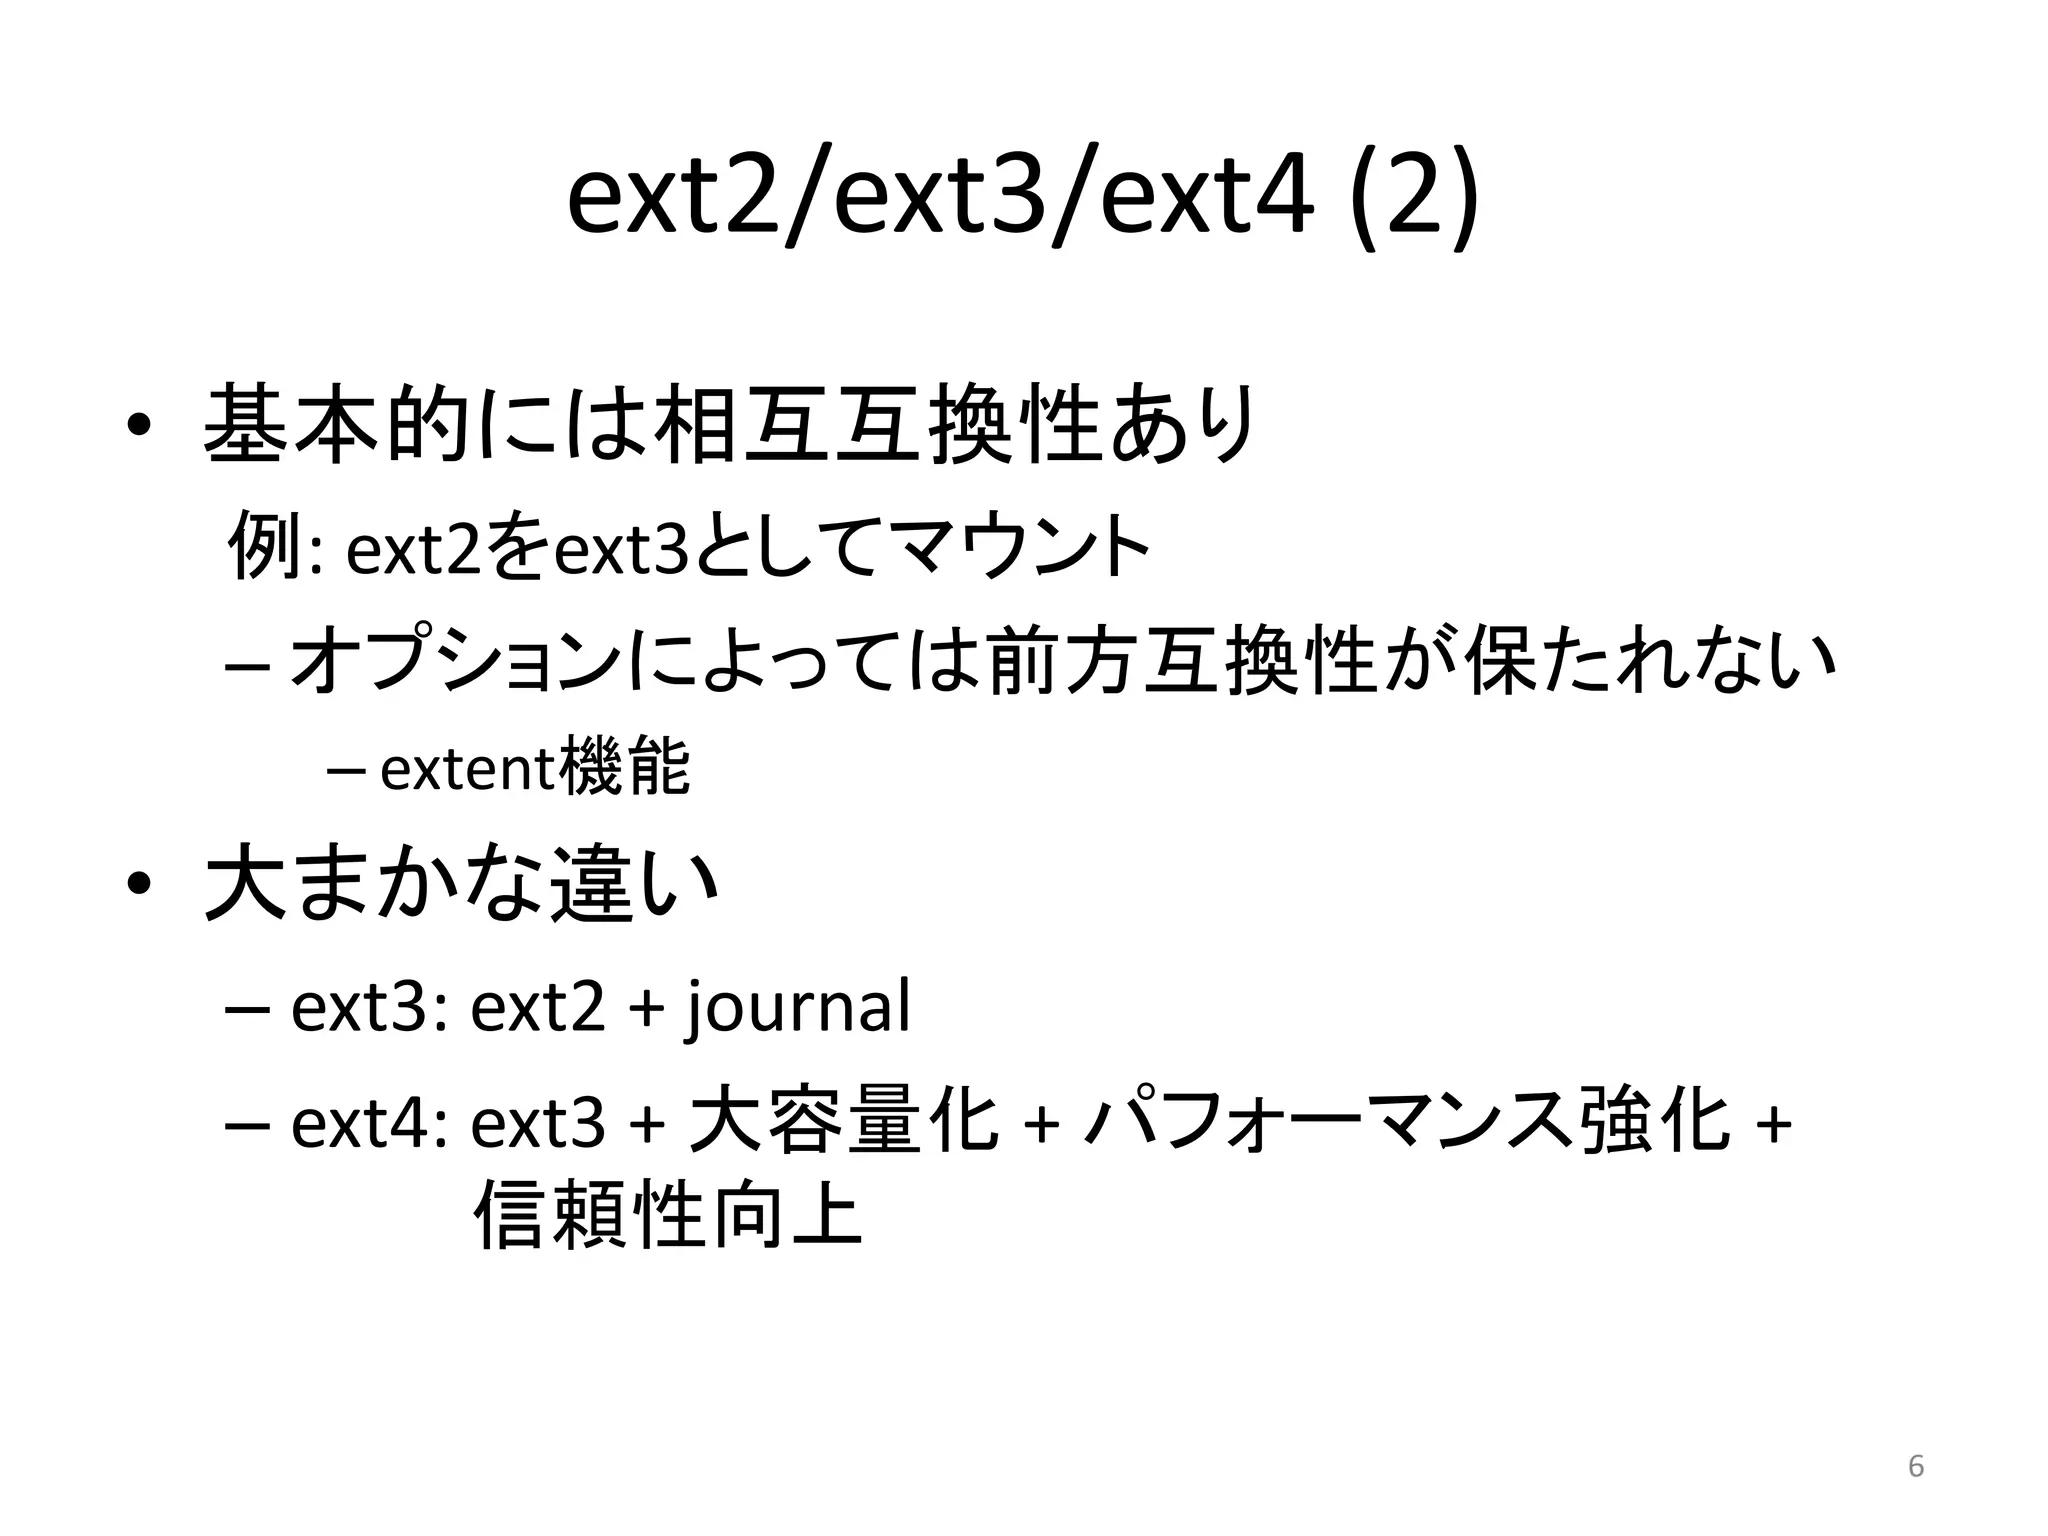
• 基本的なレイアウト
– 基本的にはext2/ext3と同様(メタデータの中身は異なる)
–mkfs時にいくつかのオプションを指定していたらレイアウトが変わる(次ス
ライド以降)
14
ext4のdisk layout
Super
Block
Group
Descriptors
data block
bitmap
Reserved
GDT
Blocks
inode
Bitmaps
inode
table
data
blocks
1024byte
1block n blocks n blocks n blocks n blocks1 block 1 block
block group 0 block group 1 block group N…
padding: ブートセクター用にreserve
Super Block: ext4_super_block構造体を格納。全体を管理しているのでこれが壊れるとまずい。
Group Descriptors: 全ブロックグループのグループディスクリプタ(ext4_group_desc構造体)を格納。
Reserved GDT Blocks: 将来用にreserve
data block bitmap: ブロックグループ内の空きデータブロックの管理
inode bidmaps: ブロックグループ内の空きinodeの管理
inode table: inode構造体を格納(ext4よりデフォルトで256byteなので1blockあたり16個)
data blocks: 実際のデータ
padding
metadata
16.
15
ext4_super_block構造体
struct ext4_super_block {
/*00*/__le32 s_inodes_count; /* Inodes count */
__le32 s_blocks_count_lo; /* Blocks count */
__le32 s_r_blocks_count_lo; /* Reserved blocks count */
__le32 s_free_blocks_count_lo; /* Free blocks count */
/*10*/ __le32 s_free_inodes_count; /* Free inodes count */
__le32 s_first_data_block; /* First Data Block */
__le32 s_log_block_size; /* Block size */
__le32 s_log_cluster_size; /* Allocation cluster size */
/*20*/ __le32 s_blocks_per_group; /* # Blocks per group */
__le32 s_clusters_per_group; /* # Clusters per group */
__le32 s_inodes_per_group; /* # Inodes per group */
__le32 s_mtime; /* Mount time */
/*30*/ __le32 s_wtime; /* Write time */
__le16 s_mnt_count; /* Mount count */
__le16 s_max_mnt_count; /* Maximal mount count */
__le16 s_magic; /* Magic signature */
__le16 s_state; /* File system state */
__le16 s_errors; /* Behaviour when detecting errors */
__le16 s_minor_rev_level; /* minor revision level */
/*40*/ __le32 s_lastcheck; /* time of last check */
__le32 s_checkinterval; /* max. time between checks */
__le32 s_creator_os; /* OS */
__le32 s_rev_level; /* Revision level */
17.
16
ext4_super_block構造体
/*50*/ __le16 s_def_resuid;/* Default uid for reserved blocks */
__le16 s_def_resgid; /* Default gid for reserved blocks */
__le32 s_first_ino; /* First non-reserved inode */
__le16 s_inode_size; /* size of inode structure */
__le16 s_block_group_nr; /* block group # of this superblock */
__le32 s_feature_compat; /* compatible feature set */
/*60*/ __le32 s_feature_incompat; /* incompatible feature set */
__le32 s_feature_ro_compat; /* readonly-compatible feature set */
/*68*/ __u8 s_uuid[16]; /* 128-bit uuid for volume */
/*78*/ char s_volume_name[16]; /* volume name */
/*88*/ char s_last_mounted[64]; /* directory where last mounted */
/*C8*/ __le32 s_algorithm_usage_bitmap; /* For compression */
__u8 s_prealloc_blocks; /* Nr of blocks to try to preallocate*/
__u8 s_prealloc_dir_blocks; /* Nr to preallocate for dirs */
__le16 s_reserved_gdt_blocks; /* Per group desc for online growth */
/*D0*/ __u8 s_journal_uuid[16]; /* uuid of journal superblock */
/*E0*/ __le32 s_journal_inum; /* inode number of journal file */
__le32 s_journal_dev; /* device number of journal file */
__le32 s_last_orphan; /* start of list of inodes to delete */
__le32 s_hash_seed[4]; /* HTREE hash seed */
__u8 s_def_hash_version; /* Default hash version to use */
__u8 s_jnl_backup_type;
__le16 s_desc_size; /* size of group descriptor */
18.
17
ext4_super_block構造体
/*100*/ __le32 s_default_mount_opts;
__le32s_first_meta_bg; /* First metablock block group */
__le32 s_mkfs_time; /* When the filesystem was created */
__le32 s_jnl_blocks[17]; /* Backup of the journal inode */
/* 64bit support valid if EXT4_FEATURE_COMPAT_64BIT */
/*150*/ __le32 s_blocks_count_hi; /* Blocks count */
__le32 s_r_blocks_count_hi; /* Reserved blocks count */
__le32 s_free_blocks_count_hi; /* Free blocks count */
__le16 s_min_extra_isize; /* All inodes have at least # bytes */
__le16 s_want_extra_isize; /* New inodes should reserve # bytes */
__le32 s_flags; /* Miscellaneous flags */
__le16 s_raid_stride; /* RAID stride */
__le16 s_mmp_update_interval; /* # seconds to wait in MMP checking */
__le64 s_mmp_block; /* Block for multi-mount protection */
__le32 s_raid_stripe_width; /* blocks on all data disks (N*stride)*/
__u8 s_log_groups_per_flex; /* FLEX_BG group size */
__u8 s_checksum_type; /* metadata checksum algorithm used */
__le16 s_reserved_pad;
__le64 s_kbytes_written; /* nr of lifetime kilobytes written */
__le32 s_snapshot_inum; /* Inode number of active snapshot */
__le32 s_snapshot_id; /* sequential ID of active snapshot */
__le64 s_snapshot_r_blocks_count; /* reserved blocks for active
snapshot's future use */
19.
18
ext4_super_block構造体
__le32 s_snapshot_list; /*inode number of the head of the
on-disk snapshot list */
#define EXT4_S_ERR_START offsetof(struct ext4_super_block, s_error_count)
__le32 s_error_count; /* number of fs errors */
__le32 s_first_error_time; /* first time an error happened */
__le32 s_first_error_ino; /* inode involved in first error */
__le64 s_first_error_block; /* block involved of first error */
__u8 s_first_error_func[32]; /* function where the error happened */
__le32 s_first_error_line; /* line number where error happened */
__le32 s_last_error_time; /* most recent time of an error */
__le32 s_last_error_ino; /* inode involved in last error */
__le32 s_last_error_line; /* line number where error happened */
__le64 s_last_error_block; /* block involved of last error */
__u8 s_last_error_func[32]; /* function where the error happened */
#define EXT4_S_ERR_END offsetof(struct ext4_super_block, s_mount_opts)
__u8 s_mount_opts[64];
__le32 s_usr_quota_inum; /* inode for tracking user quota */
__le32 s_grp_quota_inum; /* inode for tracking group quota */
__le32 s_overhead_clusters; /* overhead blocks/clusters in fs */
__le32 s_backup_bgs[2]; /* groups with sparse_super2 SBs */
__le32 s_reserved[106]; /* Padding to the end of the block */
__le32 s_checksum; /* crc32c(superblock) */
};
20.
19
ext4_super_block構造体
__le32 s_snapshot_list; /*inode number of the head of the
on-disk snapshot list */
#define EXT4_S_ERR_START offsetof(struct ext4_super_block, s_error_count)
__le32 s_error_count; /* number of fs errors */
__le32 s_first_error_time; /* first time an error happened */
__le32 s_first_error_ino; /* inode involved in first error */
__le64 s_first_error_block; /* block involved of first error */
__u8 s_first_error_func[32]; /* function where the error happened */
__le32 s_first_error_line; /* line number where error happened */
__le32 s_last_error_time; /* most recent time of an error */
__le32 s_last_error_ino; /* inode involved in last error */
__le32 s_last_error_line; /* line number where error happened */
__le64 s_last_error_block; /* block involved of last error */
__u8 s_last_error_func[32]; /* function where the error happened */
#define EXT4_S_ERR_END offsetof(struct ext4_super_block, s_mount_opts)
__u8 s_mount_opts[64];
__le32 s_usr_quota_inum; /* inode for tracking user quota */
__le32 s_grp_quota_inum; /* inode for tracking group quota */
__le32 s_overhead_clusters; /* overhead blocks/clusters in fs */
__le32 s_backup_bgs[2]; /* groups with sparse_super2 SBs */
__le32 s_reserved[106]; /* Padding to the end of the block */
__le32 s_checksum; /* crc32c(superblock) */
};
21.
20
ext4_inode構造体
struct ext4_inode {
__le16i_mode; /* File mode */
__le16 i_uid; /* Low 16 bits of Owner Uid */
__le32 i_size_lo; /* Size in bytes */
__le32 i_atime; /* Access time */
__le32 i_ctime; /* Inode Change time */
__le32 i_mtime; /* Modification time */
__le32 i_dtime; /* Deletion Time */
__le16 i_gid; /* Low 16 bits of Group Id */
__le16 i_links_count; /* Links count */
__le32 i_blocks_lo; /* Blocks count */
__le32 i_flags; /* File flags */
union {
struct {
__le32 l_i_version;
} linux1;
…
} osd1; /* OS dependent 1 */
__le32 i_block[EXT4_N_BLOCKS];/* Pointers to blocks */
__le32 i_generation; /* File version (for NFS) */
__le32 i_file_acl_lo; /* File ACL */
__le32 i_size_high;
__le32 i_obso_faddr; /* Obsoleted fragment address */
22.
21
ext4_inode構造体
union {
struct {
__le16l_i_blocks_high; /* were l_i_reserved1 */
__le16 l_i_file_acl_high;
__le16 l_i_uid_high; /* these 2 fields */
__le16 l_i_gid_high; /* were reserved2[0] */
__le16 l_i_checksum_lo;/* crc32c(uuid+inum+inode) LE */
__le16 l_i_reserved;
} linux2;
…
} osd2; /* OS dependent 2 */
__le16 i_extra_isize;
__le16 i_checksum_hi; /* crc32c(uuid+inum+inode) BE */
__le32 i_ctime_extra; /* extra Change time (nsec << 2 | epoch) */
__le32 i_mtime_extra; /* extra Modification time(nsec << 2 | epoch) */
__le32 i_atime_extra; /* extra Access time (nsec << 2 | epoch) */
__le32 i_crtime; /* File Creation time */
__le32 i_crtime_extra; /* extra FileCreationtime (nsec << 2 | epoch) */
__le32 i_version_hi; /* high 32 bits for 64-bit version */
};
128byte超
Sparse super blockのレイアウト
25
Super
Block
Group
Descriptors
datablock
bitmap
Reserved
GDT
Blocks
inode
Bitmaps
inode
table
data
blocksgroup 0
Super
Block
Group
Descriptors
data block
bitmap
Reserved
GDT
Blocks
inode
Bitmaps
inode
table
data
blocksgroup 1
data block
bitmap
inode
Bitmaps
inode
table data blocksgroup 2
Super
Block
Group
Descriptors
data block
bitmap
Reserved
GDT
Blocks
inode
Bitmaps
inode
table
data
blocksgroup 3
30
Meta Block Groups
metagroup0 metagroup 1 metagroup 2
bg0 bg1 bg63・・・
Super
Block
Group
Descriptors
data block
bitmap
inode
Bitmaps
inode
table
data
blocks
Super
Block
Group
Descriptors
data block
bitmap
inode
Bitmaps
inode
table
data
blocks
data block
bitmap
inode
Bitmaps
inode
table
data blocks
Super
Block
Group
Descriptors
data block
bitmap
inode
Bitmaps
inode
table
data
blocks
・・・
bg0
bg1
bg2
bg63
Super
Block
32.
31
meta_bgのGDTのブロック数チェック
static unsigned longext4_bg_num_gdb_meta(struct super_block *sb, ext4_group_t group)
{
unsigned long metagroup = group / EXT4_DESC_PER_BLOCK(sb);
ext4_group_t first = metagroup * EXT4_DESC_PER_BLOCK(sb);
ext4_group_t last = first + EXT4_DESC_PER_BLOCK(sb) - 1;
if (group == first || group == first + 1 || group == last)
return 1; /* metagroupの0番目, 1番目, 最後だけGDが1ブロック存在 */
return 0;
}


![• mkfsコマンド用オプション管理ファイル
13
/etc/mke2fs.conf
[defaults]
base_features = sparse_super,filetype,resize_inode,dir_index,ext_attr
default_mntopts = acl,user_xattr
enable_periodic_fsck = 0
blocksize = 4096
inode_size = 256
inode_ratio = 16384
[fs_types]
ext3 = {
features = has_journal
}
ext4 = {
features = has_journal,extent,huge_file,flex_bg,uninit_bg,dir_nlink,extra_isize
auto_64-bit_support = 1
inode_size = 256
}](https://image.slidesharecdn.com/fs1yunomaev1-140712094207-phpapp02/75/Ext4-filesystem-1-14-2048.jpg)


![16
ext4_super_block構造体
/*50*/ __le16 s_def_resuid; /* Default uid for reserved blocks */
__le16 s_def_resgid; /* Default gid for reserved blocks */
__le32 s_first_ino; /* First non-reserved inode */
__le16 s_inode_size; /* size of inode structure */
__le16 s_block_group_nr; /* block group # of this superblock */
__le32 s_feature_compat; /* compatible feature set */
/*60*/ __le32 s_feature_incompat; /* incompatible feature set */
__le32 s_feature_ro_compat; /* readonly-compatible feature set */
/*68*/ __u8 s_uuid[16]; /* 128-bit uuid for volume */
/*78*/ char s_volume_name[16]; /* volume name */
/*88*/ char s_last_mounted[64]; /* directory where last mounted */
/*C8*/ __le32 s_algorithm_usage_bitmap; /* For compression */
__u8 s_prealloc_blocks; /* Nr of blocks to try to preallocate*/
__u8 s_prealloc_dir_blocks; /* Nr to preallocate for dirs */
__le16 s_reserved_gdt_blocks; /* Per group desc for online growth */
/*D0*/ __u8 s_journal_uuid[16]; /* uuid of journal superblock */
/*E0*/ __le32 s_journal_inum; /* inode number of journal file */
__le32 s_journal_dev; /* device number of journal file */
__le32 s_last_orphan; /* start of list of inodes to delete */
__le32 s_hash_seed[4]; /* HTREE hash seed */
__u8 s_def_hash_version; /* Default hash version to use */
__u8 s_jnl_backup_type;
__le16 s_desc_size; /* size of group descriptor */](https://image.slidesharecdn.com/fs1yunomaev1-140712094207-phpapp02/75/Ext4-filesystem-1-17-2048.jpg)
![17
ext4_super_block構造体
/*100*/ __le32 s_default_mount_opts;
__le32 s_first_meta_bg; /* First metablock block group */
__le32 s_mkfs_time; /* When the filesystem was created */
__le32 s_jnl_blocks[17]; /* Backup of the journal inode */
/* 64bit support valid if EXT4_FEATURE_COMPAT_64BIT */
/*150*/ __le32 s_blocks_count_hi; /* Blocks count */
__le32 s_r_blocks_count_hi; /* Reserved blocks count */
__le32 s_free_blocks_count_hi; /* Free blocks count */
__le16 s_min_extra_isize; /* All inodes have at least # bytes */
__le16 s_want_extra_isize; /* New inodes should reserve # bytes */
__le32 s_flags; /* Miscellaneous flags */
__le16 s_raid_stride; /* RAID stride */
__le16 s_mmp_update_interval; /* # seconds to wait in MMP checking */
__le64 s_mmp_block; /* Block for multi-mount protection */
__le32 s_raid_stripe_width; /* blocks on all data disks (N*stride)*/
__u8 s_log_groups_per_flex; /* FLEX_BG group size */
__u8 s_checksum_type; /* metadata checksum algorithm used */
__le16 s_reserved_pad;
__le64 s_kbytes_written; /* nr of lifetime kilobytes written */
__le32 s_snapshot_inum; /* Inode number of active snapshot */
__le32 s_snapshot_id; /* sequential ID of active snapshot */
__le64 s_snapshot_r_blocks_count; /* reserved blocks for active
snapshot's future use */](https://image.slidesharecdn.com/fs1yunomaev1-140712094207-phpapp02/75/Ext4-filesystem-1-18-2048.jpg)
![18
ext4_super_block構造体
__le32 s_snapshot_list; /* inode number of the head of the
on-disk snapshot list */
#define EXT4_S_ERR_START offsetof(struct ext4_super_block, s_error_count)
__le32 s_error_count; /* number of fs errors */
__le32 s_first_error_time; /* first time an error happened */
__le32 s_first_error_ino; /* inode involved in first error */
__le64 s_first_error_block; /* block involved of first error */
__u8 s_first_error_func[32]; /* function where the error happened */
__le32 s_first_error_line; /* line number where error happened */
__le32 s_last_error_time; /* most recent time of an error */
__le32 s_last_error_ino; /* inode involved in last error */
__le32 s_last_error_line; /* line number where error happened */
__le64 s_last_error_block; /* block involved of last error */
__u8 s_last_error_func[32]; /* function where the error happened */
#define EXT4_S_ERR_END offsetof(struct ext4_super_block, s_mount_opts)
__u8 s_mount_opts[64];
__le32 s_usr_quota_inum; /* inode for tracking user quota */
__le32 s_grp_quota_inum; /* inode for tracking group quota */
__le32 s_overhead_clusters; /* overhead blocks/clusters in fs */
__le32 s_backup_bgs[2]; /* groups with sparse_super2 SBs */
__le32 s_reserved[106]; /* Padding to the end of the block */
__le32 s_checksum; /* crc32c(superblock) */
};](https://image.slidesharecdn.com/fs1yunomaev1-140712094207-phpapp02/75/Ext4-filesystem-1-19-2048.jpg)
![19
ext4_super_block構造体
__le32 s_snapshot_list; /* inode number of the head of the
on-disk snapshot list */
#define EXT4_S_ERR_START offsetof(struct ext4_super_block, s_error_count)
__le32 s_error_count; /* number of fs errors */
__le32 s_first_error_time; /* first time an error happened */
__le32 s_first_error_ino; /* inode involved in first error */
__le64 s_first_error_block; /* block involved of first error */
__u8 s_first_error_func[32]; /* function where the error happened */
__le32 s_first_error_line; /* line number where error happened */
__le32 s_last_error_time; /* most recent time of an error */
__le32 s_last_error_ino; /* inode involved in last error */
__le32 s_last_error_line; /* line number where error happened */
__le64 s_last_error_block; /* block involved of last error */
__u8 s_last_error_func[32]; /* function where the error happened */
#define EXT4_S_ERR_END offsetof(struct ext4_super_block, s_mount_opts)
__u8 s_mount_opts[64];
__le32 s_usr_quota_inum; /* inode for tracking user quota */
__le32 s_grp_quota_inum; /* inode for tracking group quota */
__le32 s_overhead_clusters; /* overhead blocks/clusters in fs */
__le32 s_backup_bgs[2]; /* groups with sparse_super2 SBs */
__le32 s_reserved[106]; /* Padding to the end of the block */
__le32 s_checksum; /* crc32c(superblock) */
};](https://image.slidesharecdn.com/fs1yunomaev1-140712094207-phpapp02/75/Ext4-filesystem-1-20-2048.jpg)
![20
ext4_inode構造体
struct ext4_inode {
__le16 i_mode; /* File mode */
__le16 i_uid; /* Low 16 bits of Owner Uid */
__le32 i_size_lo; /* Size in bytes */
__le32 i_atime; /* Access time */
__le32 i_ctime; /* Inode Change time */
__le32 i_mtime; /* Modification time */
__le32 i_dtime; /* Deletion Time */
__le16 i_gid; /* Low 16 bits of Group Id */
__le16 i_links_count; /* Links count */
__le32 i_blocks_lo; /* Blocks count */
__le32 i_flags; /* File flags */
union {
struct {
__le32 l_i_version;
} linux1;
…
} osd1; /* OS dependent 1 */
__le32 i_block[EXT4_N_BLOCKS];/* Pointers to blocks */
__le32 i_generation; /* File version (for NFS) */
__le32 i_file_acl_lo; /* File ACL */
__le32 i_size_high;
__le32 i_obso_faddr; /* Obsoleted fragment address */](https://image.slidesharecdn.com/fs1yunomaev1-140712094207-phpapp02/75/Ext4-filesystem-1-21-2048.jpg)
![21
ext4_inode構造体
union {
struct {
__le16 l_i_blocks_high; /* were l_i_reserved1 */
__le16 l_i_file_acl_high;
__le16 l_i_uid_high; /* these 2 fields */
__le16 l_i_gid_high; /* were reserved2[0] */
__le16 l_i_checksum_lo;/* crc32c(uuid+inum+inode) LE */
__le16 l_i_reserved;
} linux2;
…
} osd2; /* OS dependent 2 */
__le16 i_extra_isize;
__le16 i_checksum_hi; /* crc32c(uuid+inum+inode) BE */
__le32 i_ctime_extra; /* extra Change time (nsec << 2 | epoch) */
__le32 i_mtime_extra; /* extra Modification time(nsec << 2 | epoch) */
__le32 i_atime_extra; /* extra Access time (nsec << 2 | epoch) */
__le32 i_crtime; /* File Creation time */
__le32 i_crtime_extra; /* extra FileCreationtime (nsec << 2 | epoch) */
__le32 i_version_hi; /* high 32 bits for 64-bit version */
};
128byte超](https://image.slidesharecdn.com/fs1yunomaev1-140712094207-phpapp02/75/Ext4-filesystem-1-22-2048.jpg)


![Sparse super block / Sparse super 2
24
• sparse super block : super blockとGDTのバックアップを
削減する仕組み
– ディスク使用率向上、連続ブロックの割り当てのための設定
– block group 1/3/5/7/3^2/5^2/7^2/…/7^nにバックアップ
– ext2よりサポート
– mkfsのオプション: sparse_super
– フラグ: EXT4_FEATURE_RO_COMPAT_SPARSE_SUPER
• sparse super2: バックアップblock groupを1番目と最後
に限定
– ext4_super_block構造体のs_backup_bgs[2]にそれぞれグループを格納
• s_backup_bgs[0]: blockgroup 1
• s_backup_bgs[1]: blockgroupの最後
– mkfsのオプション:sparse_super2
– ext4よりサポート
– フラグ: EXT4_FEATURE_COMPAT_SPARSE_SUPER2
現状のmkfsの実装より](https://image.slidesharecdn.com/fs1yunomaev1-140712094207-phpapp02/75/Ext4-filesystem-1-25-2048.jpg)


![27
super blockの存在確認
int ext4_bg_has_super(struct super_block *sb, ext4_group_t group)
{
struct ext4_super_block *es = EXT4_SB(sb)->s_es;
if (group == 0) /* group 0には必ずsuper blockがある */
return 1;
if (EXT4_HAS_COMPAT_FEATURE(sb, EXT4_FEATURE_COMPAT_SPARSE_SUPER2)) {
if (group == le32_to_cpu(es->s_backup_bgs[0]) || /* group1 */
group == le32_to_cpu(es->s_backup_bgs[1])) /* group n(最後) */
return 1;
return 0;
}
if ((group <= 1) || !EXT4_HAS_RO_COMPAT_FEATURE(sb,
EXT4_FEATURE_RO_COMPAT_SPARSE_SUPER))
return 1; /* group1以下かSPARSE_SUPERでないなら必ずsuper blockがある */
if (!(group & 1)) /* 偶数だったら必ず無い */
return 0;
if (test_root(group, 3) || (test_root(group, 5)) ||
test_root(group, 7)) /* 3, 5, 7のn乗グループであればある */
return 1;
return 0;
}](https://image.slidesharecdn.com/fs1yunomaev1-140712094207-phpapp02/75/Ext4-filesystem-1-28-2048.jpg)


![37
従来の論理ブロックの管理
ext3_inode
__le32
i_data[15]
0
1
2
3
4
5
6
7
8
9
10
11
12
13
14
間接ブロック
・・・
2段間接ブロック
・・・
1036
1037
1038
間接ブロック
・・・
3段間接ブロック
論理ブロック
物理ブロック
3
715
12 754
874 8363
1035
4096/4=1024個
715
874
4byte](https://image.slidesharecdn.com/fs1yunomaev1-140712094207-phpapp02/75/Ext4-filesystem-1-38-2048.jpg)
![38
Extentの論理ブロックの管理
__le32
i_data[15]
ext4_extent_header
ext4_extent_idx
ext4_inode
12byte
ext4_extent_header
ext4_extent
ext4_extent_idx
ext4_extent_idx
ext4_extent_idx
eh_depth=n(tree)
…
eh_depth=0(leaf)
ext4_extent
ext4_extent
ext4_extent
・各tree/leafには同一の構造体を格納。
・ツリーの深さは1ファイル内で一定
物理ブロックの位置+
使用ブロック数
・・・](https://image.slidesharecdn.com/fs1yunomaev1-140712094207-phpapp02/75/Ext4-filesystem-1-39-2048.jpg)
![39
Extentの論理ブロックの管理
__le32
i_data[15]
ext4_extent_header
ext4_inode
eh_magic
eh_entries
eh_max
eh_depth
eh_generation
2byte
4byte
eh_magic: Magic#(0xf30a)
eh_entries: extentの数
eh_max: extentの最大数
eh_depth: 今いるtreeの深さ
eh_generation: treeの世代(現在未使用)
・i_data[]に書かれているeh_entriesが5以上となるとき、ext4_extent_idxとなる
・ブロックにおけるeh_maxは
(4096 – 12(header)) / 12 = 340 (4byte余り => checksum領域として使用)
・eh_depth=0のとき、ext4_extentを使用し、"leaf"となる
12byte](https://image.slidesharecdn.com/fs1yunomaev1-140712094207-phpapp02/75/Ext4-filesystem-1-40-2048.jpg)
![40
Extentの論理ブロックの管理
__le32
i_data[15]
ext4_extent
ext4_inode
ee_len
ee_block
2byte
4byte
ee_block: 最初の論理ブロック
ee_len: 使用ブロック数(下位15bit)
ee_start_hi: 物理ブロックの上16bit
ee_start_low: 物理ブロックの下32bit
・ee_blockで32bit使用: 2^32 * 4096(byte/block) = 16TBが1ファイルの上限
・ee_lenの下位15bit使用: 2^15 * 4096(byte/block) = 128MBが1extentの上限
・e_lenのMSB: unwrittenフラグ(preallocationのときに使用)
・ee_start_*で48bit使用 : 2^48*4096(byte/block) = 1EBがファイルシステムの上限
12byte
ee_start_hi
ee_start_low](https://image.slidesharecdn.com/fs1yunomaev1-140712094207-phpapp02/75/Ext4-filesystem-1-41-2048.jpg)
![41
Extentの論理ブロックの管理
__le32
i_data[15]
ext4_extent_idx
ext4_inode
ei_leaf_hi
ei_block
2byte
4byte
ei_block: カバーしている論理ブロック
ei_leaf_lo: 次の深さlevelのextentを格納して
いる物理ブロックの下32bit
ei_leaf_hi:次の深さlevelのextentを格納して
いる物理ブロックの上16bit
12byte
ei_leaf_lo
ei_unused](https://image.slidesharecdn.com/fs1yunomaev1-140712094207-phpapp02/75/Ext4-filesystem-1-42-2048.jpg)
![42
Extentの探し方
struct ext4_ext_path * ext4_ext_find_extent()
{
…
eh = ext_inode_hdr(inode); /* 最上位のtreeのextent_headerを取得 */
…
while (i) { /* leafに到達するまでループ */
…
/* バイナリサーチでextent_idxを探す */
ext4_ext_binsearch_idx(inode, path + ppos, block);
…
/* extent_idxの参照先のブロックを読み出す(1階層下へ) */
bh = read_extent_tree_block(inode, path[ppos].p_block, --i, flags); if (IS_ERR(bh));
…
/* 1階層下のextent_headerに付け替える */
eh = ext_block_hdr(bh);
…
}
…
/* バイナリサーチで目的のextentを探す */
ext4_ext_binsearch(inode, path + ppos, block);
…
}](https://image.slidesharecdn.com/fs1yunomaev1-140712094207-phpapp02/75/Ext4-filesystem-1-43-2048.jpg)


