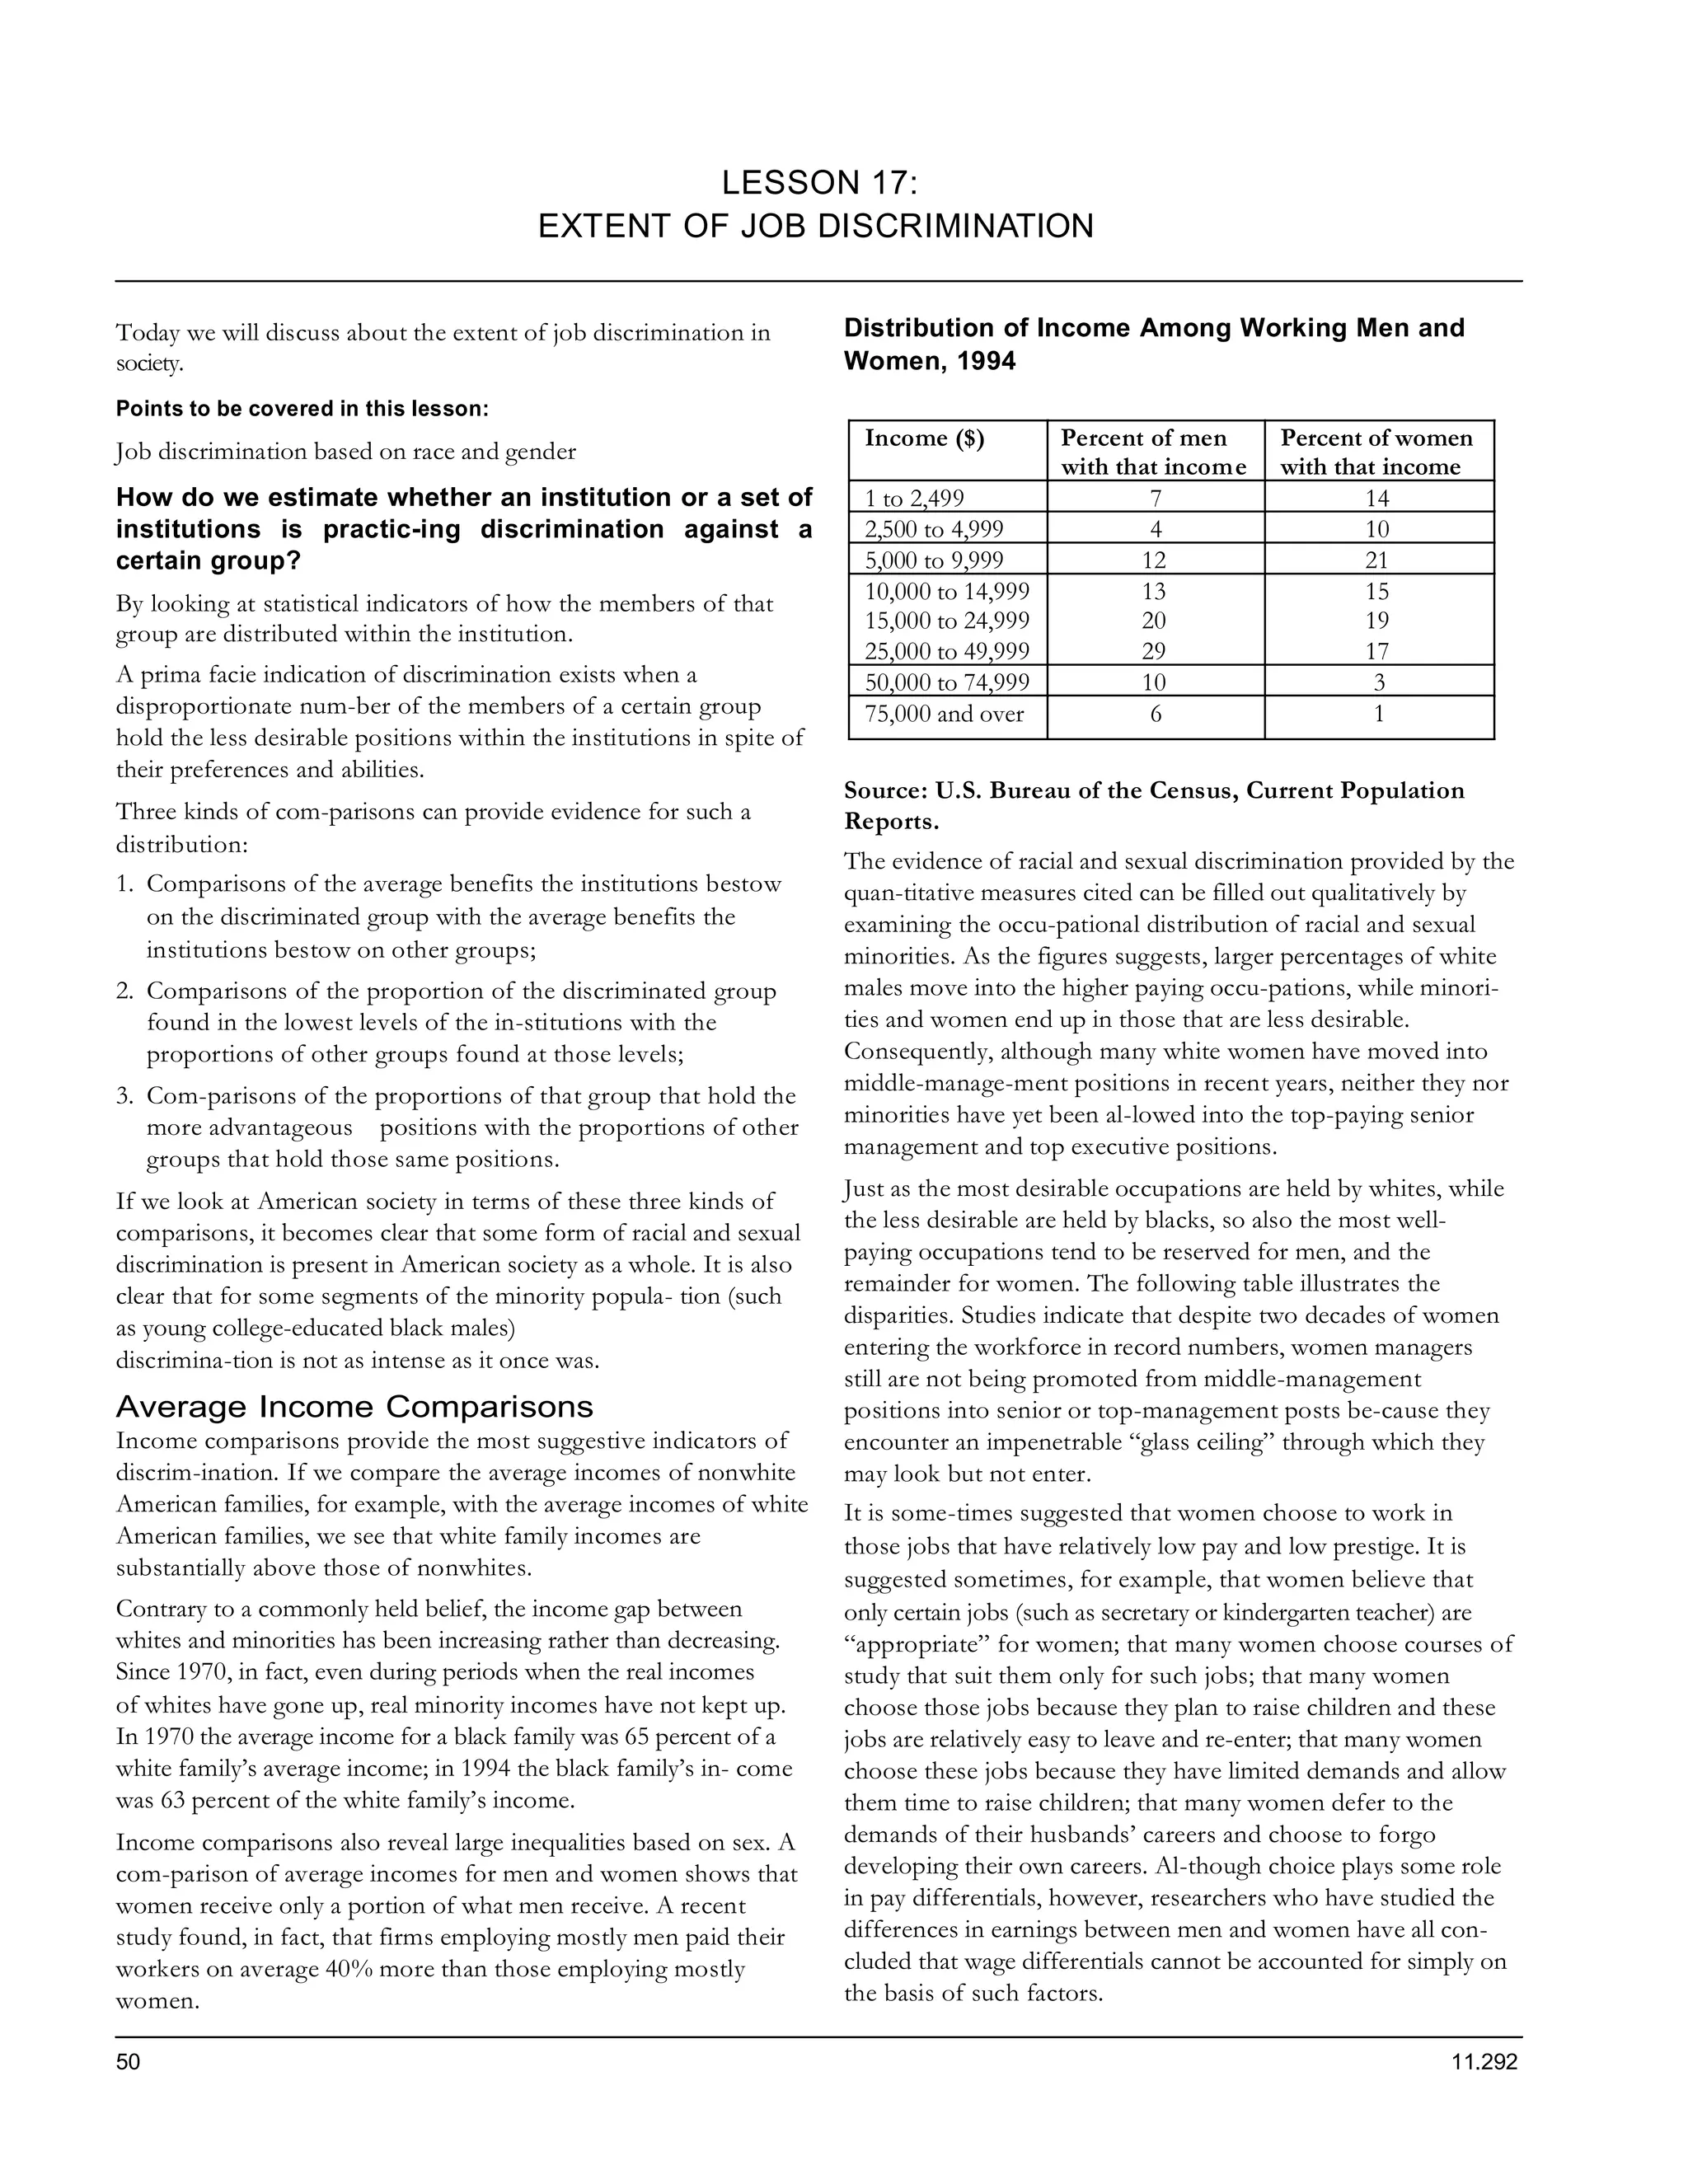
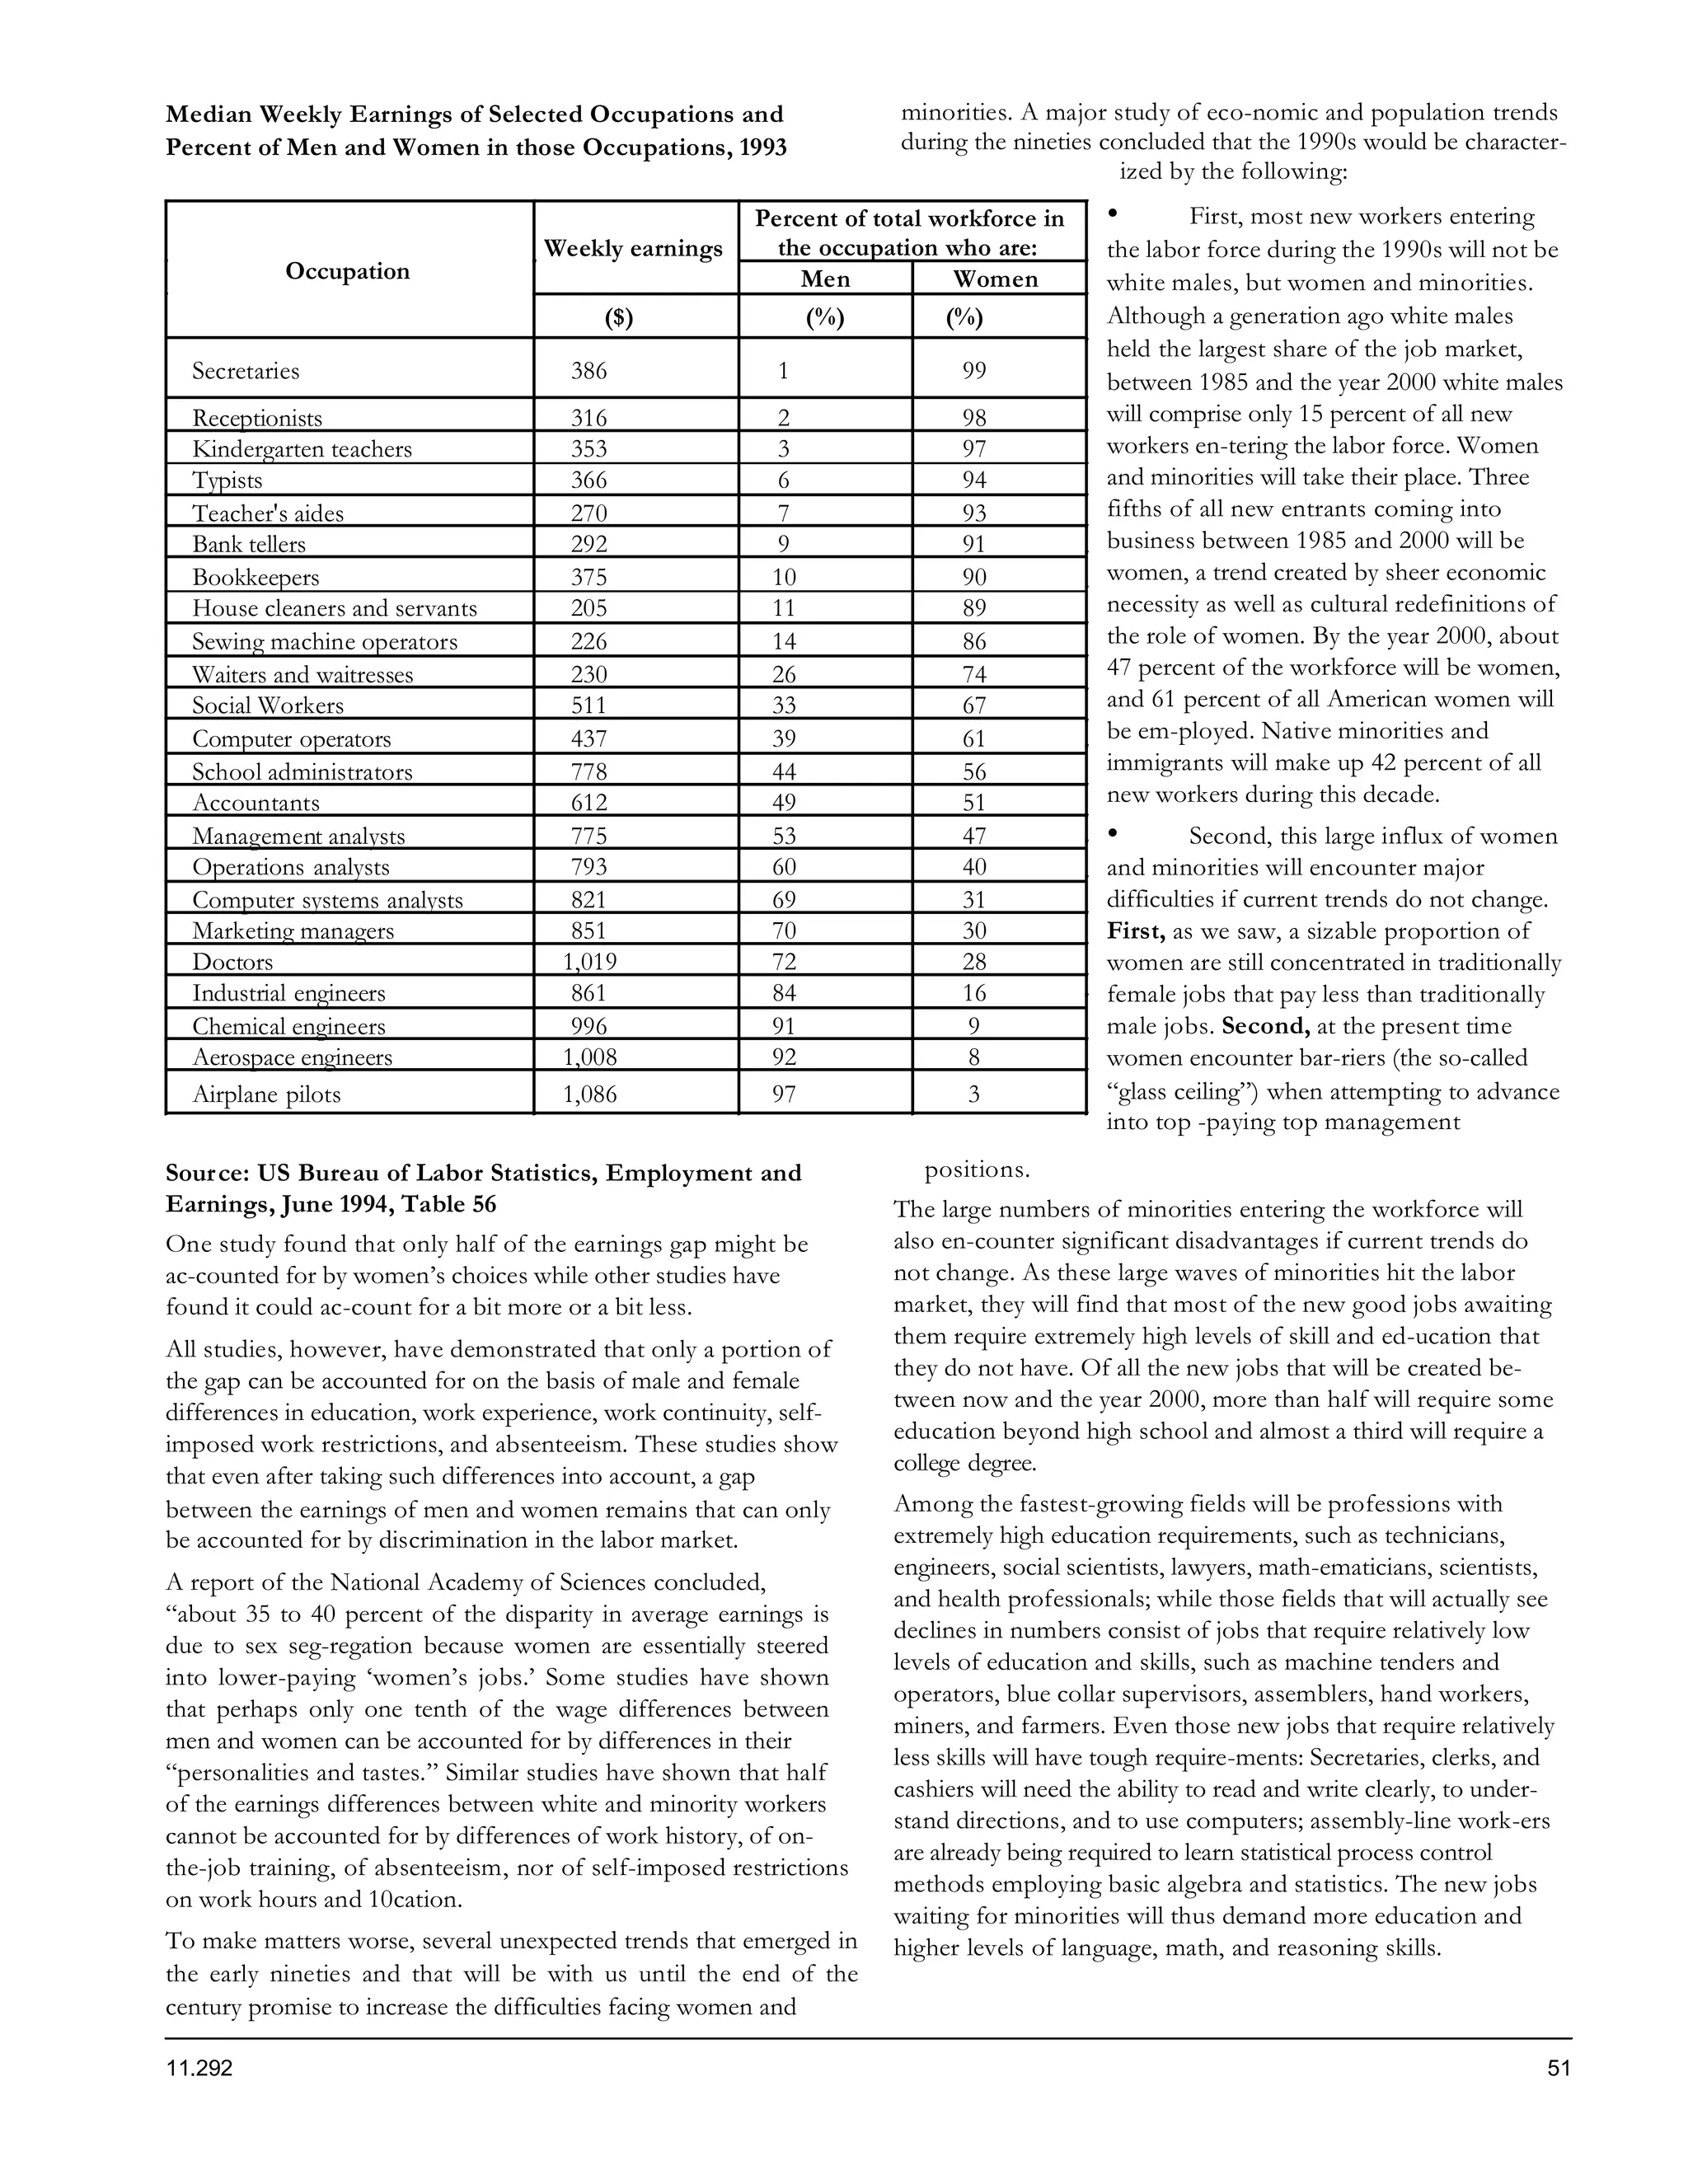
Job discrimination can be estimated by looking at statistical indicators showing how underrepresented groups are distributed within institutions. Three types of comparisons provide evidence: 1) Comparing average benefits between groups, 2) Comparing low-level representation between groups, and 3) Comparing high-level representation between groups. Studies of American society show racial and gender discrimination in average incomes, occupational distributions, and glass ceilings. While some choice factors contribute to differences, studies find only a portion of earnings gaps can be explained by choice, and discrimination in the labor market must also be a factor. Upcoming demographic changes may exacerbate issues if current trends are not addressed.
CATCHING UPt The Gender Gap in Wages, circa 2000 The.docxtroutmanboris
CATCHING UPt
The Gender Gap in Wages, circa 2000
The transition of women into the U.S. labor
market was surely one of the most profound
economic and social changes of the 20th cen-
tury.' In 1900 about 20 percent of women were in
thi labor force. This percentage rose to about 34
in 1950 and reached 61 percent in 2000; not far
below the 75-percent participation rate of men.
A key element in this change was the dramatic
rise in market work among mamed women with
children under the age of 18, whose labor-force
participation increased from a rate of 18 percent
in 1950 to 7 1 percent in 2000.
However, for much of the last 50 years the rise
in women's labor-force activity and its growing
convergence with that of men, did not appear to
be matched by a narrowing of the gender gap in
pay. Between 1955 and 1980, the most com-
monly cited measure of that gap, the female-
to-male ratio of median annual earnings of
full-time year-round workers, hovered around
60 percent. But using the same measure, the
ratio began to rise after 1980, reaching 69 per-
cent in 1989 and 74 percent in the mid 1990's,
after which it leveled off. Based on a more
appropriate measure, average hourly wage rates
(available since 1979), the gender gap is
smaller, but the pattern of change is similar, and
the ratio rises from 66 Dercent in 1979 to 80
percent in 1993 and then' stabilizes (Fig. 1).
Through the years the gender gap in wages
frequently has been a source of public concern
and a puzzle to researchers. In this paper I
tDiscussants: Donald Deere, Texas A&M University;
Haniett Duleep, Urban Institute; Jeffrey Grogger, Univer-
sity of California-Los Angeles.
* Department of Economics and Center for the Study of
Business and Government, Baruch College, City University
of New York, 17 Lexington Avenue, New York, NY 10010.
I thank Mei Liao and Wenhui Li for excellent research
assistance, as well as Alex Cavallo of Lexecon, Inc.
See Jacob Mincer's (1962) pioneering work on the
determinants of women's labor force participation.
examine evidence from the Current Population
Survey (CPS) and the National Longitudinal
Survey of Youth (NLSY79) on recent trends
and current sources of the gender gap.
I. Unique Factors Underlying Gender
Differences in Skills
In comparing the earnings of different demo-
graphic groups it is usually important to exam-
ine the effect of productivity differences
between the groups that might account for any
earnings differential. In the case of differences
in earnings between racial and ethnic groups of
the same sex, productivity differences most of-
ten stem from differences in the quantity and
quality of education and other human capital
acquired at home as well as in school. Differ-
ences in productivity between men and women,
however, are not likely to be due to differences
in educational background. Sisters and brothers
are exposed to the same parental background
and attend schoo.
Creating Jobs In Ghana UKFIET OXCON 2009 (education, skills, jobs, developmen...RECOUP
Poverty has halved in Ghana over the period from 1991 to 2005. We use the household surveys to investigate possible mechanisms which led to this outcome. In particular how was it linked to the creation of jobs and skills? While in the 1990s the pattern of a growth in urban sector self-employment is clear this process was reversed in the period to 2005. By 2005/06 it had fallen to 18.6 per cent of the working age population, substantially lower than the level of the early 1990s. The fall in urban self-employment was matched by a rise in wage employment in small firms which doubled as a percentage of the workforce from 3.4 to 6.7 per cent. Over the whole period from 1991/92 to 2005/06 the most striking change in the labour force was the rise in employment in small firms, from 225,000 to 886,000. Quite contrary to the perception that wage jobs are not being created they have been expanding far faster than the growth of the labour force. We also find that over the period from 1998/99 to 2005/06 real incomes rose by in excess of 50 per cent and that this rise was fastest in the lowest paying occupation. There was some shift from lower to higher paying occupations but it would appear that the income rises, which underlie the fall in poverty, were uniformly high across all sectors and particularly benefited the unskilled. We compare how skills acquired in technical education and through apprenticeship training have impacted on the types of jobs and their earnings and thus on their role in reducing poverty.
Mismatch: Adapting Old-World Career Models to the New-World WorkforceCognizant
To take advantage of all that an inclusive workforce has to offer, organizations need to shift away from a career model that never imagined the working population becoming so diverse.
Understanding Gender Based Wage Gap .docxmarilucorr
Understanding Gender Based Wage Gap
Smaher ali Alharbi
Virginia State University
Understanding Gender Based Wage Gap
If we look across the industries, wage rates differ drastically, and these differences are attributed to how much people value certain occupation or the goods and services produced within certain industry. While it’s common for sportsmen to have millions of dollars of revenue annually, common labor often has to work for minimum wage. To explain these differences one can adopt social, cultural or economic framework and conclude that certain jobs require minimum skill and education, while others require more dedication and investment. Additionally, we can say that some give consumers higher value, and thus people are ready to pay more to get access to those goods and services. While some of the differences in wage rates can seem quite unfair, the fact that wages for basketball player and a manufacturer are different, can be explained by common sense, however, when it comes to more complicated issues, like gender-based or race-based pay gaps, explaining those becomes much harder. This becomes even more confusing when we control for education, age, experience, and industry and observe that a man and a woman with similar background, working on the same position and doing same job have different wage rates.
The goal of this research paper is to evaluate gender gap, understand some of the variables which can explain it and suggest policies that will decrease gender-based wage gap. To accomplish this, I will rely on existing literature that addresses the topic and make conclusions based on existing scientific knowledge about this topic. While this paper won’t conduct regression analysis, it will discuss a potential model for building one; based on this model, one could assess how various independent variables affect gender based wage differences and what needs to be done to change that.
“While the gender gap in the performance of housework has narrowed in many countries for which data are available, it remains universal and large.” (Sayer, 2010). This existing gap makes the problem extremely important. Another reason why this topic is important is that by classical theory about labor market, we expect that wage rate within the industry, for the same position should be the same, because market regulated the wage and workers and employers simply have to accept it; however, in real like employers have higher negotiating power, and they can pretty much set wages as they prefer. What’s interesting is that, for some reason sometimes women are offered a different rate than men. This happens even then we control for various variables. So, what causes women to get lower wages? Are they worse employees? Are they less skilled? Or is it employer who simply likes to discriminate against women?
Literature Review
Considering that our primary emphasis is on existing wage gap in Unites States, looki ...
The multi-generational workforce - the new fault line? Hayat Hamici
Despite what is widely believed to be the case amongst HR professionals, there aren’t enough significant differences between the generations to necessarily require differentiated HR policies. These findings are consistent with recent research. There are in many cases as many similarities as there are differences. Great Place to Work research found more differences between age groups than generations. We advise HR to focus on the benefits of the increasing diversity in today's workplaces. Diversity brings competitive advantage and each generation can provide different experiences, knowledge and viewpoints to organisations. It’s imperative for HR professionals and leaders to overcome existing stereotypes while promoting synergies, mutual respect and consideration.
June 3, 2024 Anti-Semitism Letter Sent to MIT President Kornbluth and MIT Cor...Levi Shapiro
Letter from the Congress of the United States regarding Anti-Semitism sent June 3rd to MIT President Sally Kornbluth, MIT Corp Chair, Mark Gorenberg
Dear Dr. Kornbluth and Mr. Gorenberg,
The US House of Representatives is deeply concerned by ongoing and pervasive acts of antisemitic
harassment and intimidation at the Massachusetts Institute of Technology (MIT). Failing to act decisively to ensure a safe learning environment for all students would be a grave dereliction of your responsibilities as President of MIT and Chair of the MIT Corporation.
This Congress will not stand idly by and allow an environment hostile to Jewish students to persist. The House believes that your institution is in violation of Title VI of the Civil Rights Act, and the inability or
unwillingness to rectify this violation through action requires accountability.
Postsecondary education is a unique opportunity for students to learn and have their ideas and beliefs challenged. However, universities receiving hundreds of millions of federal funds annually have denied
students that opportunity and have been hijacked to become venues for the promotion of terrorism, antisemitic harassment and intimidation, unlawful encampments, and in some cases, assaults and riots.
The House of Representatives will not countenance the use of federal funds to indoctrinate students into hateful, antisemitic, anti-American supporters of terrorism. Investigations into campus antisemitism by the Committee on Education and the Workforce and the Committee on Ways and Means have been expanded into a Congress-wide probe across all relevant jurisdictions to address this national crisis. The undersigned Committees will conduct oversight into the use of federal funds at MIT and its learning environment under authorities granted to each Committee.
• The Committee on Education and the Workforce has been investigating your institution since December 7, 2023. The Committee has broad jurisdiction over postsecondary education, including its compliance with Title VI of the Civil Rights Act, campus safety concerns over disruptions to the learning environment, and the awarding of federal student aid under the Higher Education Act.
• The Committee on Oversight and Accountability is investigating the sources of funding and other support flowing to groups espousing pro-Hamas propaganda and engaged in antisemitic harassment and intimidation of students. The Committee on Oversight and Accountability is the principal oversight committee of the US House of Representatives and has broad authority to investigate “any matter” at “any time” under House Rule X.
• The Committee on Ways and Means has been investigating several universities since November 15, 2023, when the Committee held a hearing entitled From Ivory Towers to Dark Corners: Investigating the Nexus Between Antisemitism, Tax-Exempt Universities, and Terror Financing. The Committee followed the hearing with letters to those institutions on January 10, 202
Introduction to AI for Nonprofits with Tapp NetworkTechSoup
Dive into the world of AI! Experts Jon Hill and Tareq Monaur will guide you through AI's role in enhancing nonprofit websites and basic marketing strategies, making it easy to understand and apply.
Unit 8 - Information and Communication Technology (Paper I).pdfThiyagu K
This slides describes the basic concepts of ICT, basics of Email, Emerging Technology and Digital Initiatives in Education. This presentations aligns with the UGC Paper I syllabus.
A workshop hosted by the South African Journal of Science aimed at postgraduate students and early career researchers with little or no experience in writing and publishing journal articles.
Model Attribute Check Company Auto PropertyCeline George
In Odoo, the multi-company feature allows you to manage multiple companies within a single Odoo database instance. Each company can have its own configurations while still sharing common resources such as products, customers, and suppliers.
Operation “Blue Star” is the only event in the history of Independent India where the state went into war with its own people. Even after about 40 years it is not clear if it was culmination of states anger over people of the region, a political game of power or start of dictatorial chapter in the democratic setup.
The people of Punjab felt alienated from main stream due to denial of their just demands during a long democratic struggle since independence. As it happen all over the word, it led to militant struggle with great loss of lives of military, police and civilian personnel. Killing of Indira Gandhi and massacre of innocent Sikhs in Delhi and other India cities was also associated with this movement.
Acetabularia Information For Class 9 .docxvaibhavrinwa19
Acetabularia acetabulum is a single-celled green alga that in its vegetative state is morphologically differentiated into a basal rhizoid and an axially elongated stalk, which bears whorls of branching hairs. The single diploid nucleus resides in the rhizoid.
Synthetic Fiber Construction in lab .pptxPavel ( NSTU)
Synthetic fiber production is a fascinating and complex field that blends chemistry, engineering, and environmental science. By understanding these aspects, students can gain a comprehensive view of synthetic fiber production, its impact on society and the environment, and the potential for future innovations. Synthetic fibers play a crucial role in modern society, impacting various aspects of daily life, industry, and the environment. ynthetic fibers are integral to modern life, offering a range of benefits from cost-effectiveness and versatility to innovative applications and performance characteristics. While they pose environmental challenges, ongoing research and development aim to create more sustainable and eco-friendly alternatives. Understanding the importance of synthetic fibers helps in appreciating their role in the economy, industry, and daily life, while also emphasizing the need for sustainable practices and innovation.
A Strategic Approach: GenAI in EducationPeter Windle
Artificial Intelligence (AI) technologies such as Generative AI, Image Generators and Large Language Models have had a dramatic impact on teaching, learning and assessment over the past 18 months. The most immediate threat AI posed was to Academic Integrity with Higher Education Institutes (HEIs) focusing their efforts on combating the use of GenAI in assessment. Guidelines were developed for staff and students, policies put in place too. Innovative educators have forged paths in the use of Generative AI for teaching, learning and assessments leading to pockets of transformation springing up across HEIs, often with little or no top-down guidance, support or direction.
This Gasta posits a strategic approach to integrating AI into HEIs to prepare staff, students and the curriculum for an evolving world and workplace. We will highlight the advantages of working with these technologies beyond the realm of teaching, learning and assessment by considering prompt engineering skills, industry impact, curriculum changes, and the need for staff upskilling. In contrast, not engaging strategically with Generative AI poses risks, including falling behind peers, missed opportunities and failing to ensure our graduates remain employable. The rapid evolution of AI technologies necessitates a proactive and strategic approach if we are to remain relevant.
1. LESSON 17:
EXTENT OF JOB DISCRIMINATION
Today we will discuss about the extent of job discrimination in Distribution of Income Among Working Men and
society. Women, 1994
Points to be covered in this lesson:
Income ($) Percent of men Percent of women
Job discrimination based on race and gender
with that income with that income
How do we estimate whether an institution or a set of 1 to 2,499 7 14
institutions is practic-ing discrimination against a 2,500 to 4,999 4 10
certain group? 5,000 to 9,999 12 21
By looking at statistical indicators of how the members of that 10,000 to 14,999 13 15
group are distributed within the institution. 15,000 to 24,999 20 19
25,000 to 49,999 29 17
A prima facie indication of discrimination exists when a 50,000 to 74,999 10 3
disproportionate num-ber of the members of a certain group 75,000 and over 6 1
hold the less desirable positions within the institutions in spite of
their preferences and abilities.
Source: U.S. Bureau of the Census, Current Population
Three kinds of com-parisons can provide evidence for such a Reports.
distribution:
The evidence of racial and sexual discrimination provided by the
1. Comparisons of the average benefits the institutions bestow quan-titative measures cited can be filled out qualitatively by
on the discriminated group with the average benefits the examining the occu-pational distribution of racial and sexual
institutions bestow on other groups; minorities. As the figures suggests, larger percentages of white
2. Comparisons of the proportion of the discriminated group males move into the higher paying occu-pations, while minori-
found in the lowest levels of the in-stitutions with the ties and women end up in those that are less desirable.
proportions of other groups found at those levels; Consequently, although many white women have moved into
3. Com-parisons of the proportions of that group that hold the middle-manage-ment positions in recent years, neither they nor
more advantageous positions with the proportions of other minorities have yet been al-lowed into the top-paying senior
groups that hold those same positions. management and top executive positions.
If we look at American society in terms of these three kinds of Just as the most desirable occupations are held by whites, while
comparisons, it becomes clear that some form of racial and sexual the less desirable are held by blacks, so also the most well-
discrimination is present in American society as a whole. It is also paying occupations tend to be reserved for men, and the
clear that for some segments of the minority popula- tion (such remainder for women. The following table illustrates the
as young college-educated black males) disparities. Studies indicate that despite two decades of women
entering the workforce in record numbers, women managers
discrimina-tion is not as intense as it once was.
still are not being promoted from middle-management
Average Income Comparisons positions into senior or top-management posts be-cause they
Income comparisons provide the most suggestive indicators of encounter an impenetrable “glass ceiling” through which they
discrim-ination. If we compare the average incomes of nonwhite may look but not enter.
American families, for example, with the average incomes of white It is some-times suggested that women choose to work in
American families, we see that white family incomes are those jobs that have relatively low pay and low prestige. It is
substantially above those of nonwhites. suggested sometimes, for example, that women believe that
Contrary to a commonly held belief, the income gap between only certain jobs (such as secretary or kindergarten teacher) are
whites and minorities has been increasing rather than decreasing. “appropriate” for women; that many women choose courses of
Since 1970, in fact, even during periods when the real incomes study that suit them only for such jobs; that many women
of whites have gone up, real minority incomes have not kept up. choose those jobs because they plan to raise children and these
In 1970 the average income for a black family was 65 percent of a jobs are relatively easy to leave and re-enter; that many women
white family’s average income; in 1994 the black family’s in- come choose these jobs because they have limited demands and allow
was 63 percent of the white family’s income. them time to raise children; that many women defer to the
Income comparisons also reveal large inequalities based on sex. A demands of their husbands’ careers and choose to forgo
com-parison of average incomes for men and women shows that developing their own careers. Al-though choice plays some role
women receive only a portion of what men receive. A recent in pay differentials, however, researchers who have studied the
study found, in fact, that firms employing mostly men paid their differences in earnings between men and women have all con-
workers on average 40% more than those employing mostly cluded that wage differentials cannot be accounted for simply on
women. the basis of such factors.
50 11.292
2. Median Weekly Earnings of Selected Occupations and minorities. A major study of eco-nomic and population trends
Percent of Men and Women in those Occupations, 1993 during the nineties concluded that the 1990s would be character-
ized by the following:
Percent of total workforce in • First, most new workers entering
Weekly earnings the occupation who are: the labor force during the 1990s will not be
Occupation Men Women white males, but women and minorities.
($) (%) (%) Although a generation ago white males
held the largest share of the job market,
Secretaries 386 1 99 between 1985 and the year 2000 white males
Receptionists 316 2 98 will comprise only 15 percent of all new
Kindergarten teachers 353 3 97 workers en-tering the labor force. Women
Typists 366 6 94 and minorities will take their place. Three
Teacher's aides 270 7 93 fifths of all new entrants coming into
Bank tellers 292 9 91 business between 1985 and 2000 will be
Bookkeepers 375 10 90 women, a trend created by sheer economic
House cleaners and servants 205 11 89 necessity as well as cultural redefinitions of
Sewing machine operators 226 14 86 the role of women. By the year 2000, about
Waiters and waitresses 230 26 74 47 percent of the workforce will be women,
Social Workers 511 33 67 and 61 percent of all American women will
Computer operators 437 39 61 be em-ployed. Native minorities and
School administrators 778 44 56 immigrants will make up 42 percent of all
Accountants 612 49 51 new workers during this decade.
Management analysts 775 53 47 • Second, this large influx of women
Operations analysts 793 60 40 and minorities will encounter major
Computer systems analysts 821 69 31 difficulties if current trends do not change.
Marketing managers 851 70 30 First, as we saw, a sizable proportion of
Doctors 1,019 72 28 women are still concentrated in traditionally
Industrial engineers 861 84 16 female jobs that pay less than traditionally
Chemical engineers 996 91 9 male jobs. Second, at the present time
Aerospace engineers 1,008 92 8 women encounter bar-riers (the so-called
Airplane pilots 1,086 97 3 “glass ceiling”) when attempting to advance
into top -paying top management
Sour ce: US Bureau of Labor Statistics, Employment and positions.
Earnings, June 1994, Table 56 The large numbers of minorities entering the workforce will
One study found that only half of the earnings gap might be also en-counter significant disadvantages if current trends do
ac-counted for by women’s choices while other studies have not change. As these large waves of minorities hit the labor
found it could ac-count for a bit more or a bit less. market, they will find that most of the new good jobs awaiting
them require extremely high levels of skill and ed-ucation that
All studies, however, have demonstrated that only a portion of
the gap can be accounted for on the basis of male and female they do not have. Of all the new jobs that will be created be-
tween now and the year 2000, more than half will require some
differences in education, work experience, work continuity, self-
education beyond high school and almost a third will require a
imposed work restrictions, and absenteeism. These studies show
college degree.
that even after taking such differences into account, a gap
between the earnings of men and women remains that can only Among the fastest-growing fields will be professions with
be accounted for by discrimination in the labor market. extremely high education requirements, such as technicians,
engineers, social scientists, lawyers, math-ematicians, scientists,
A report of the National Academy of Sciences concluded,
and health professionals; while those fields that will actually see
“about 35 to 40 percent of the disparity in average earnings is
declines in numbers consist of jobs that require relatively low
due to sex seg-regation because women are essentially steered
levels of education and skills, such as machine tenders and
into lower-paying ‘women’s jobs.’ Some studies have shown
operators, blue collar supervisors, assemblers, hand workers,
that perhaps only one tenth of the wage differences between
miners, and farmers. Even those new jobs that require relatively
men and women can be accounted for by differences in their
less skills will have tough require-ments: Secretaries, clerks, and
“personalities and tastes.” Similar studies have shown that half
cashiers will need the ability to read and write clearly, to under-
of the earnings differences between white and minority workers
stand directions, and to use computers; assembly-line work-ers
cannot be accounted for by differences of work history, of on-
are already being required to learn statistical process control
the-job training, of absenteeism, nor of self-imposed restrictions
methods employing basic algebra and statistics. The new jobs
on work hours and 10cation.
waiting for minorities will thus demand more education and
To make matters worse, several unexpected trends that emerged in higher levels of language, math, and reasoning skills.
the early nineties and that will be with us until the end of the
century promise to increase the difficulties facing women and
11.292 51
3. Unfortunately, although a significant proportion of whites are Overview
education-ally disadvantaged, minorities are currently the least • Studies indicate that even after taking into account male and
advantaged in terms of skill levels and education. Studies have female differences in education, work experience, work
shown that only about three fifths of whites, two fifths of continuity, self-imposed work restrictions, and absenteeism,
Hispanics, and one quarter of blacks could find informa-tion in a
a gap between the earnings of men and women remains, that
news article or almanac; only 25 percent of whites, 7 percent of
can only be accounted for by discrimination in the labor
Hispanics, and 3 percent of blacks could interpret a bus
market.
schedule; and only 44 percent of whites, 20 percent of Hispan-
ics, and 8 percent of blacks could fig-ure out the change they were Activity
owed from buying two items. Discuss the types of job discrimination. How can we determine
In recent years, moreover, an especially troublesome obstacle that job discrimination?
work-ing women face has been brought to light: sexual
harassment. Forty-two per-cent of all women working for the
federal government reported that they had experienced some
form of uninvited and unwanted sexual attention, ranging from
sexual remarks to attempted rape or assault. Women working as
execu-tives, prison guards, and even as rabbis, have reported
being sexually ha-rassed. Victims of such verbal or physical
forms of sexual harassment were most likely to be single or
divorced, between the ages of 20 and 44, have some college
education, and work in a predominantly male environ- ment or
for a male supervisor.
In 1992 about 5000 complaints of sexual harassment were filed
with the federal government’s Equal Employment Opportunity
Commission, and thou-sands of other complaints were lodged
with state civil rights commissions.
It is clear, then, that unless a number of current trends change,
women and minorities, who will comprise the bulk of new
workers between now and the end of the century, will find
themselves in highly disadvantaged positions as they enter the
workforce.
The various statistical comparisons that we have examined,
together with the extensive research showing that these
differences are not because of any simple way to differences in
preferences or abilities, indicate that American business institu-
tions incorporate some degree of systematic discrimination,
much of it, perhaps, an unconscious relic of the past. Whether
we compare av-erage incomes, proportional representation in the
highest economic positions, or proportional representation in
the lowest economic positions, it turns out that women and
minorities are not equal to white males, and the last twenty years
have seen but small narrowing of the racial and sexual gaps.
Moreover, a number of ominous trends indicate that unless we
embark on some major changes, the situation for minorities and
women will not improve.
Of course, finding that our economic institutions as a whole still
embody a great deal of discrimination does not show that any
particular business is dis-criminatory. To find out whether a
particular firm is discriminatory, we would have to make the same
sorts of comparisons among the various employment levels of
the firm that we made above among the various economic and
occu-pation all levels of American society as a whole. To facilitate
such comparisons within firms, employers today are required to
report to the government the numbers of minorities and women
their firm employs in each of nine cate- gories: officials and
managers, professionals, technicians, sales workers, office and
clerical workers, skilled craft workers, semiskilled operatives,
unskilled la-borers, and service workers.
52 11.292
4. For useful Documents like
this and
Lots of more
Educational and
Technological Stuff...
Visit...
www.thecodexpert.com