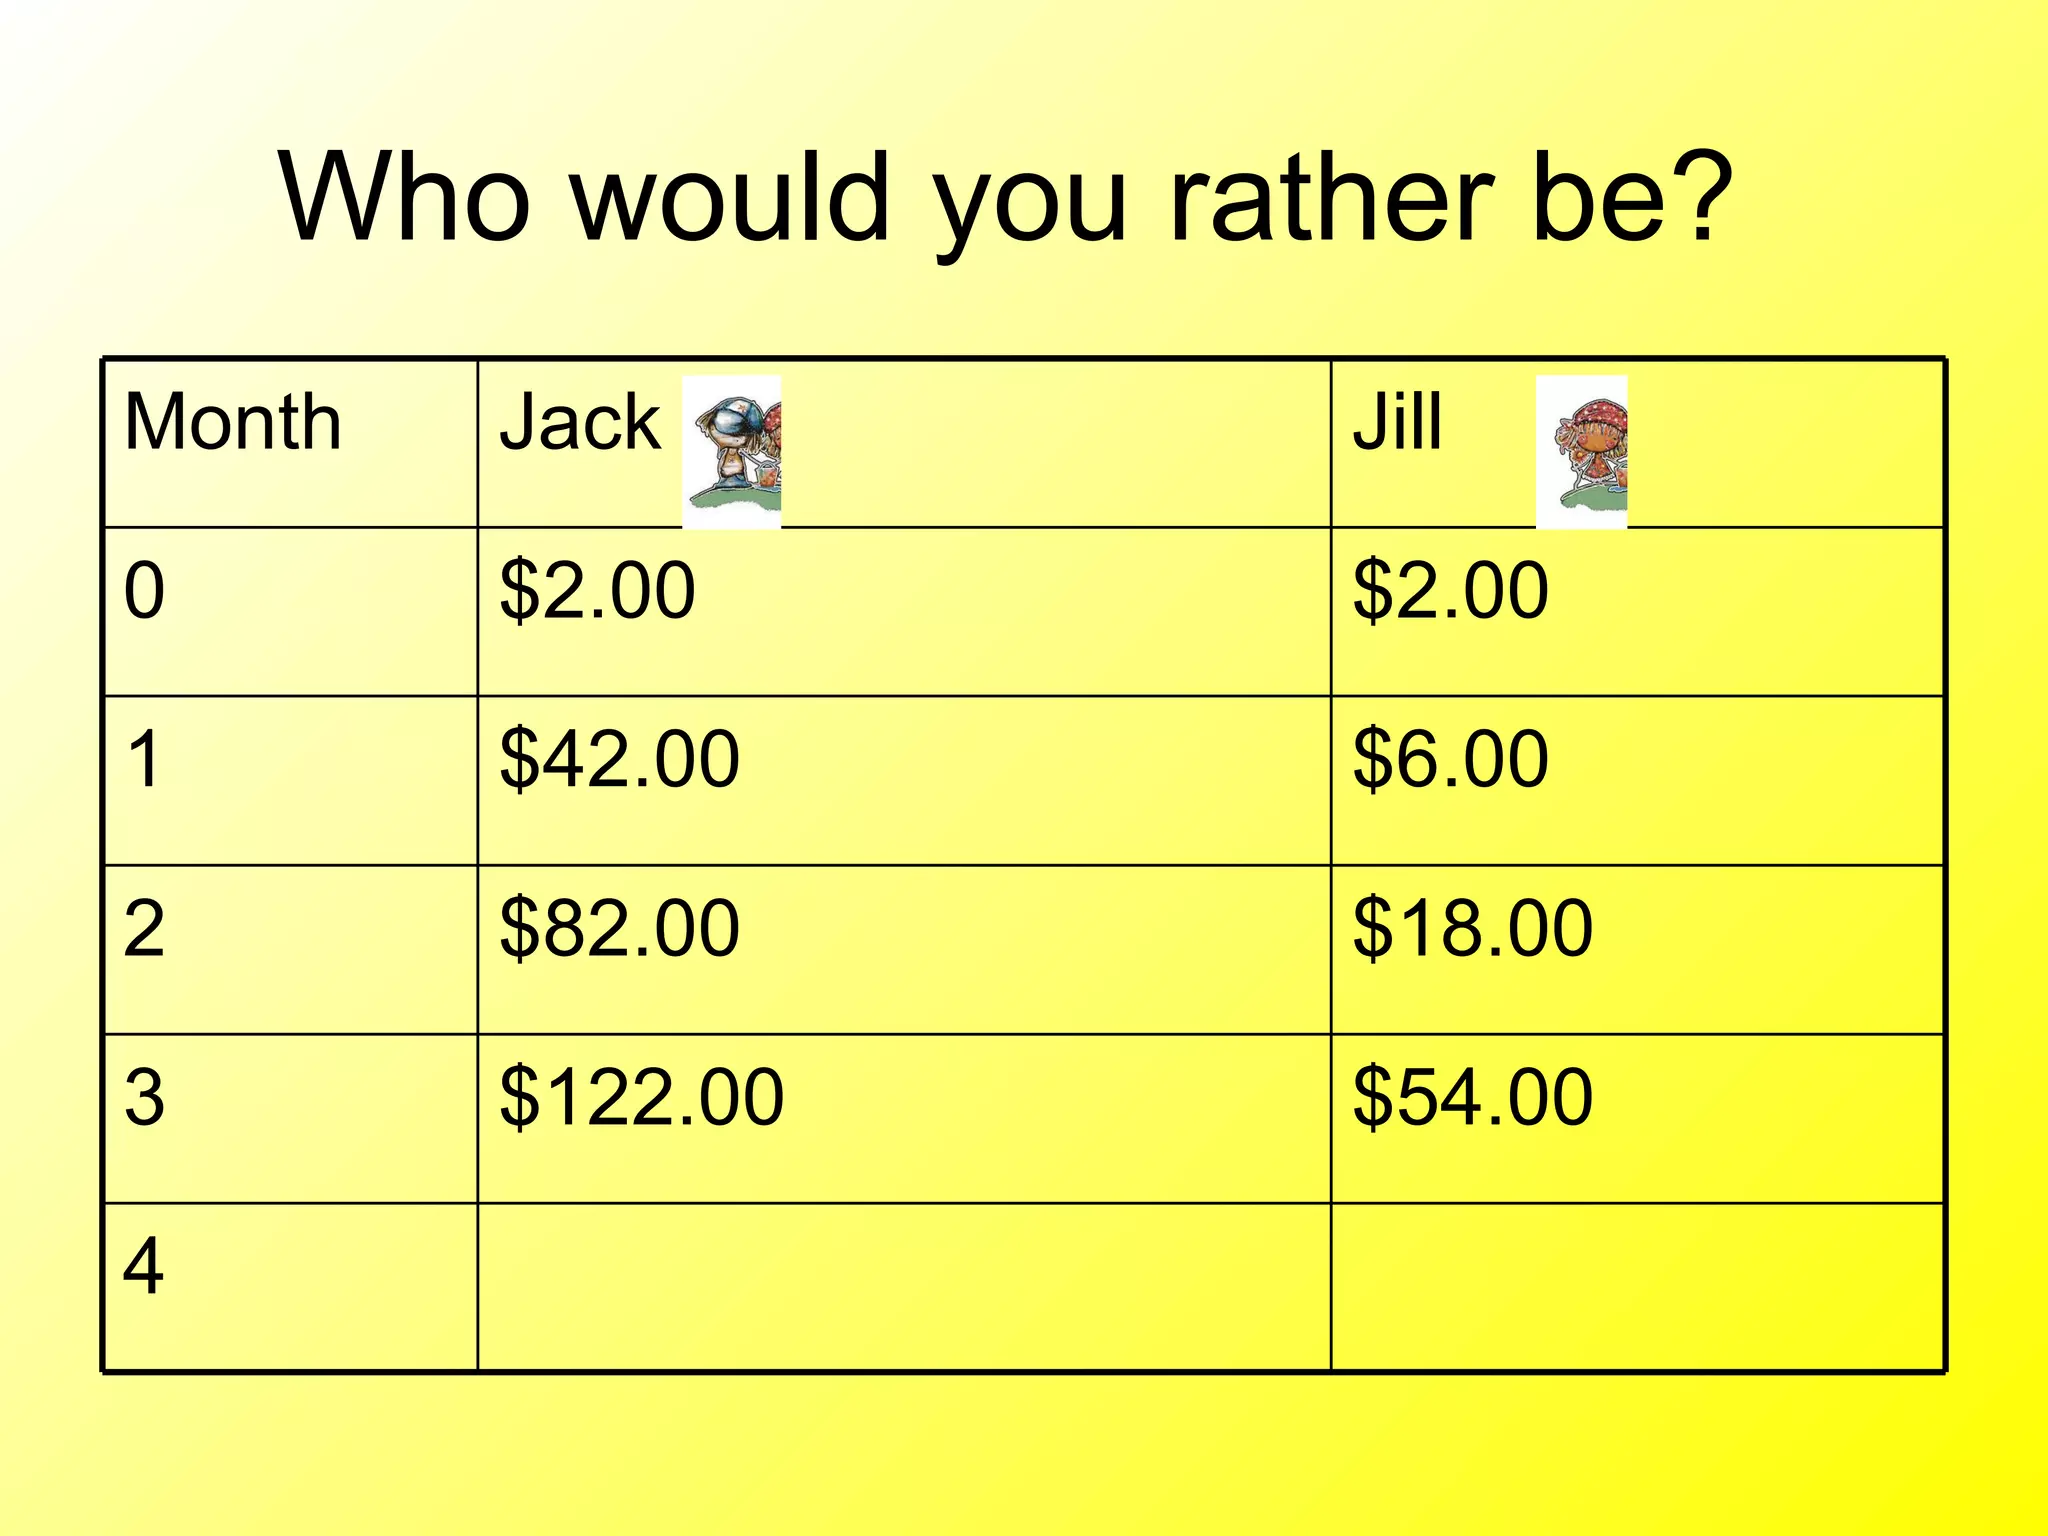
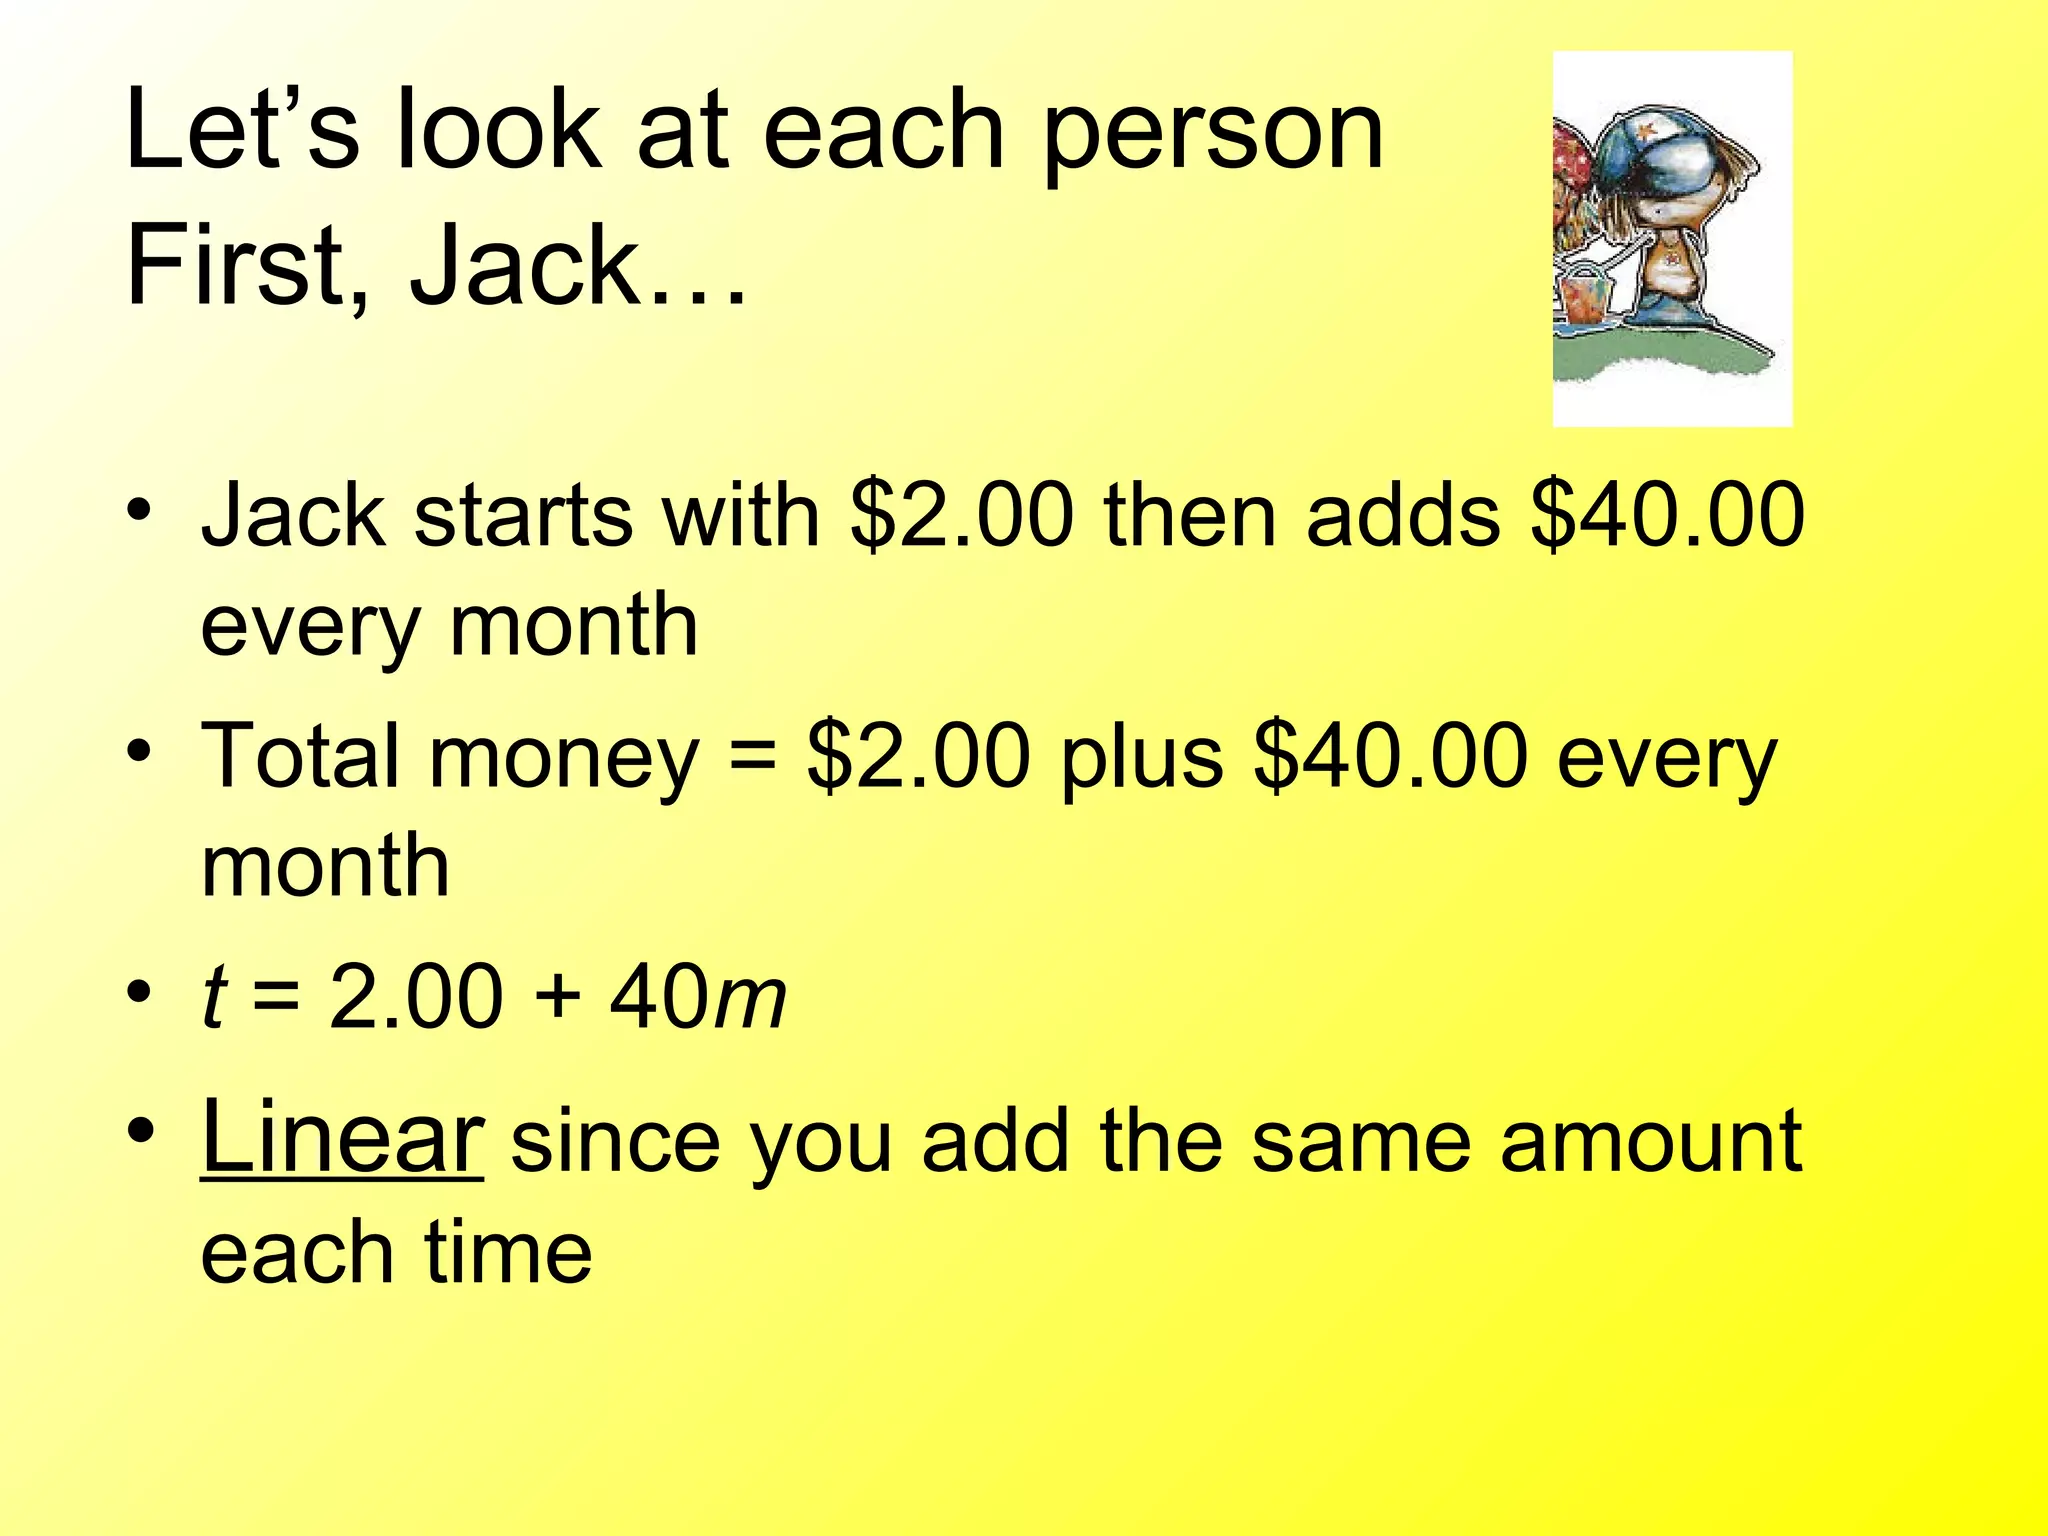
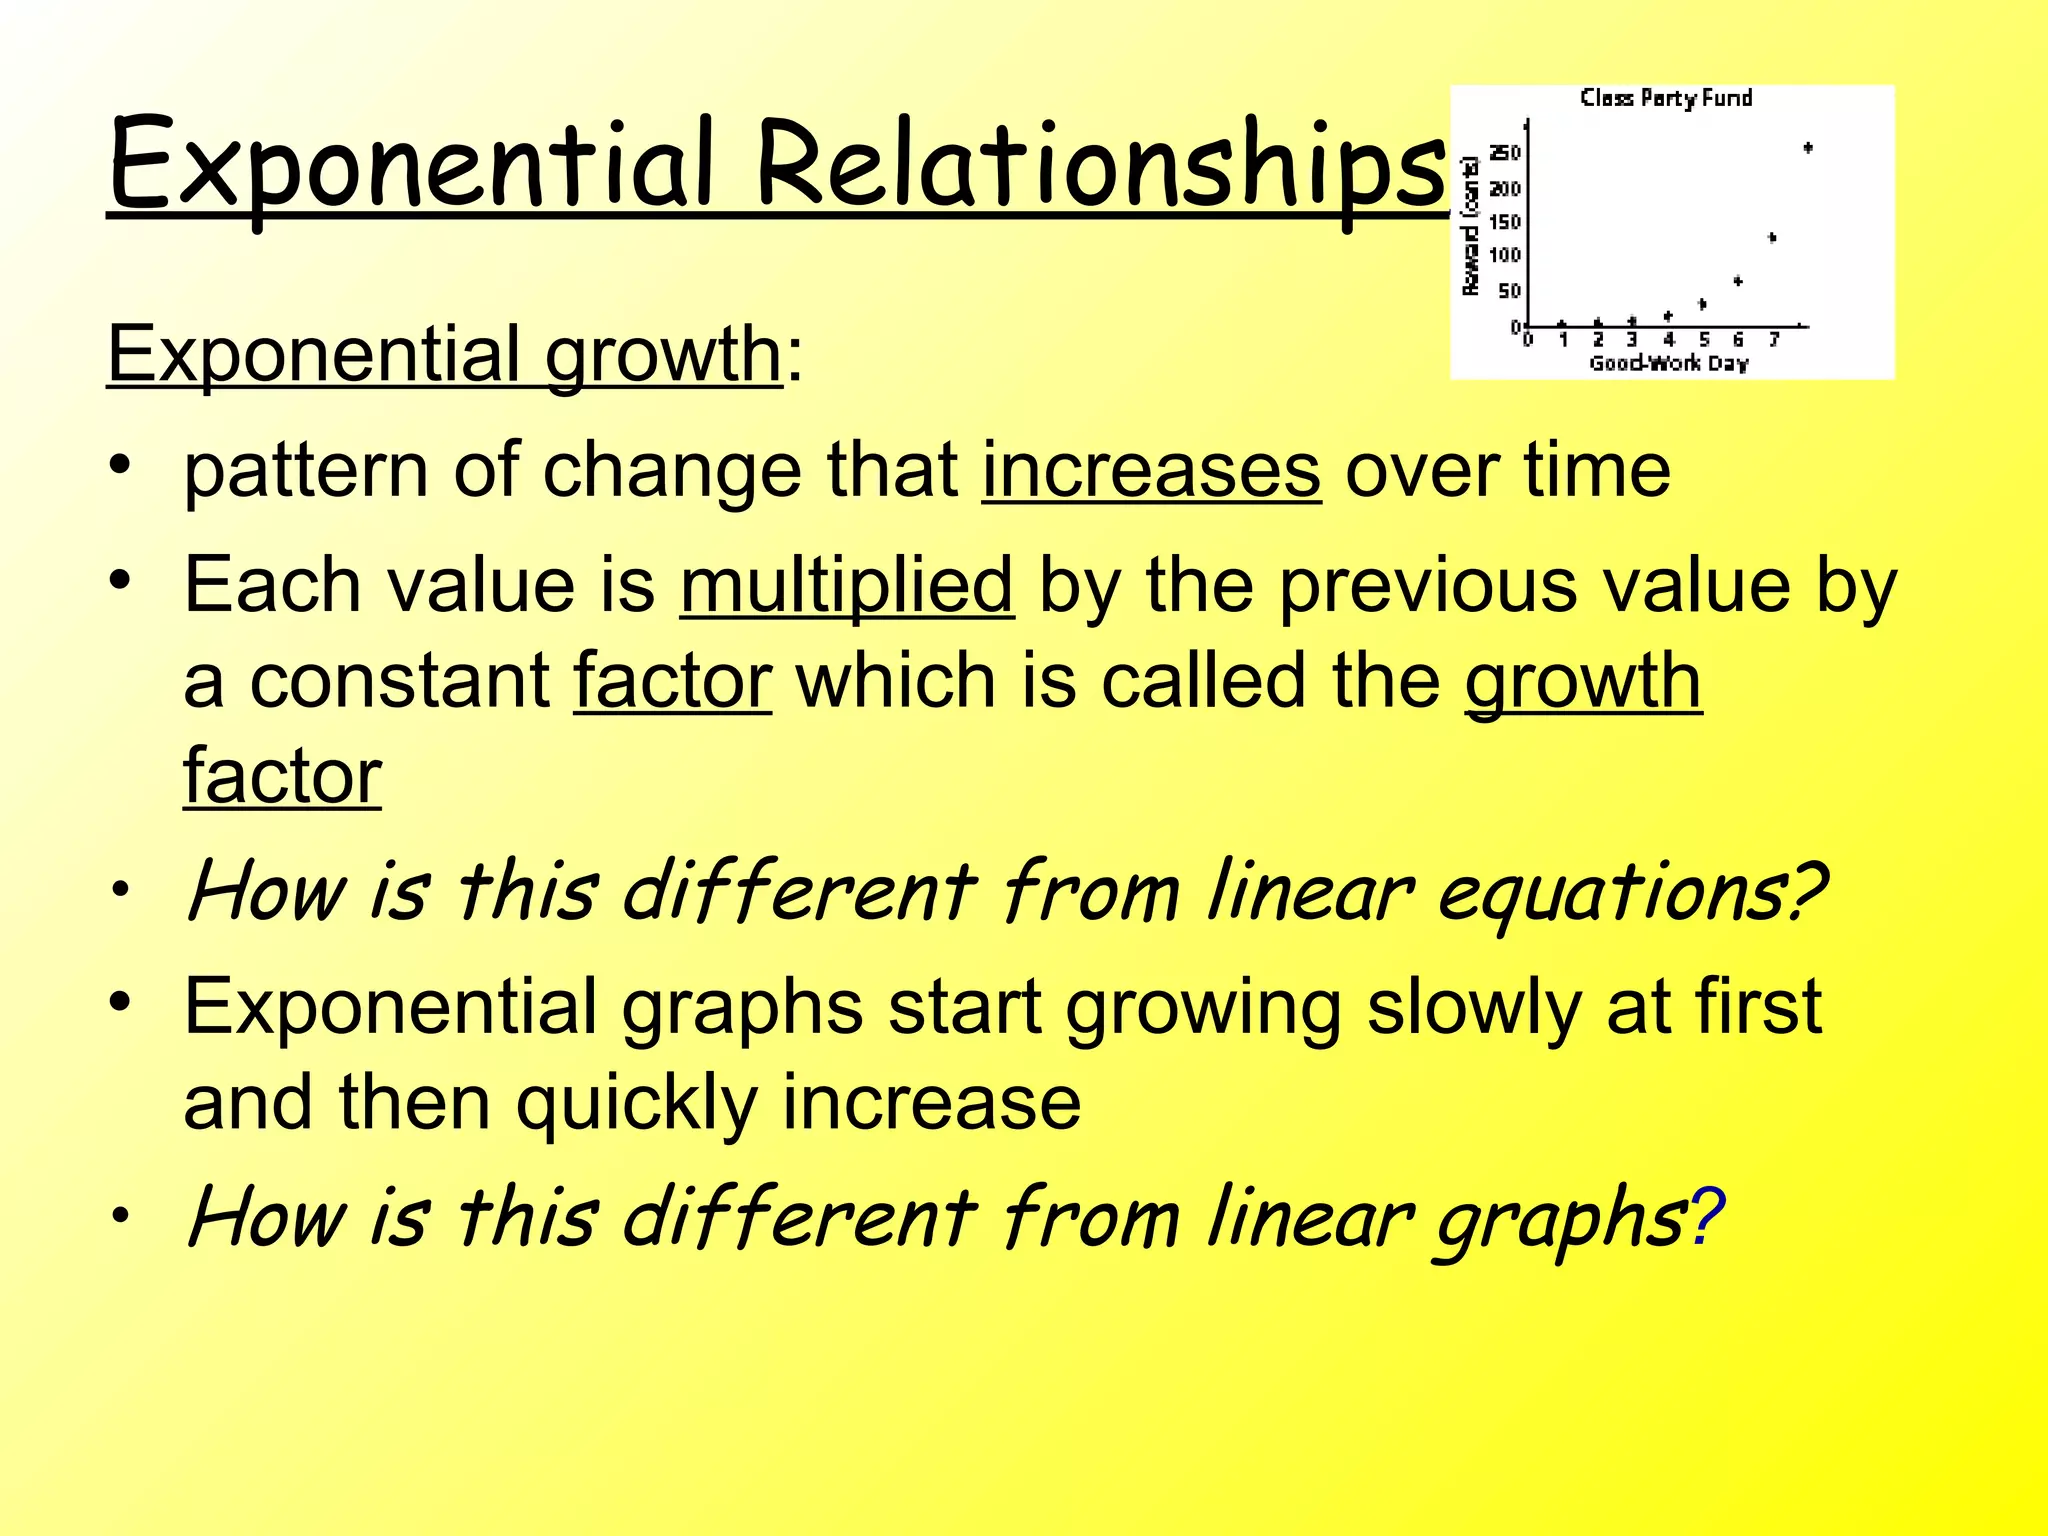
Math relationships GOAL OF THIS BOOK: GROWING, GROWING, GROWNG Are ALL math relationships linear? Why or why not?  Give an example of a linear one. What would the graph look like?  the table?  Give an example of a nonlinear one.  What would the graph look like?  the table? Would the equations look the same?  Why OR why not?  Review:  What does a linear equation look like? y=mx + b y=b + mx  m is the slope, constant rate b is the y-intercept  x could represent books, months, inches
Who would you rather be?  4 $54.00 $122.00 3 $18.00 $82.00 2 $6.00 $42.00 1 $2.00 $2.00 0 Jill Jack Month
Comparing Jack and Jill  How much money do they each start with? What do we call the starting amount? How much are they increasing by each month? Is it a constant rate? Are you adding or subtracting the same amount each time?  Which one of these is linear? Nonlinear?
Let’s look at each person First, Jack…  Jack starts with $2.00 then adds $40.00 every month Total money = $2.00 plus $40.00 every month t  = 2.00 + 40 m   Linear  since you add the same amount each time
Now Jill… Jill also starts with $2.00 then you multiply by 3 for every month Total money = $2.00 then multiply by 3 for every  month t  = 2.00(3 x ) It is NOT linear since you do NOT add the same amount It is  Exponential  since you are MULTIPLYING and the equation has an exponent in it
Exponential Relationships   Exponential growth :  pattern of change that  increases  over time Each value is  multiplied  by the previous value by a constant  factor  which is called the  growth factor How is this different from linear equations?   Exponential graphs start growing slowly at first and then quickly increase How is this different from linear graphs ?
Exponential growth equations y = b(g x ) b = is the starting amount  it also is the y-intercept g = is the growth factor; what you are multiplying by each time x = is the time interval such as hours, days, years How is this equation different from linear equations?
Exponential Decay pattern of change that  decreases  over time each value is  multiplied  by the previous value by a constant factor which is called the  decay factor You can find it by dividing each successive y-value by the previous y-value y = b(g x )   same equation but the decay factor will be <1 The graph starts out decreasing slowly then decreases quickly Will the graph ever go pass the x-intercept?  1 - % decrease as a rate (decimal) OR ask yourself what % is remaining? Examples in real-life : carbon dating to find the age of an object/organism;  decay of radioactive substances; populations of endangered species

Exponential Relationships

  • 1.
    Math relationships GOALOF THIS BOOK: GROWING, GROWING, GROWNG Are ALL math relationships linear? Why or why not? Give an example of a linear one. What would the graph look like? the table? Give an example of a nonlinear one. What would the graph look like? the table? Would the equations look the same? Why OR why not? Review: What does a linear equation look like? y=mx + b y=b + mx m is the slope, constant rate b is the y-intercept x could represent books, months, inches
  • 2.
    Who would yourather be? 4 $54.00 $122.00 3 $18.00 $82.00 2 $6.00 $42.00 1 $2.00 $2.00 0 Jill Jack Month
  • 3.
    Comparing Jack andJill How much money do they each start with? What do we call the starting amount? How much are they increasing by each month? Is it a constant rate? Are you adding or subtracting the same amount each time? Which one of these is linear? Nonlinear?
  • 4.
    Let’s look ateach person First, Jack… Jack starts with $2.00 then adds $40.00 every month Total money = $2.00 plus $40.00 every month t = 2.00 + 40 m Linear since you add the same amount each time
  • 5.
    Now Jill… Jillalso starts with $2.00 then you multiply by 3 for every month Total money = $2.00 then multiply by 3 for every month t = 2.00(3 x ) It is NOT linear since you do NOT add the same amount It is Exponential since you are MULTIPLYING and the equation has an exponent in it
  • 6.
    Exponential Relationships Exponential growth : pattern of change that increases over time Each value is multiplied by the previous value by a constant factor which is called the growth factor How is this different from linear equations? Exponential graphs start growing slowly at first and then quickly increase How is this different from linear graphs ?
  • 7.
    Exponential growth equationsy = b(g x ) b = is the starting amount it also is the y-intercept g = is the growth factor; what you are multiplying by each time x = is the time interval such as hours, days, years How is this equation different from linear equations?
  • 8.
    Exponential Decay patternof change that decreases over time each value is multiplied by the previous value by a constant factor which is called the decay factor You can find it by dividing each successive y-value by the previous y-value y = b(g x ) same equation but the decay factor will be <1 The graph starts out decreasing slowly then decreases quickly Will the graph ever go pass the x-intercept? 1 - % decrease as a rate (decimal) OR ask yourself what % is remaining? Examples in real-life : carbon dating to find the age of an object/organism; decay of radioactive substances; populations of endangered species