


![1
0
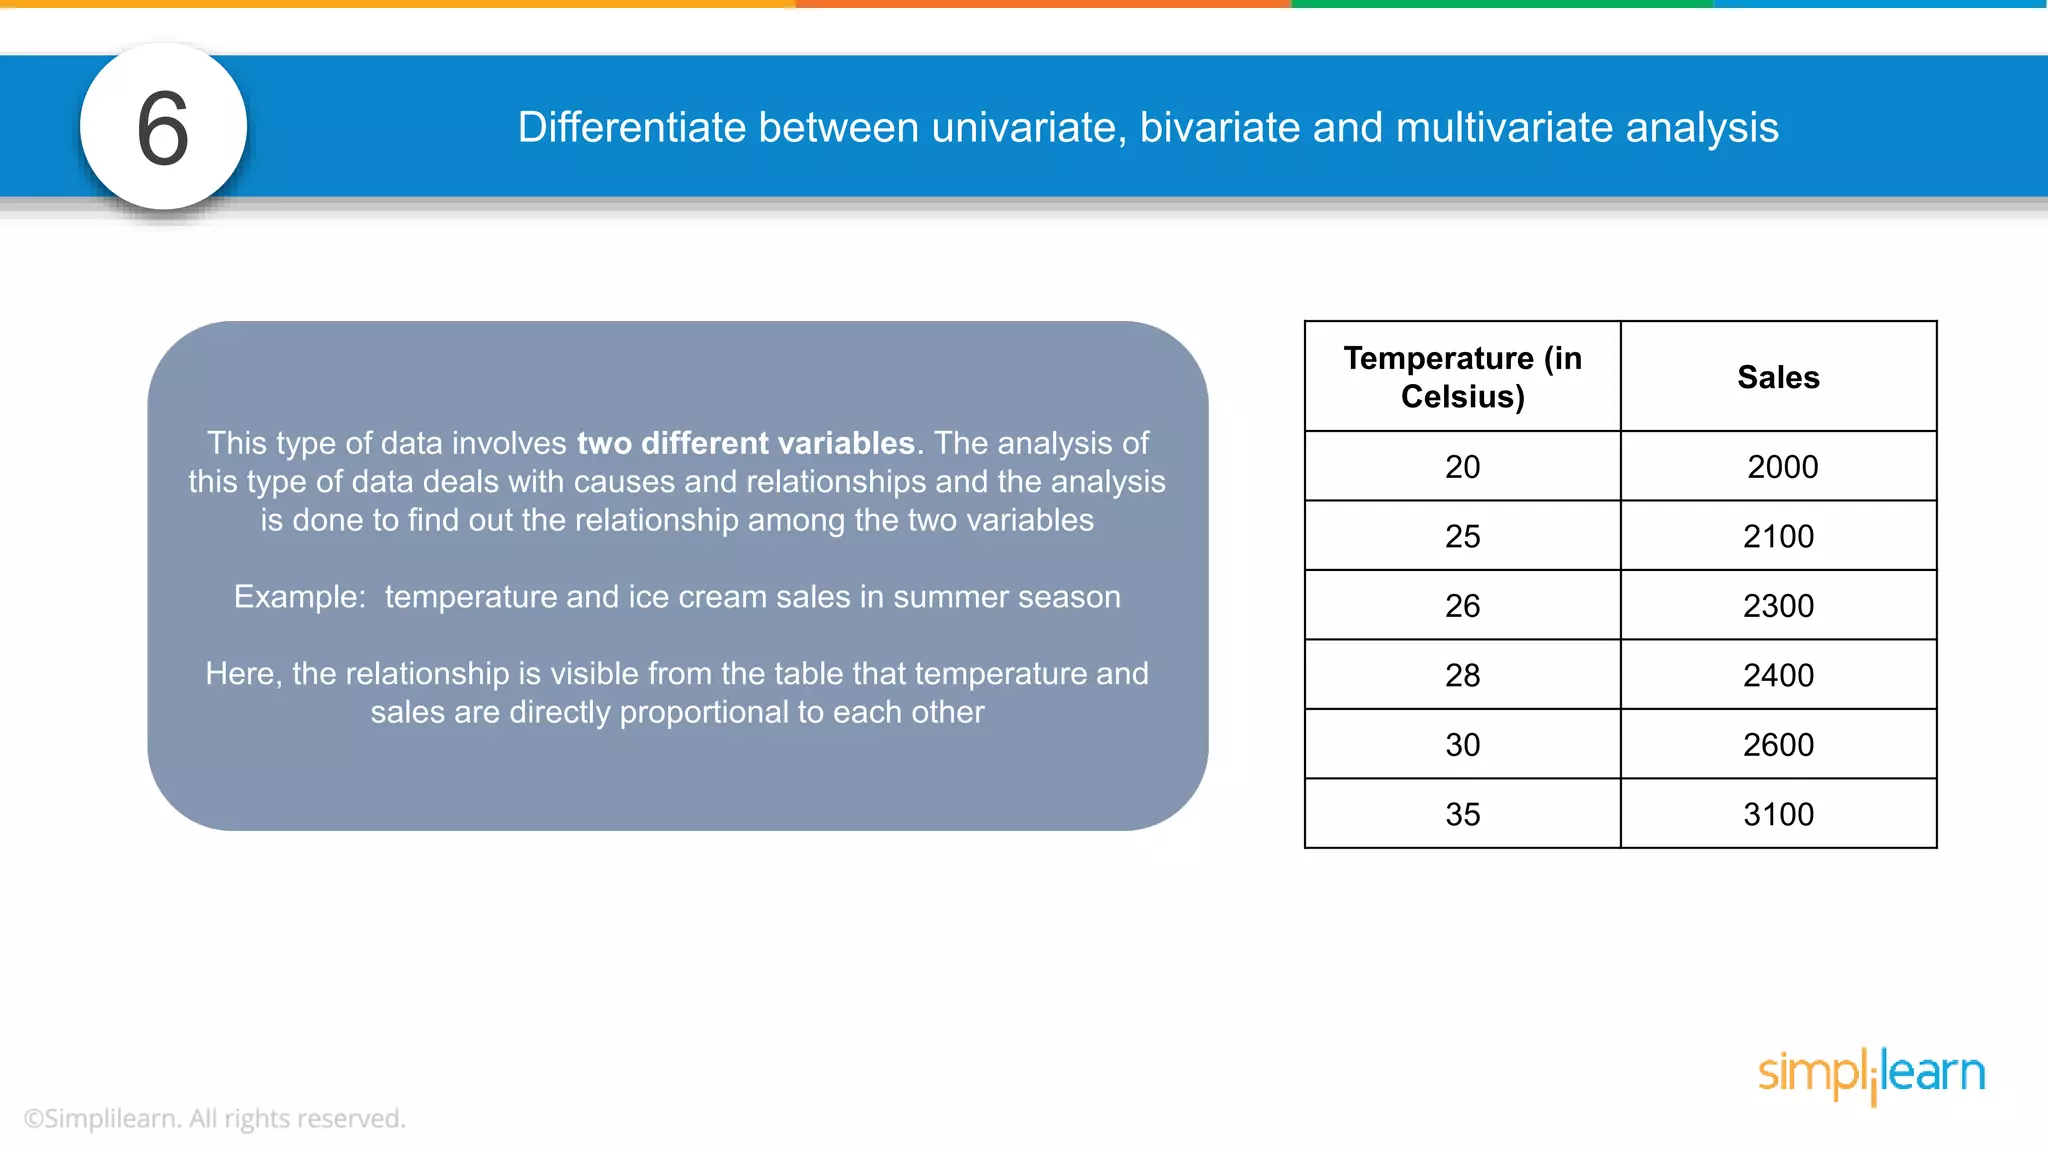
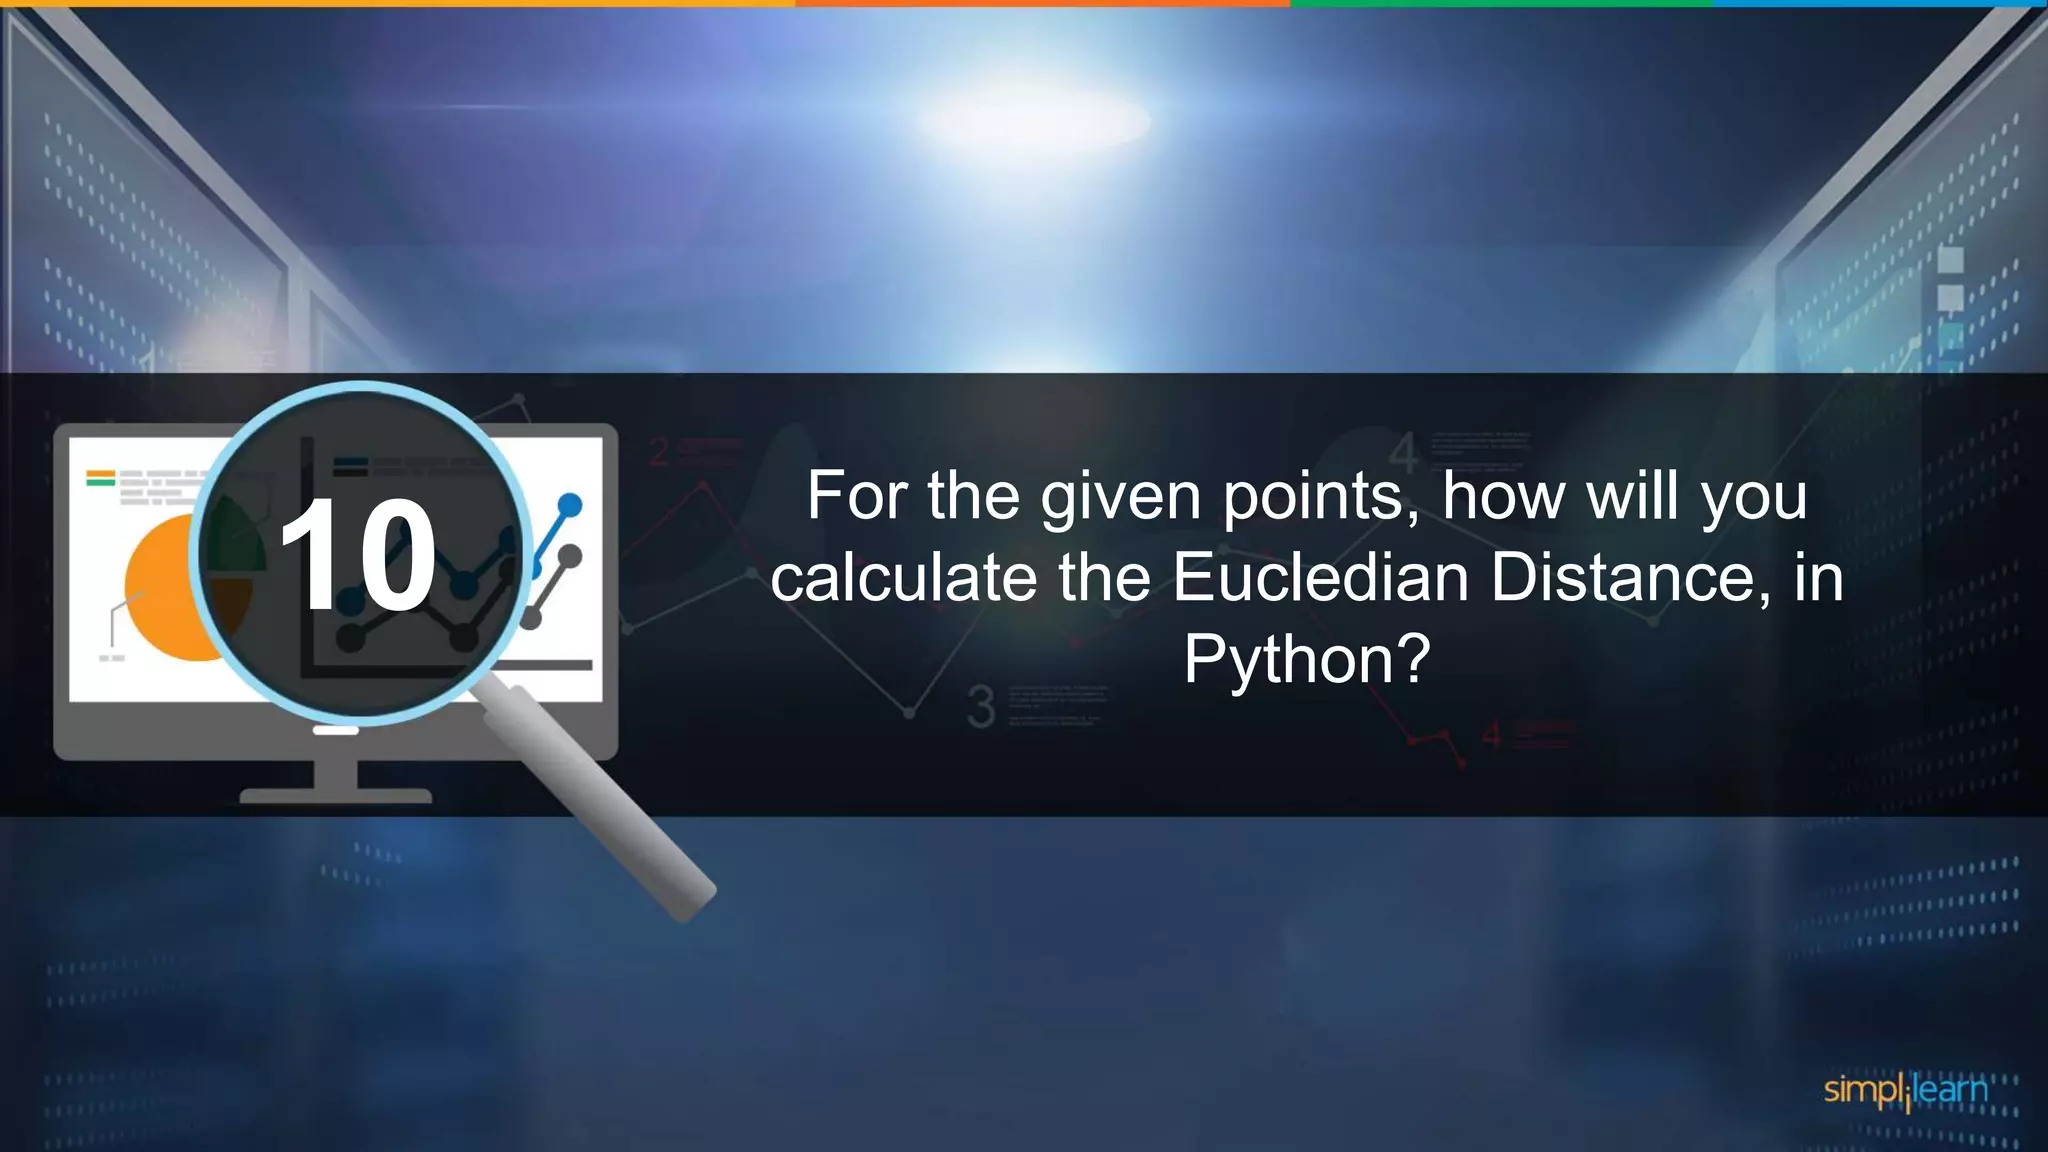
For the given points, how will you calculate the Eucledian Distance, in Python?
Given points:
plot1 = [1,3]
plot2 = [2,5]
euclidean_distance = sqrt( (plot1[0]-plot2[0])**2 + (plot1[1]-plot2[1])**2 )](https://image.slidesharecdn.com/datascienceinterviewquestions021-181109091927/75/Data-Science-Interview-Questions-Data-Science-Interview-Questions-And-Answers-Simplilearn-30-2048.jpg)


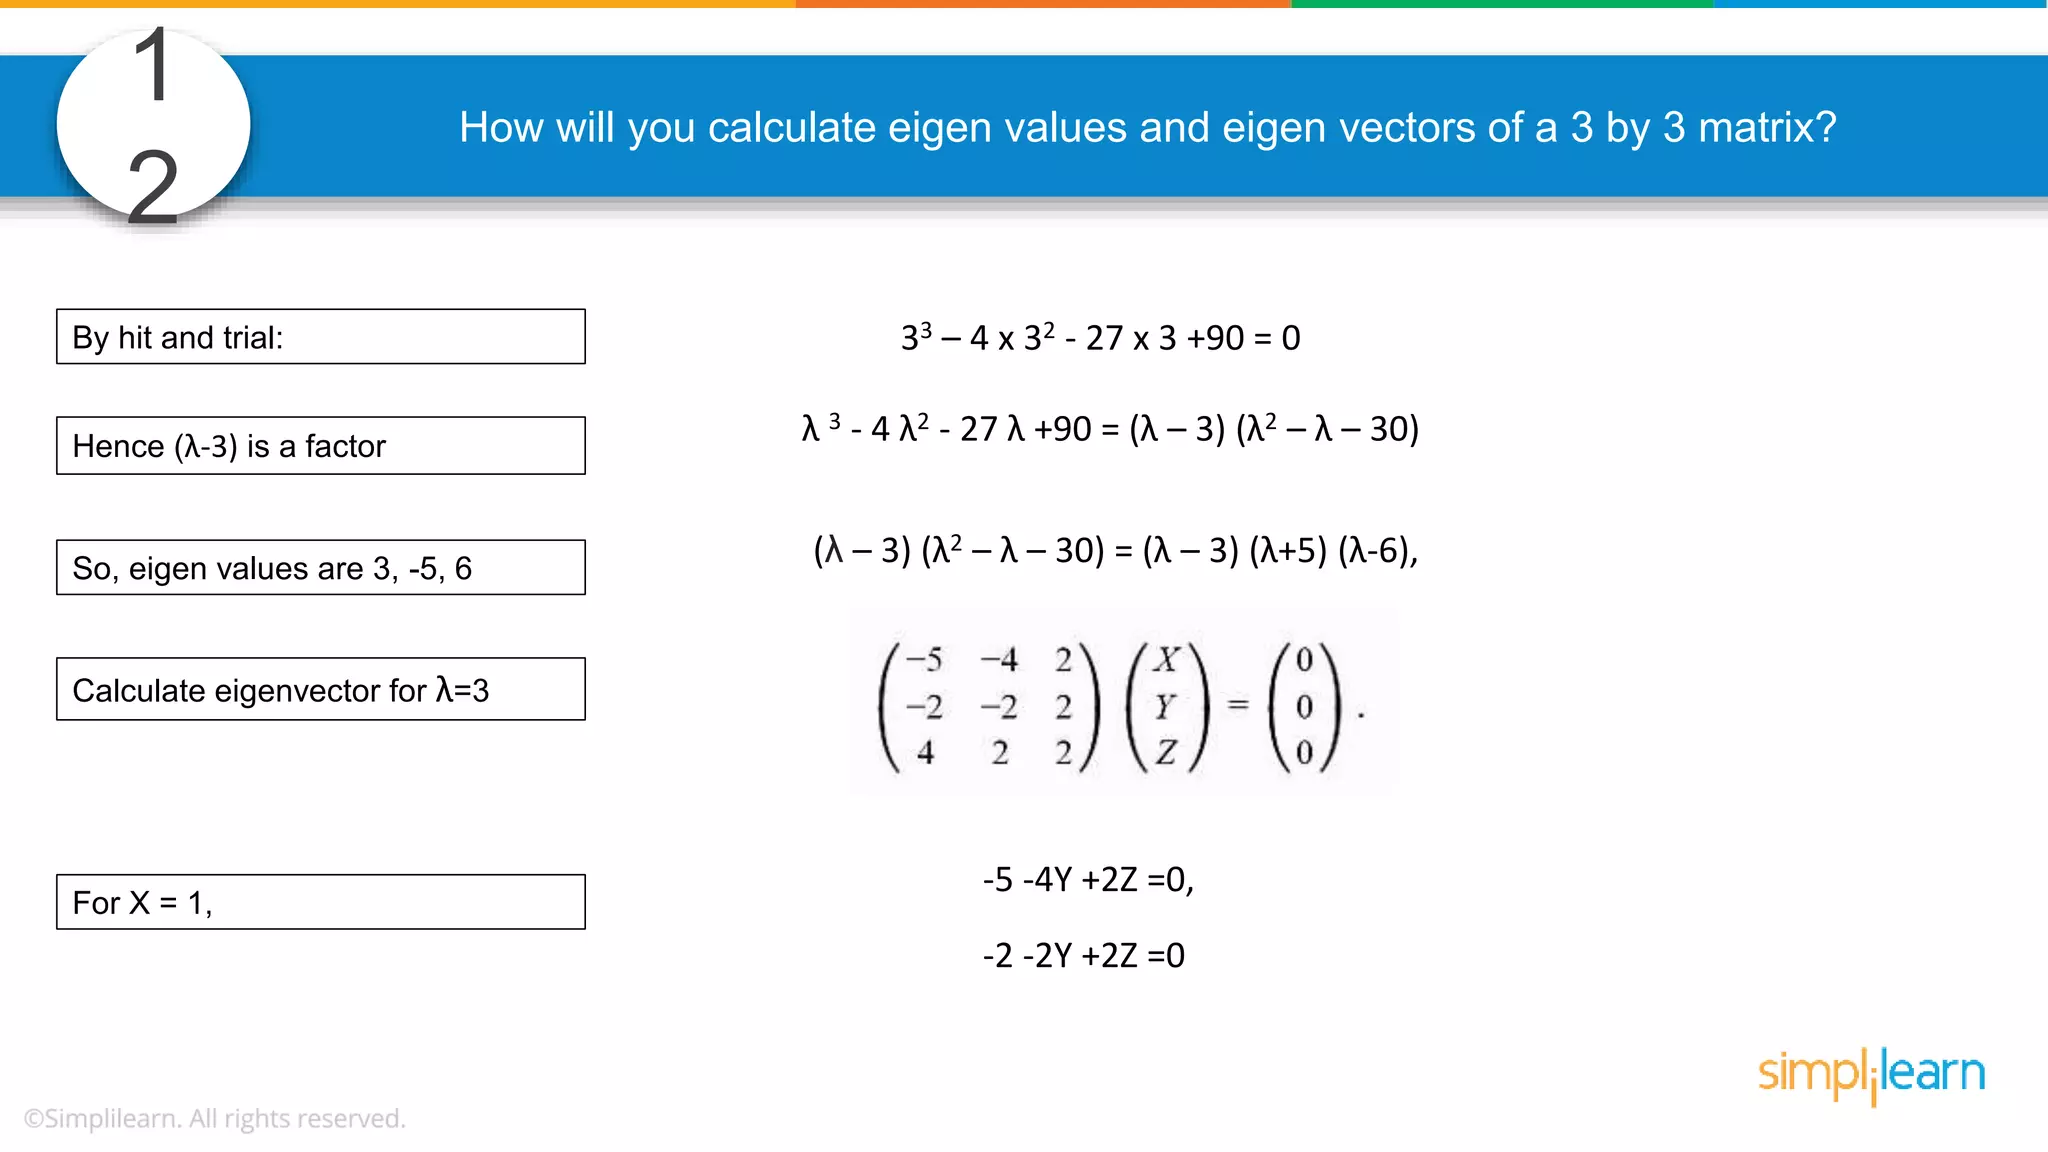
![1
2
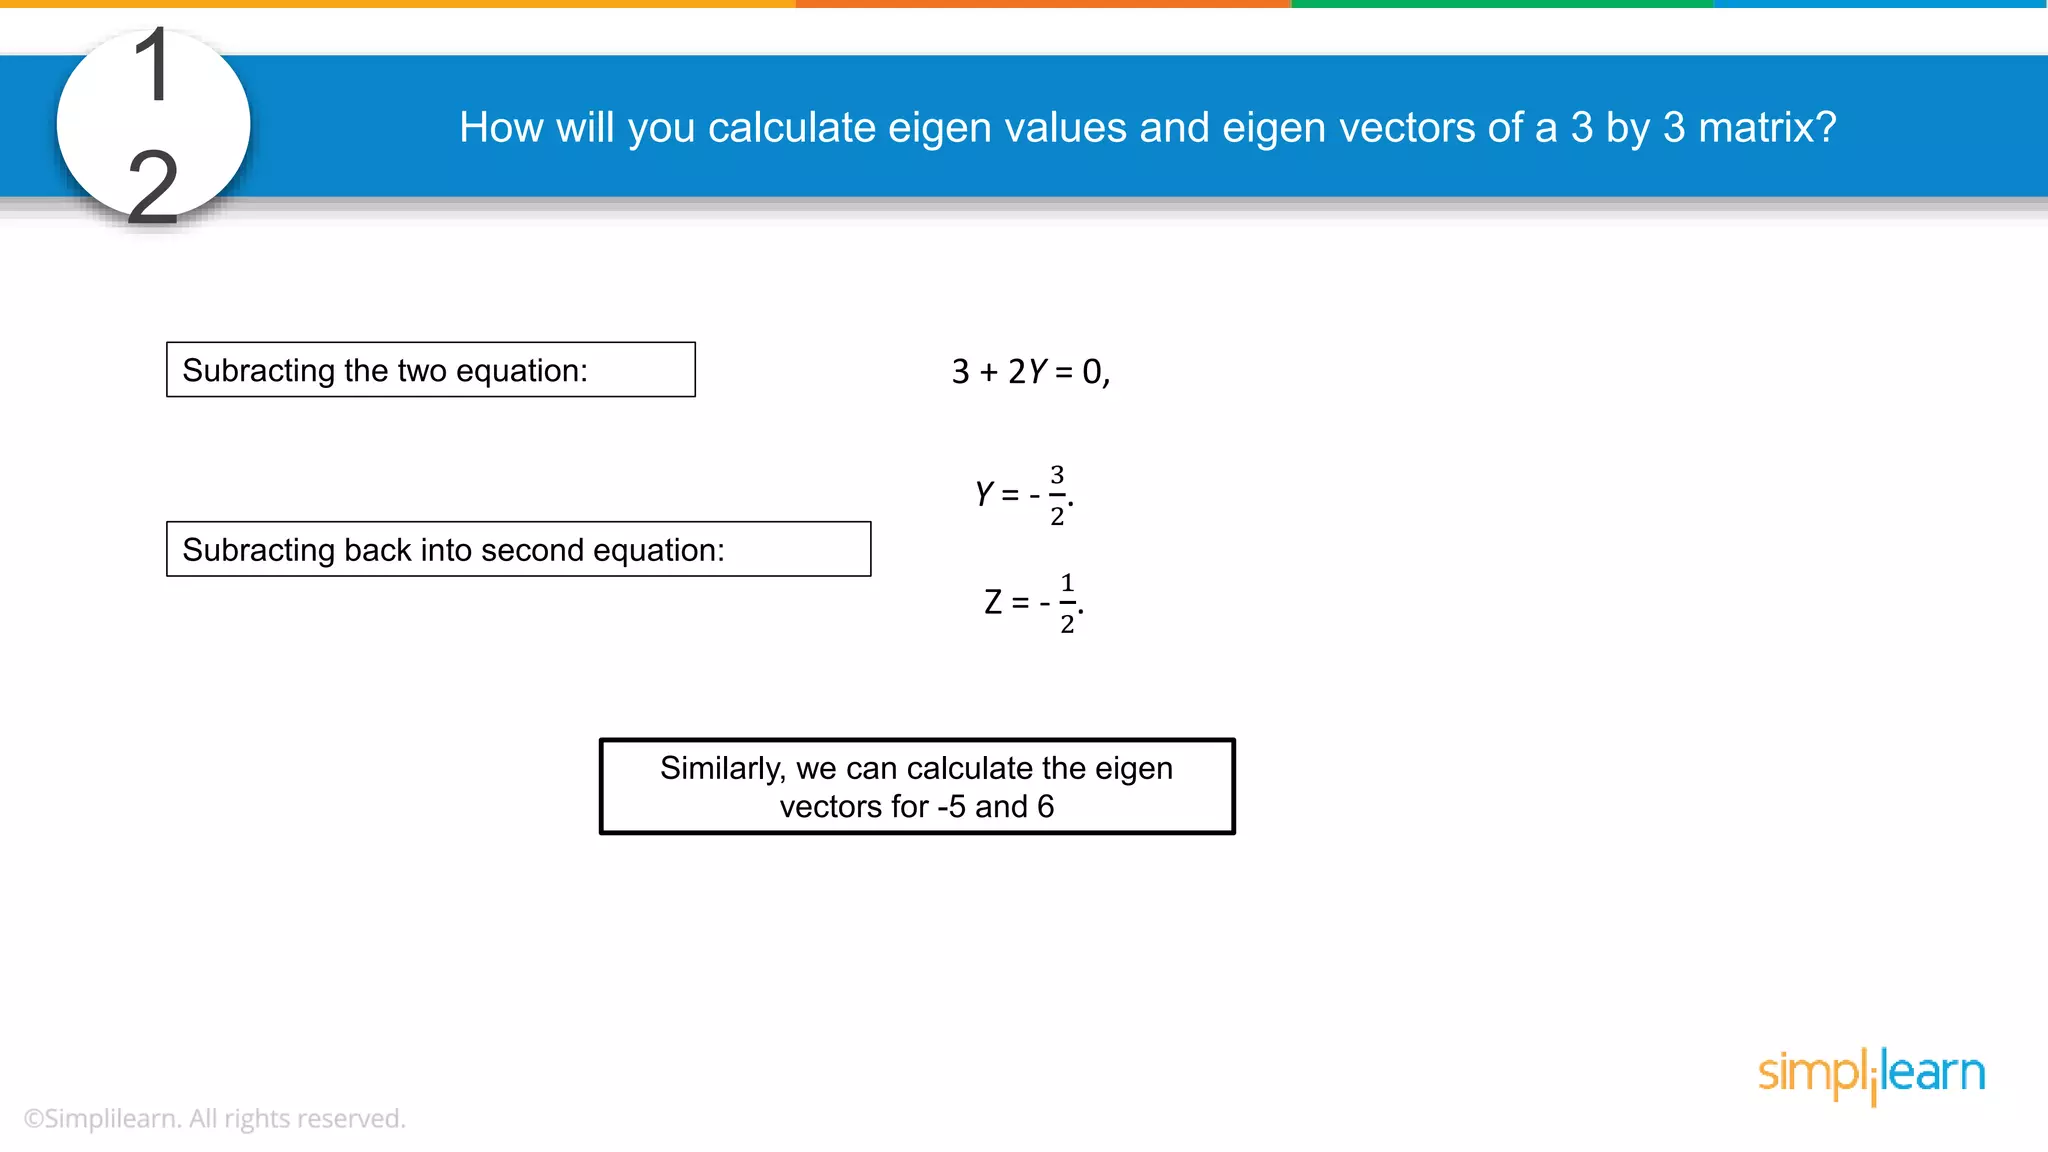
How will you calculate eigen values and eigen vectors of a 3 by 3 matrix?
-2 -4 2
-2 1 2
4 2 5
Characteristic equation:
Expanding determinant: (-2 – λ) [(1-λ) (5-λ)-2x2] + 4[(-2) x (5-λ) -4x2] + 2[(-2) x 2-4(1-λ)] =0
- λ3 + 4 λ2 + 27λ – 90 = 0,
λ 3 - 4 λ2 -27 λ + 90 = 0](https://image.slidesharecdn.com/datascienceinterviewquestions021-181109091927/75/Data-Science-Interview-Questions-Data-Science-Interview-Questions-And-Answers-Simplilearn-36-2048.jpg)


![What are the datatypes supported in Tableau?1
Below are the 8 actual values of target
variable in the train file.
[0,0,0,1,1,1,1,1]
What is the entropy of the target variable?
26](https://image.slidesharecdn.com/datascienceinterviewquestions021-181109091927/75/Data-Science-Interview-Questions-Data-Science-Interview-Questions-And-Answers-Simplilearn-75-2048.jpg)
![26 What is the entropy of the target variable?
-(5/8 log(5/8) + 3/8 log(3/8))
5/8 log(5/8) + 3/8 log(3/8)
3/8 log(5/8) + 5/8 log(3/8)
5/8 log(3/8) – 3/8 log(5/8)
[0,0,0,1,1,1,1,1]](https://image.slidesharecdn.com/datascienceinterviewquestions021-181109091927/75/Data-Science-Interview-Questions-Data-Science-Interview-Questions-And-Answers-Simplilearn-76-2048.jpg)
![26 What is the entropy of the target variable?
-(5/8 log(5/8) + 3/8 log(3/8))
5/8 log(5/8) + 3/8 log(3/8)
3/8 log(5/8) + 5/8 log(3/8)
5/8 log(3/8) – 3/8 log(5/8)
[0,0,0,1,1,1,1,1]
Hint:](https://image.slidesharecdn.com/datascienceinterviewquestions021-181109091927/75/Data-Science-Interview-Questions-Data-Science-Interview-Questions-And-Answers-Simplilearn-77-2048.jpg)

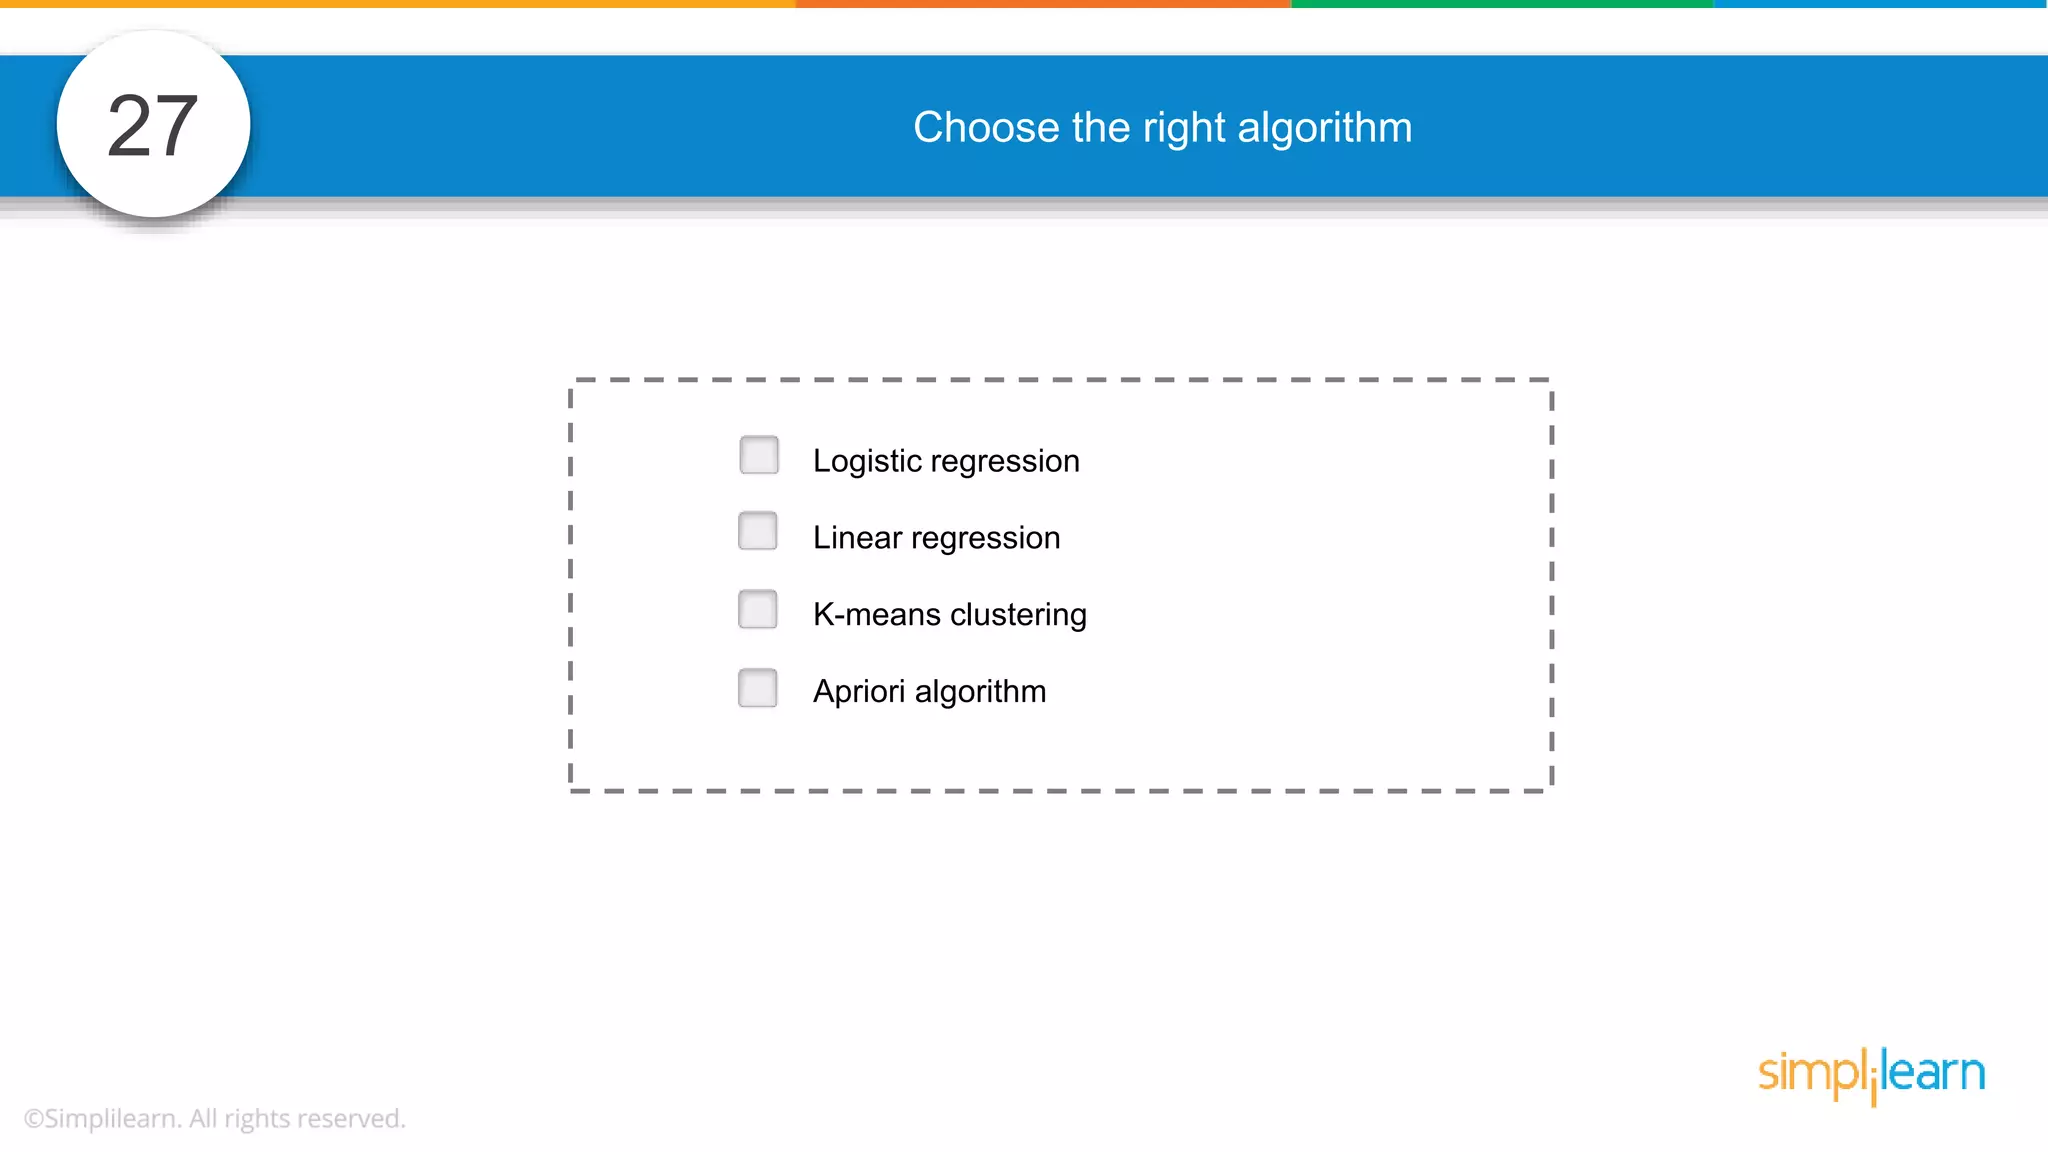

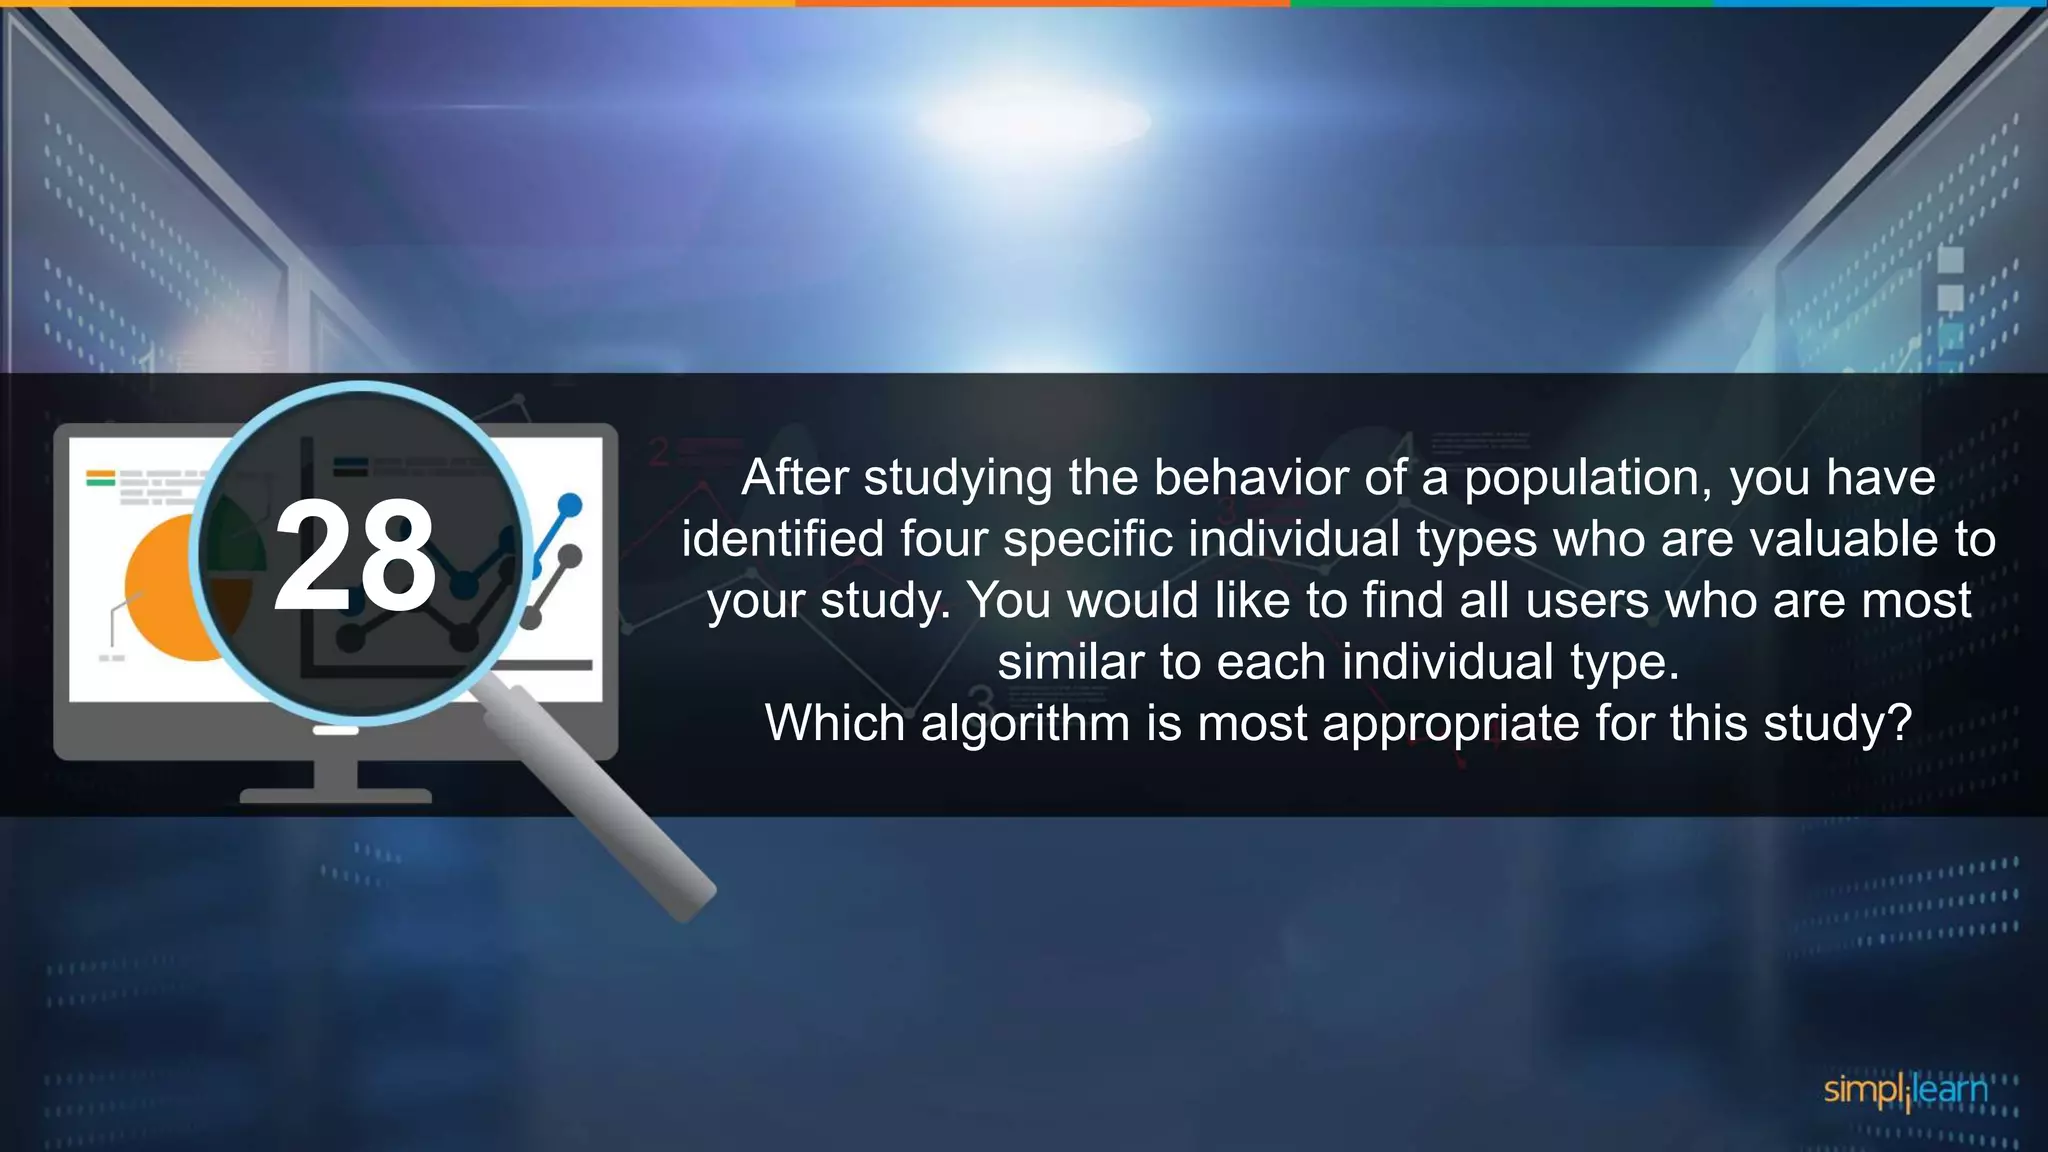

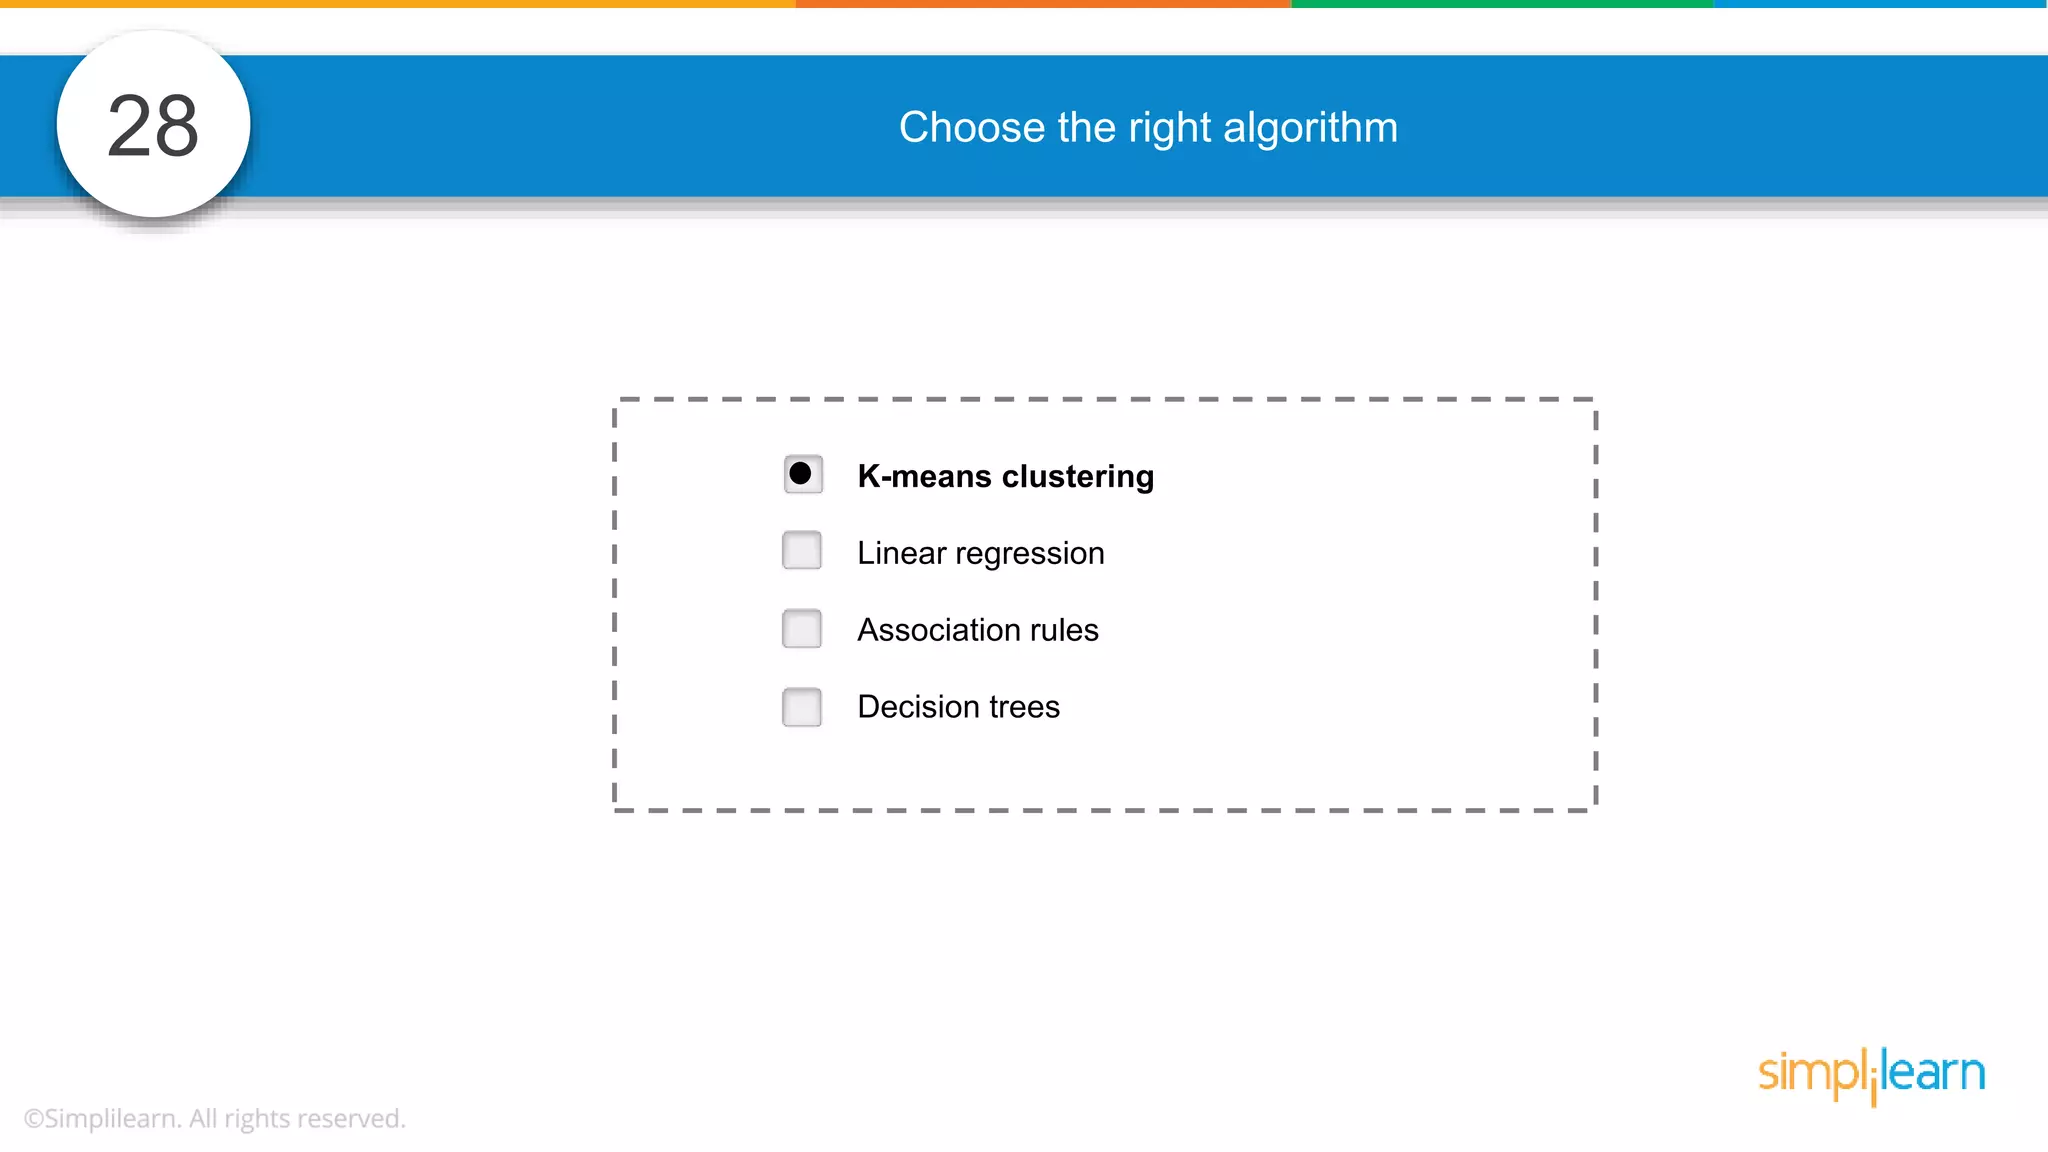
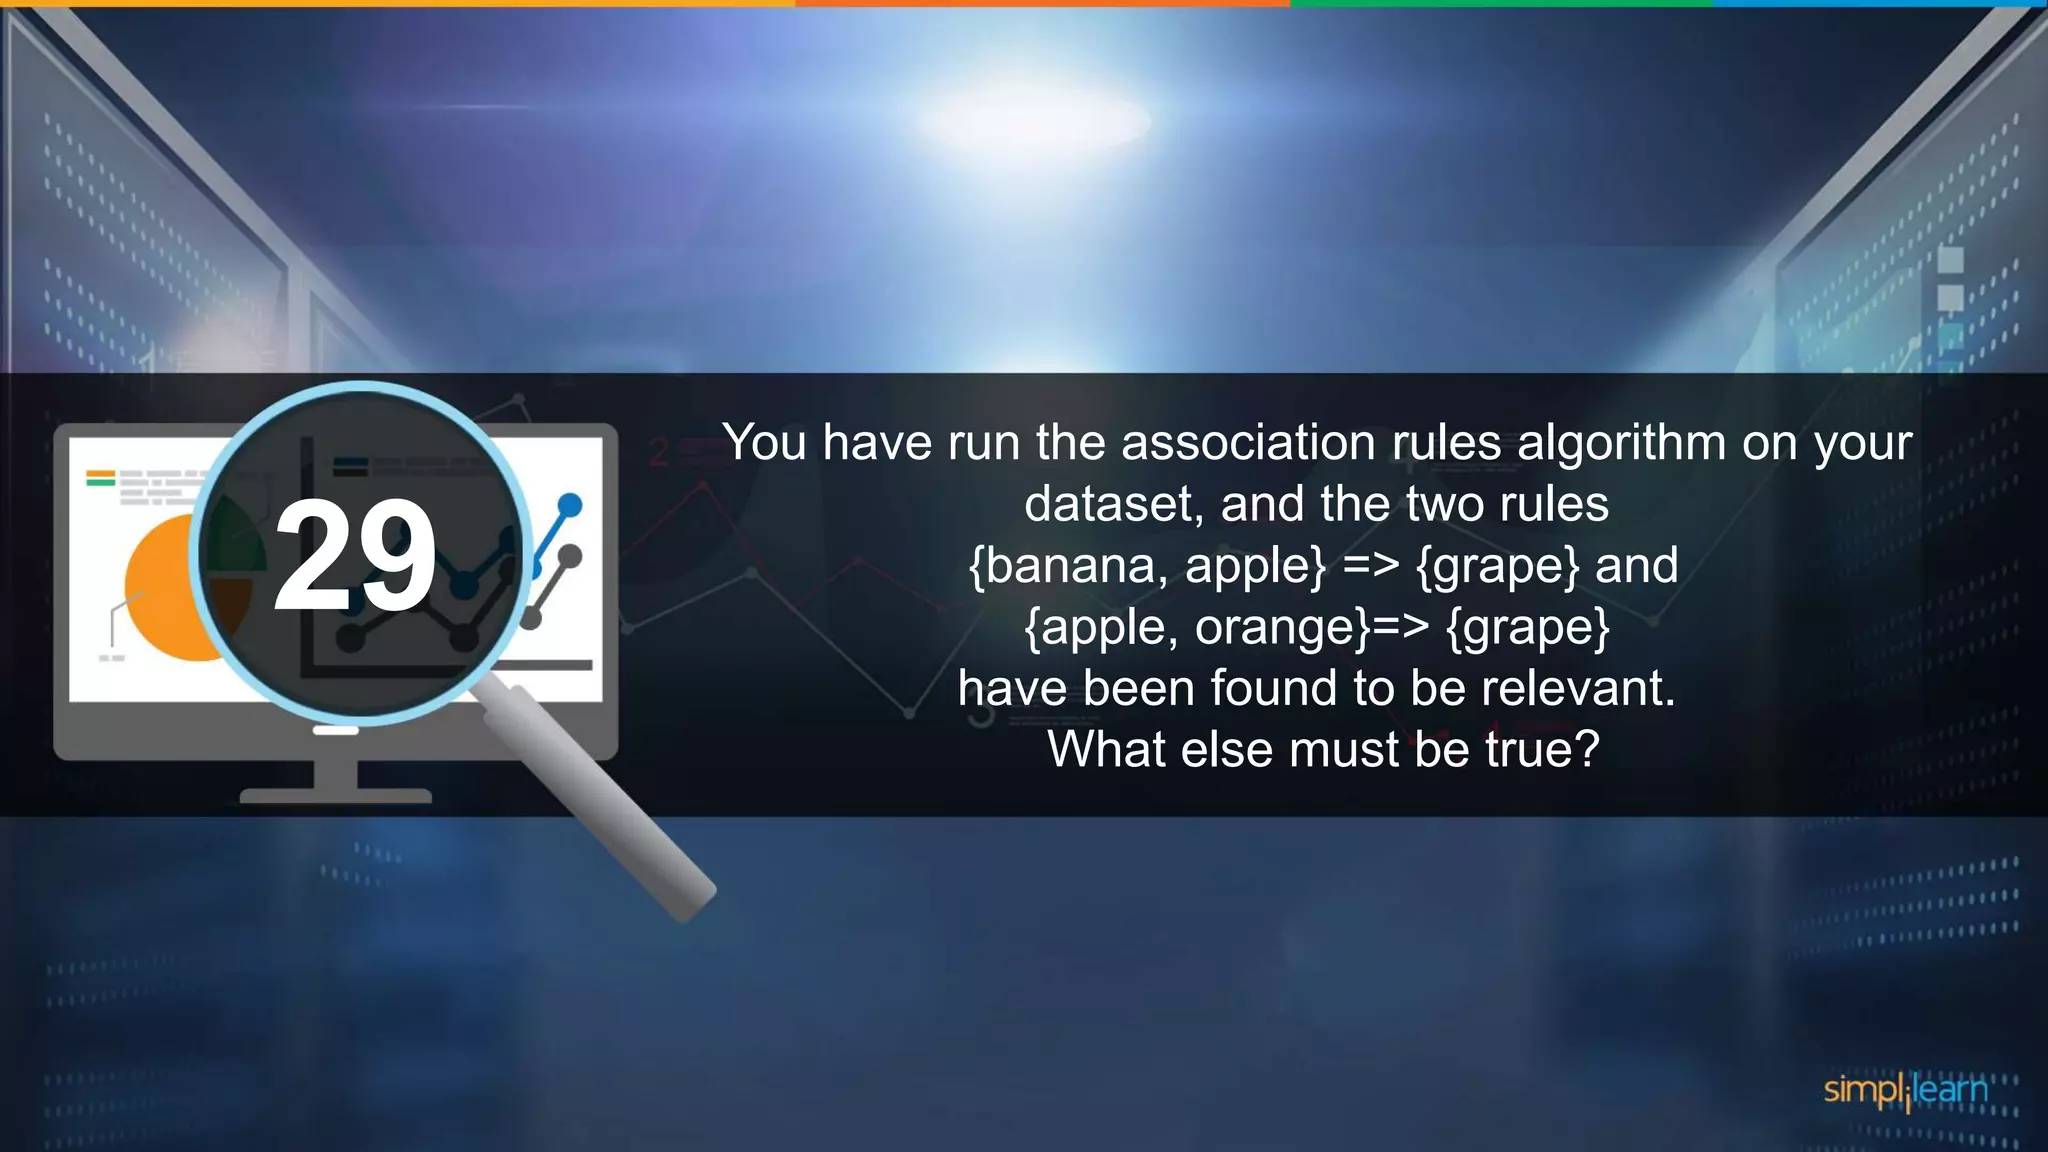


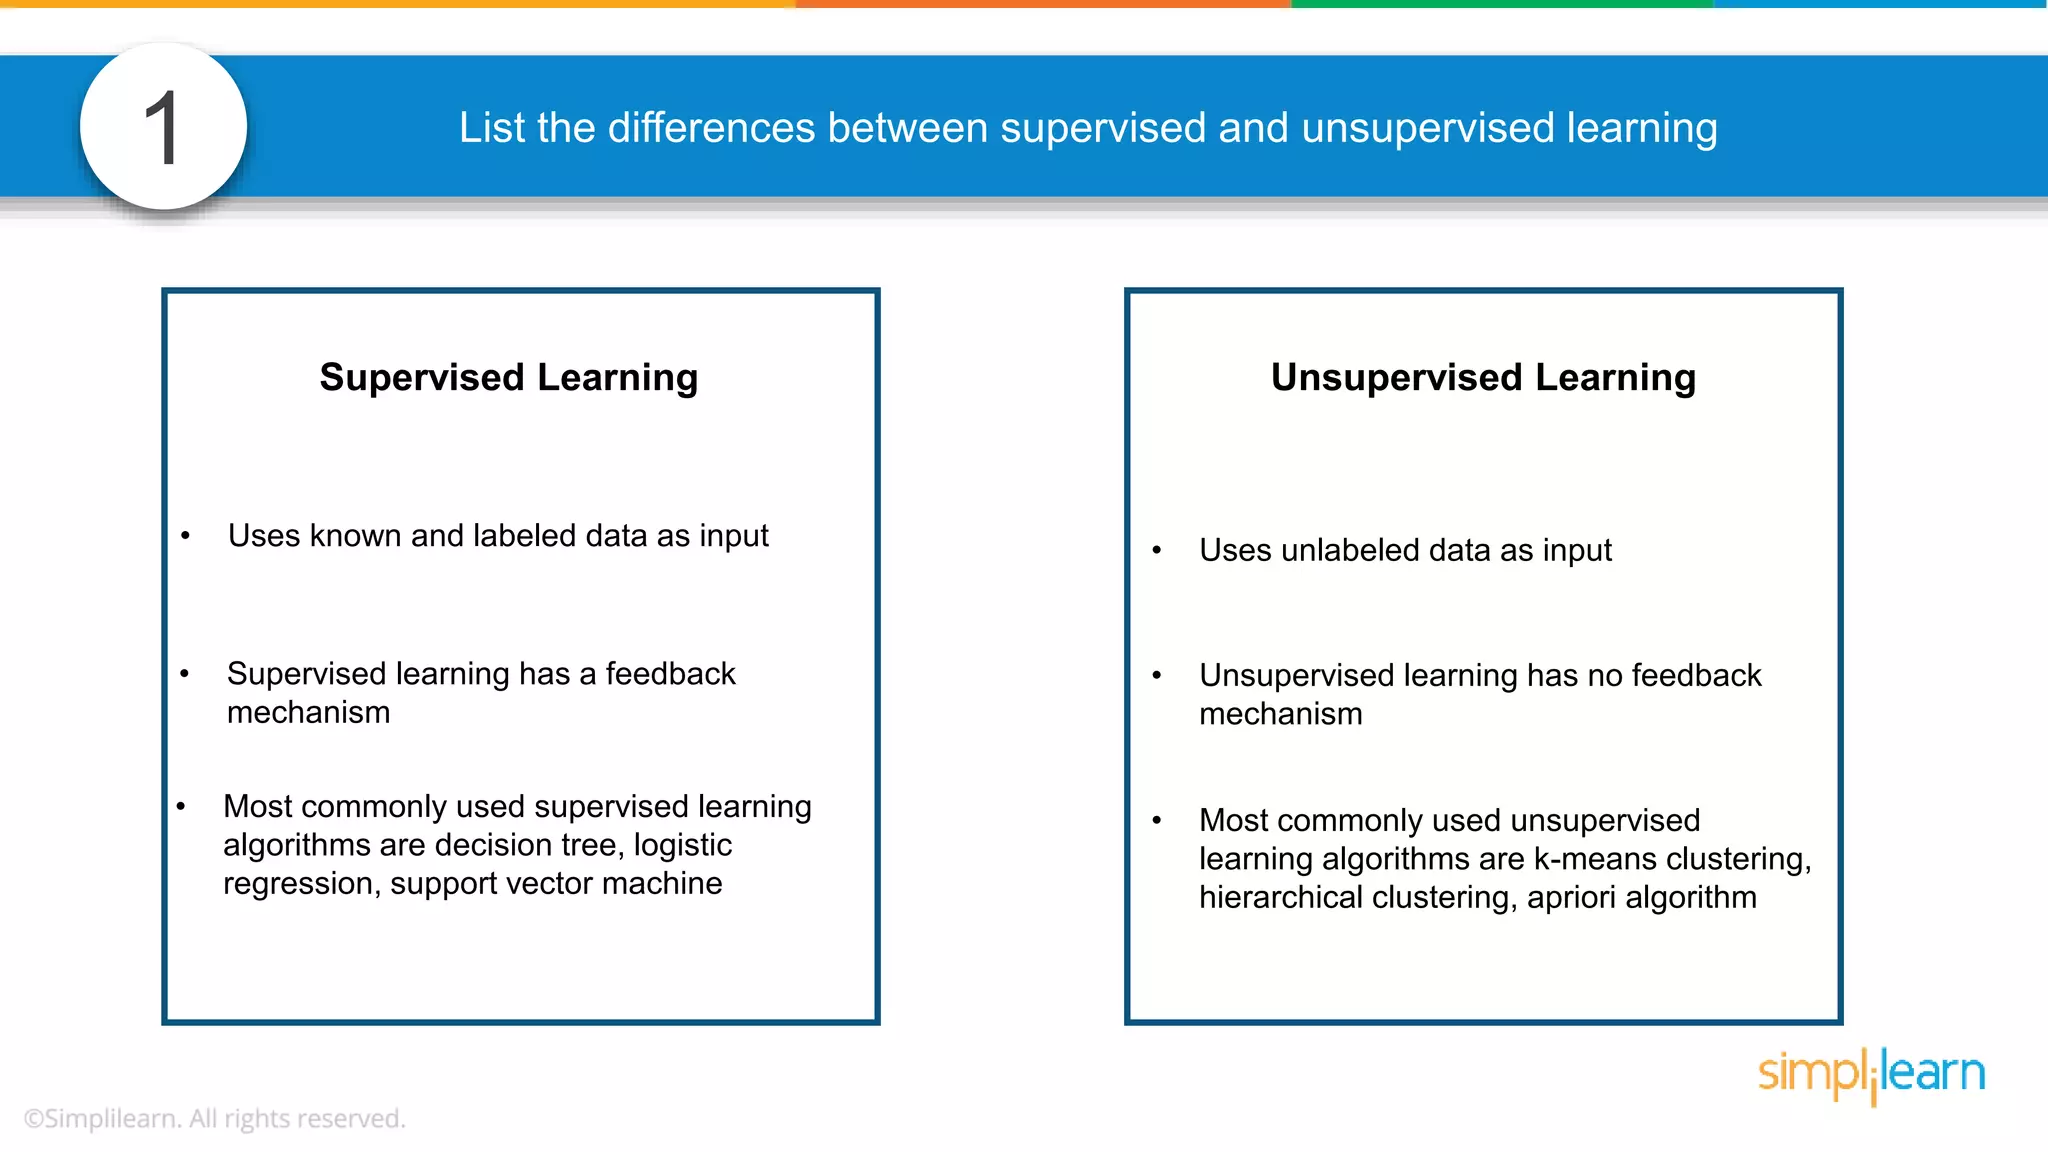
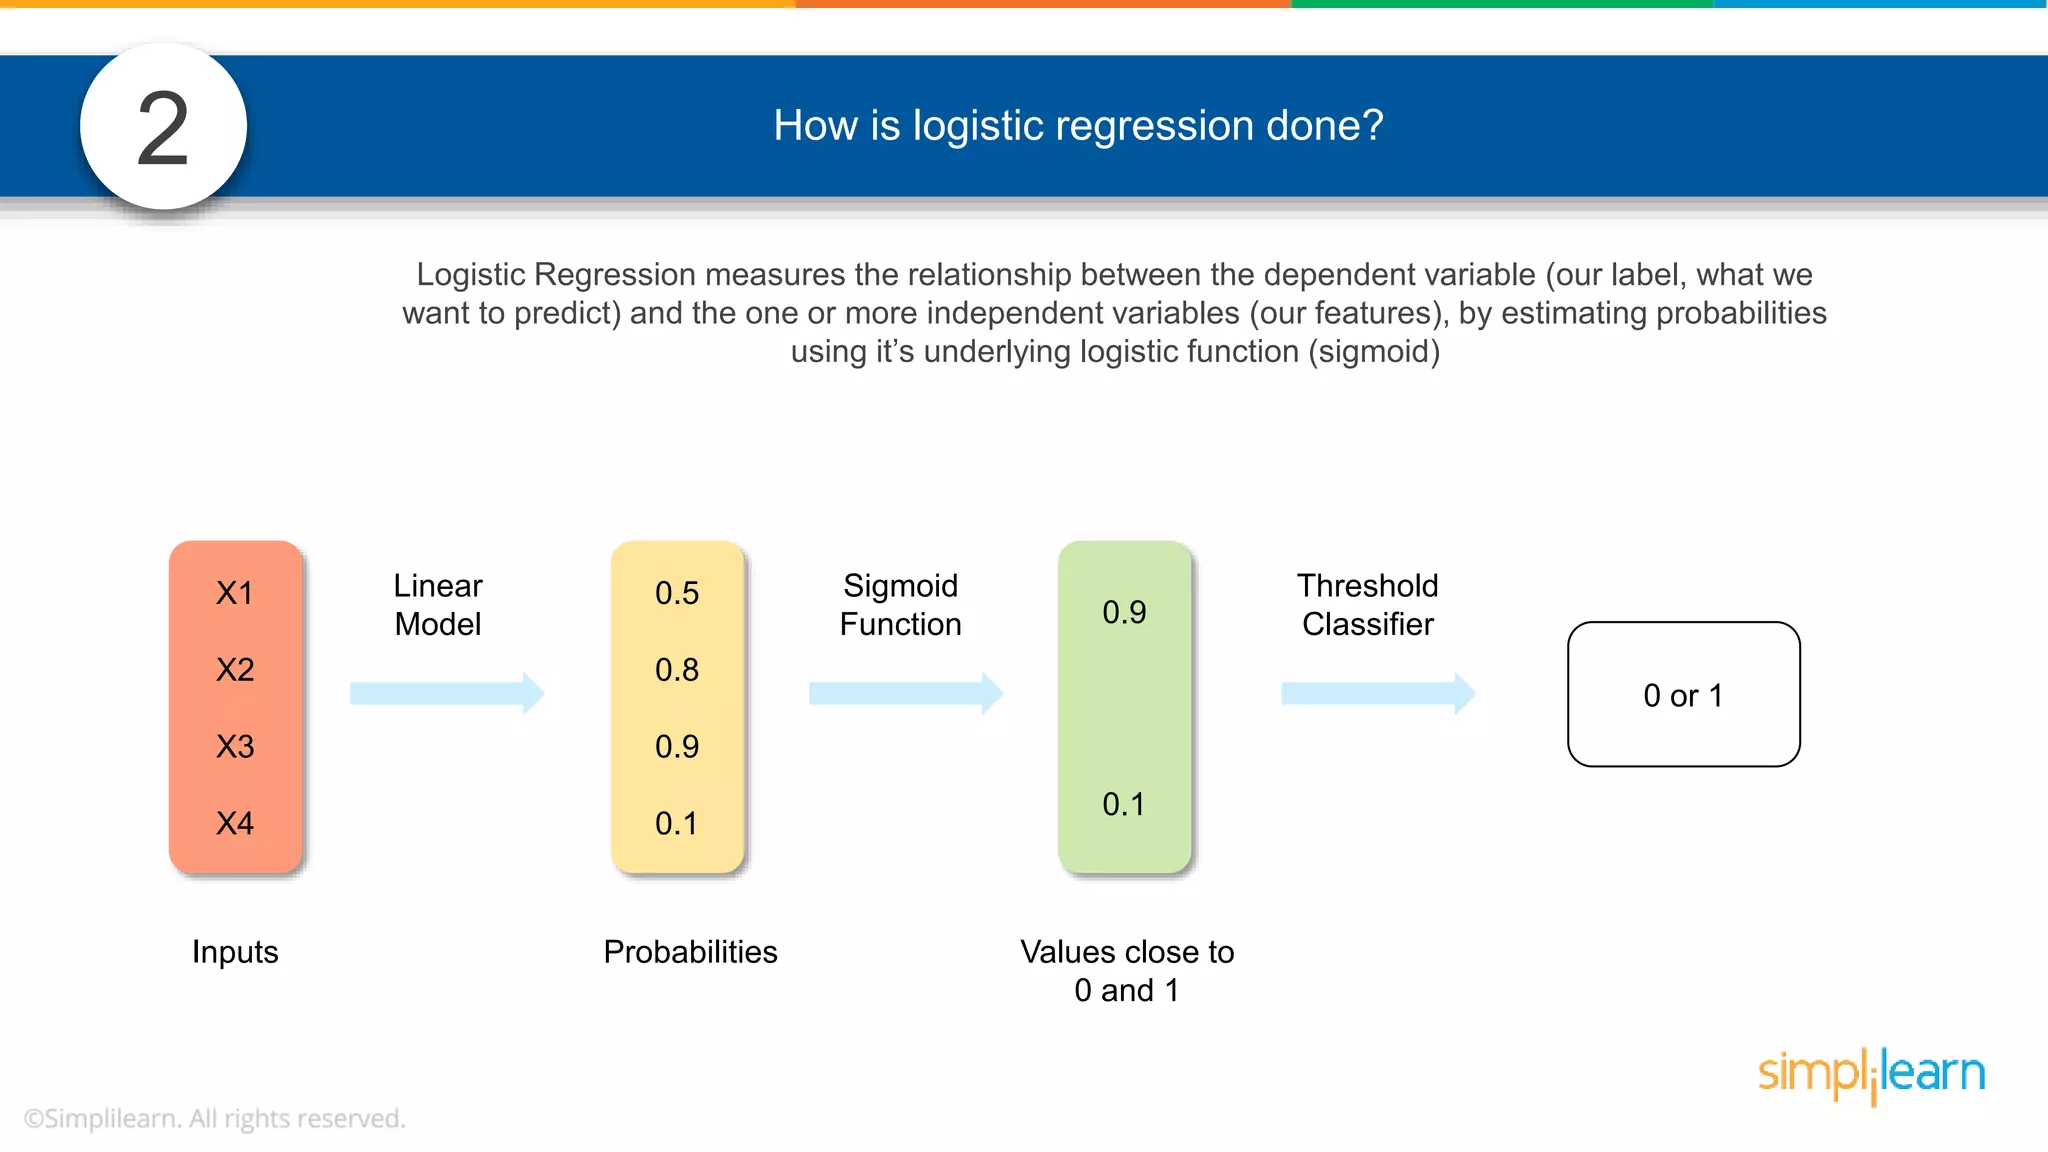
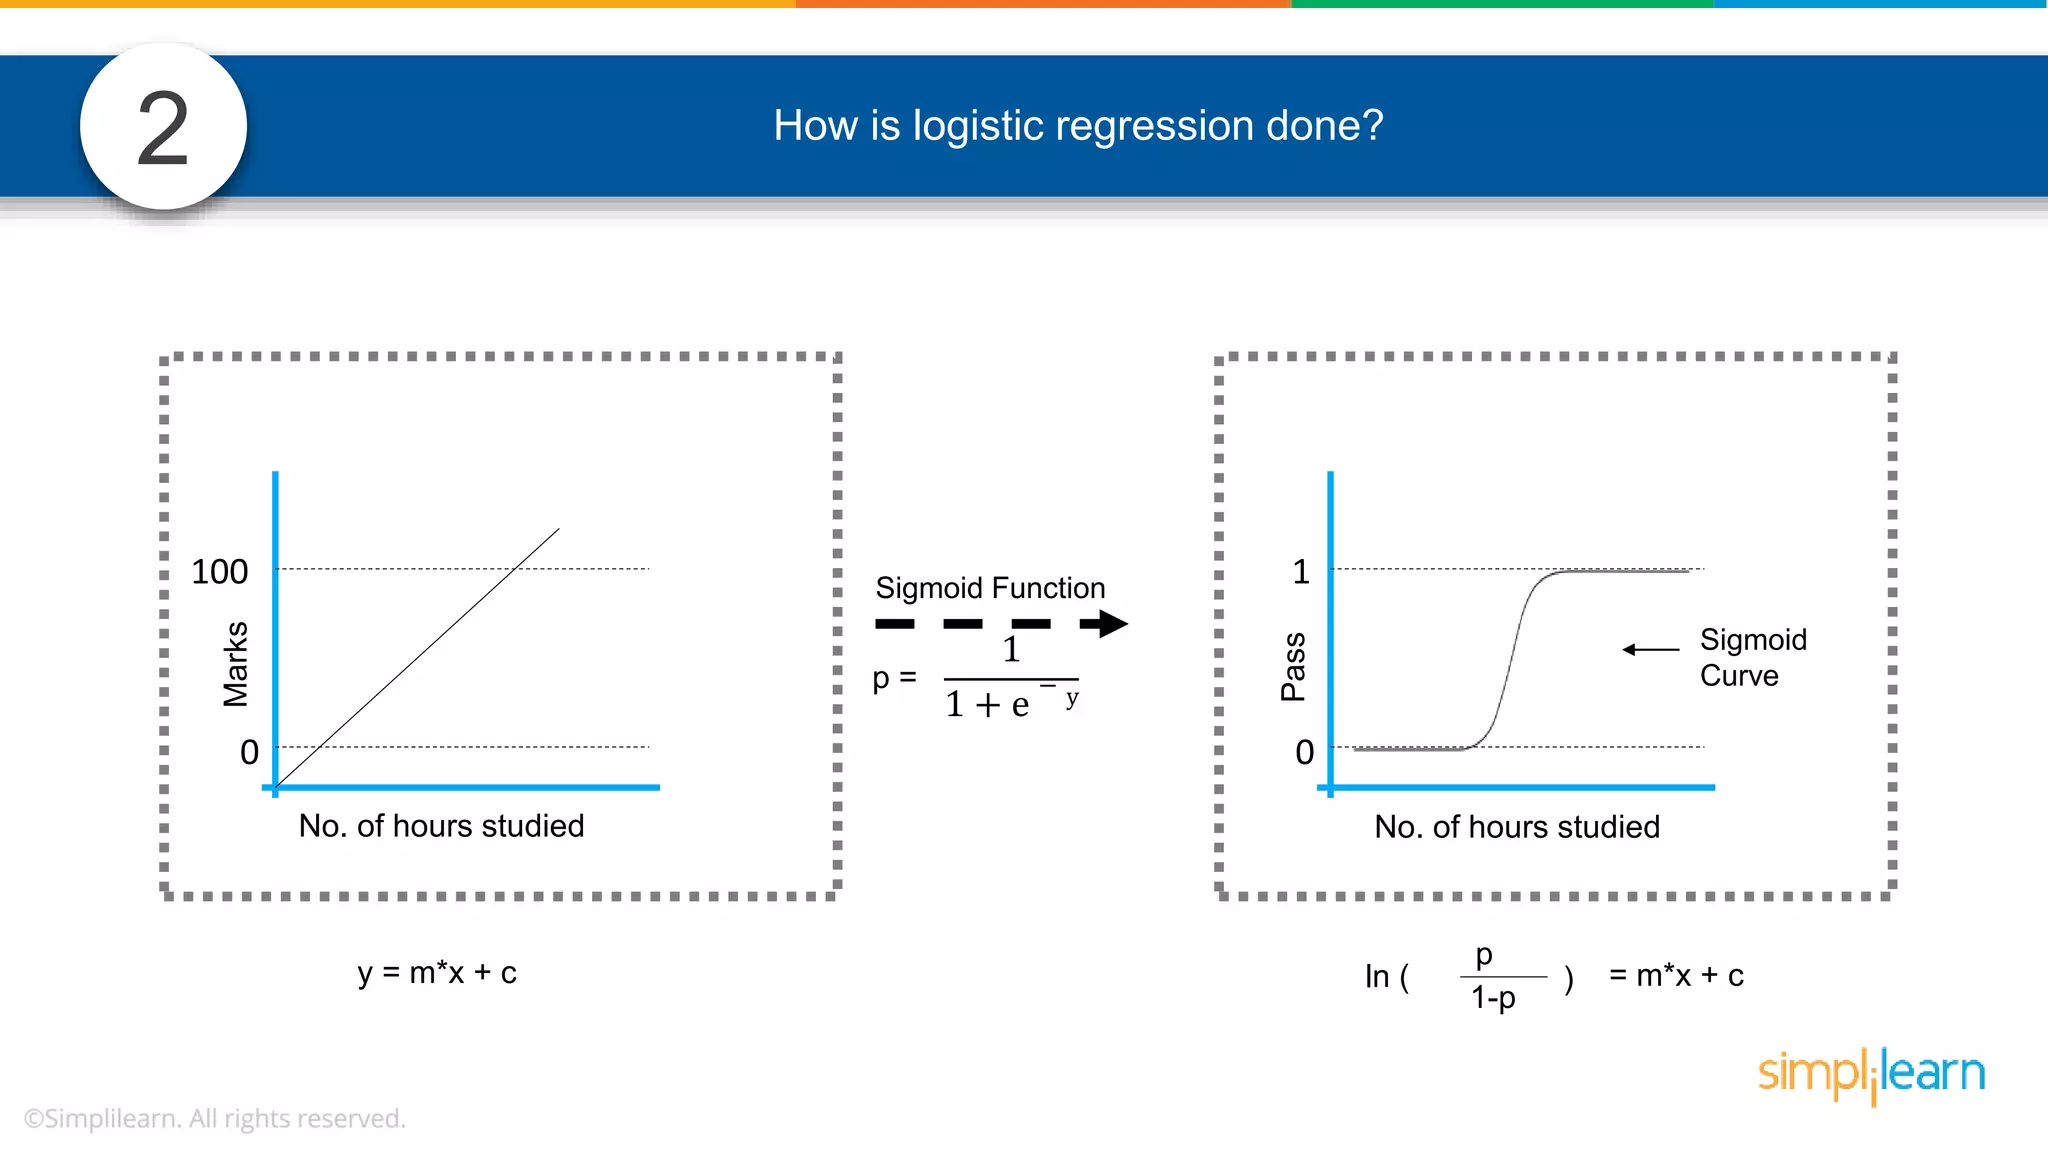
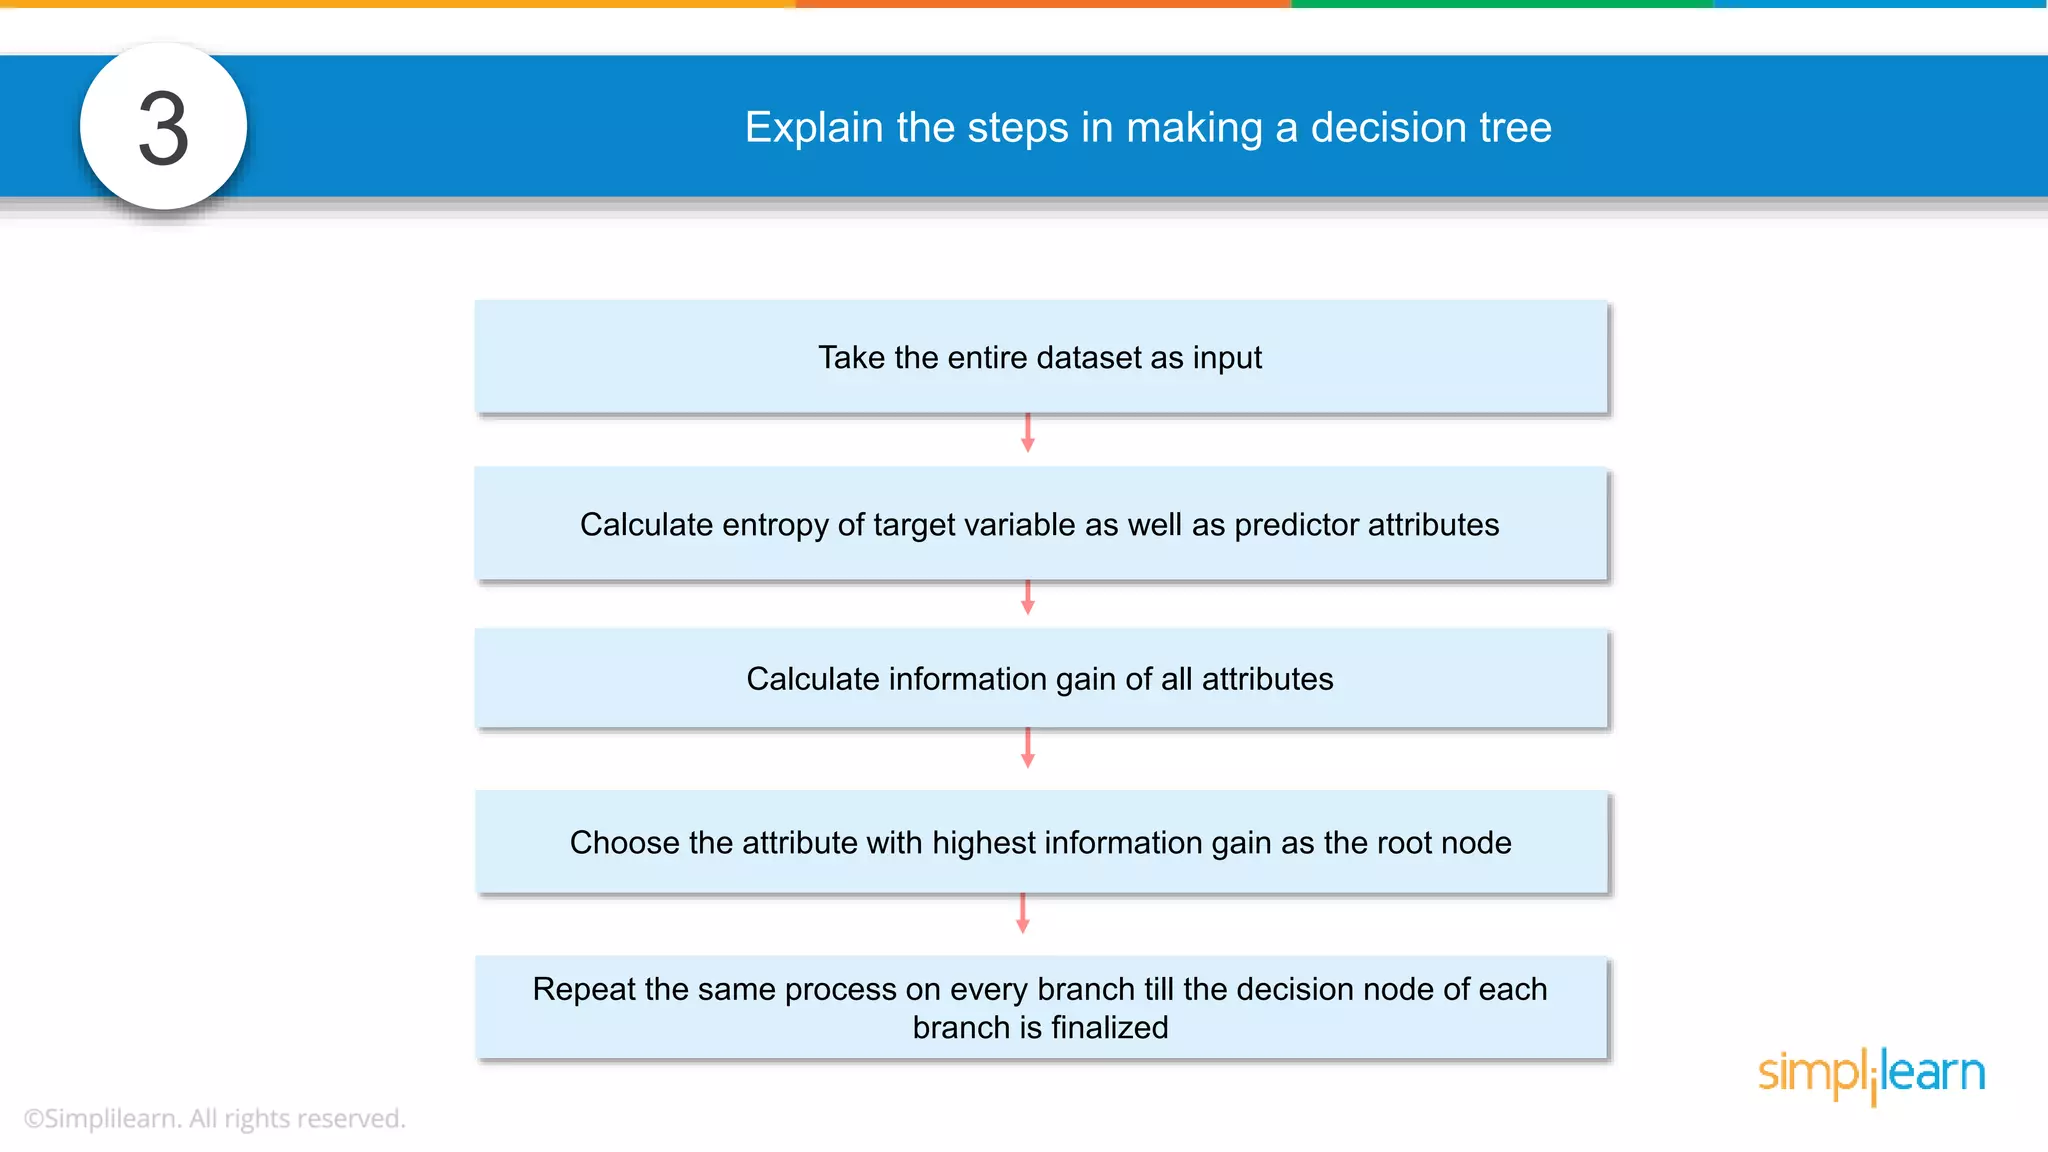
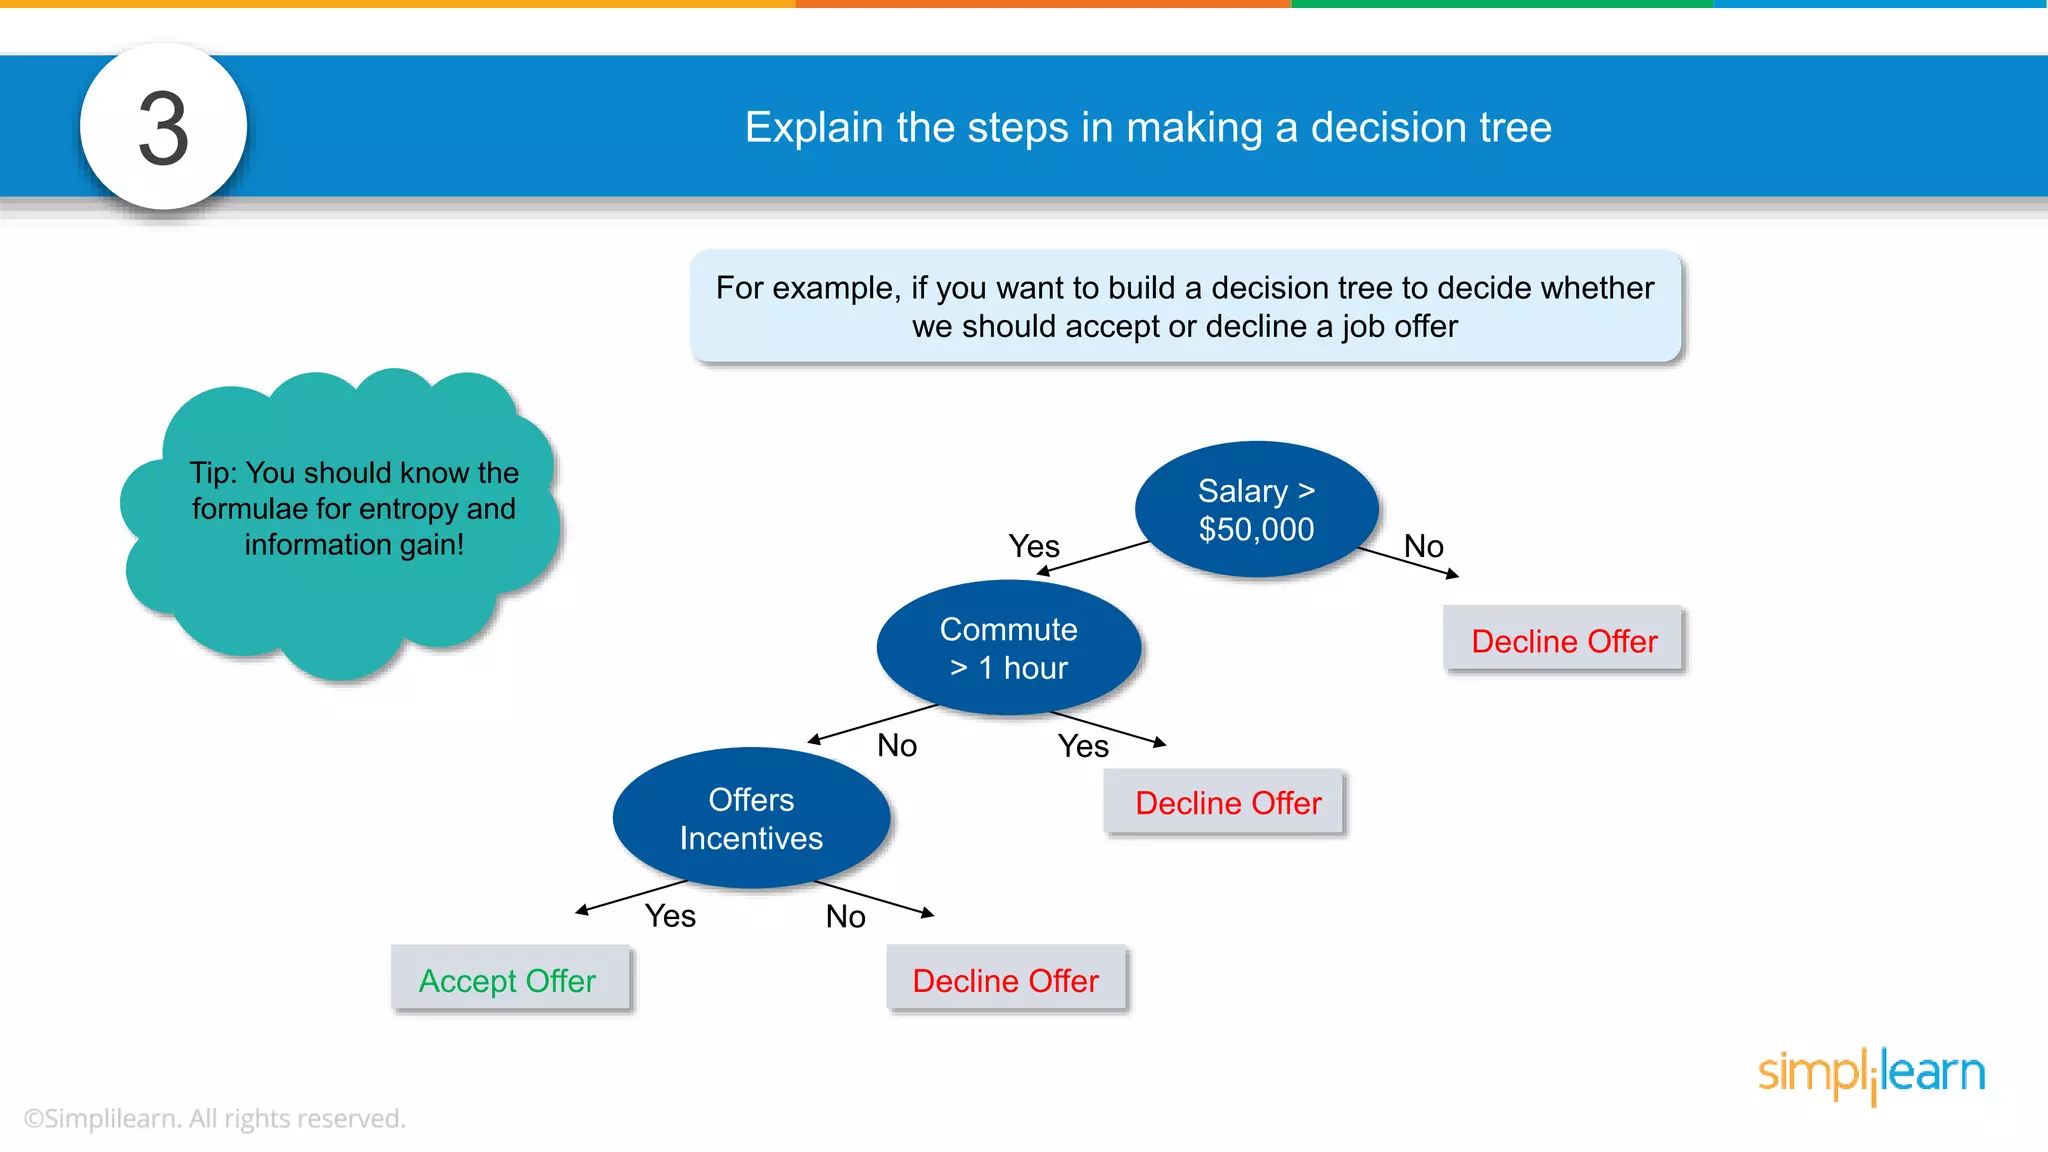
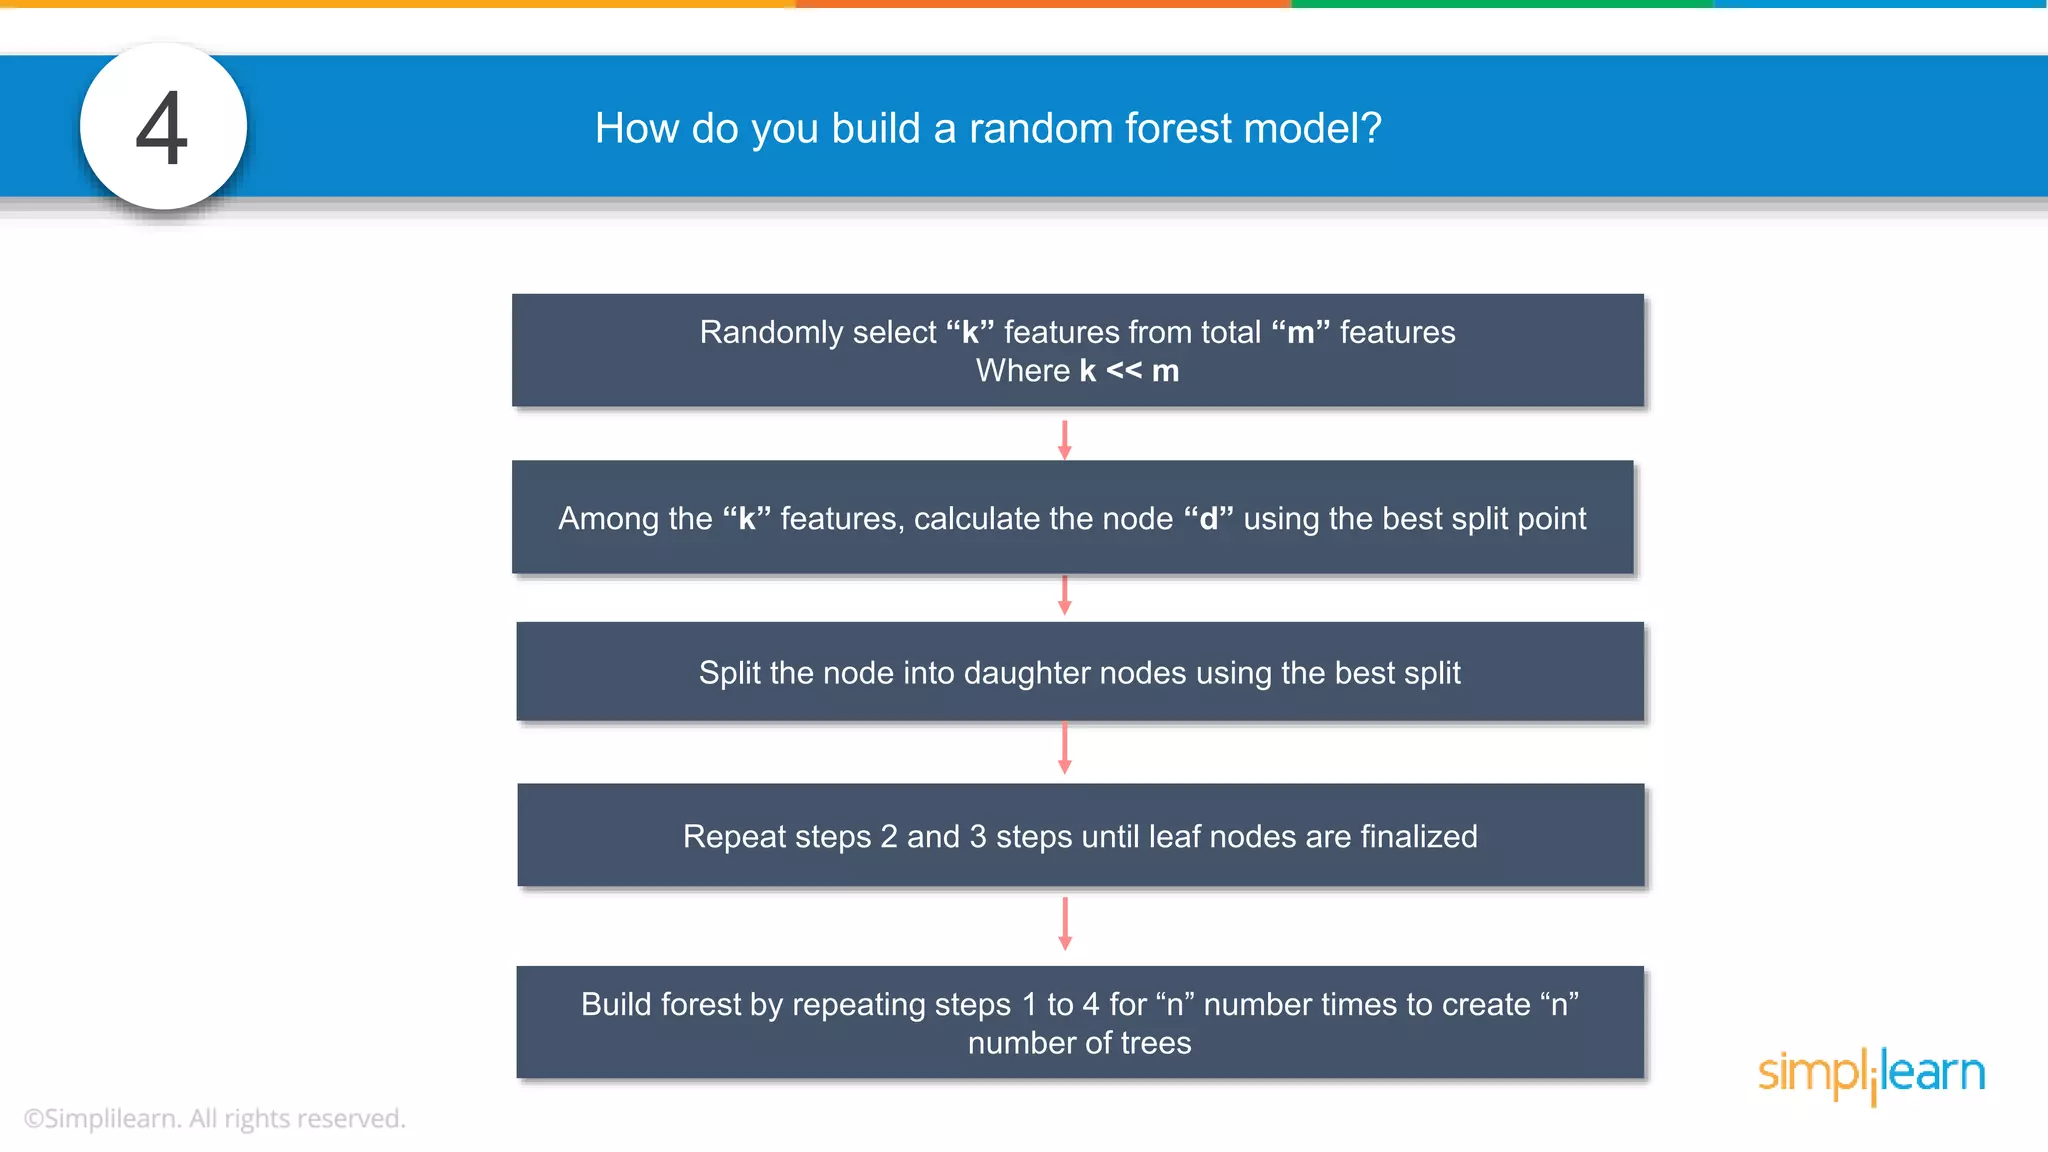
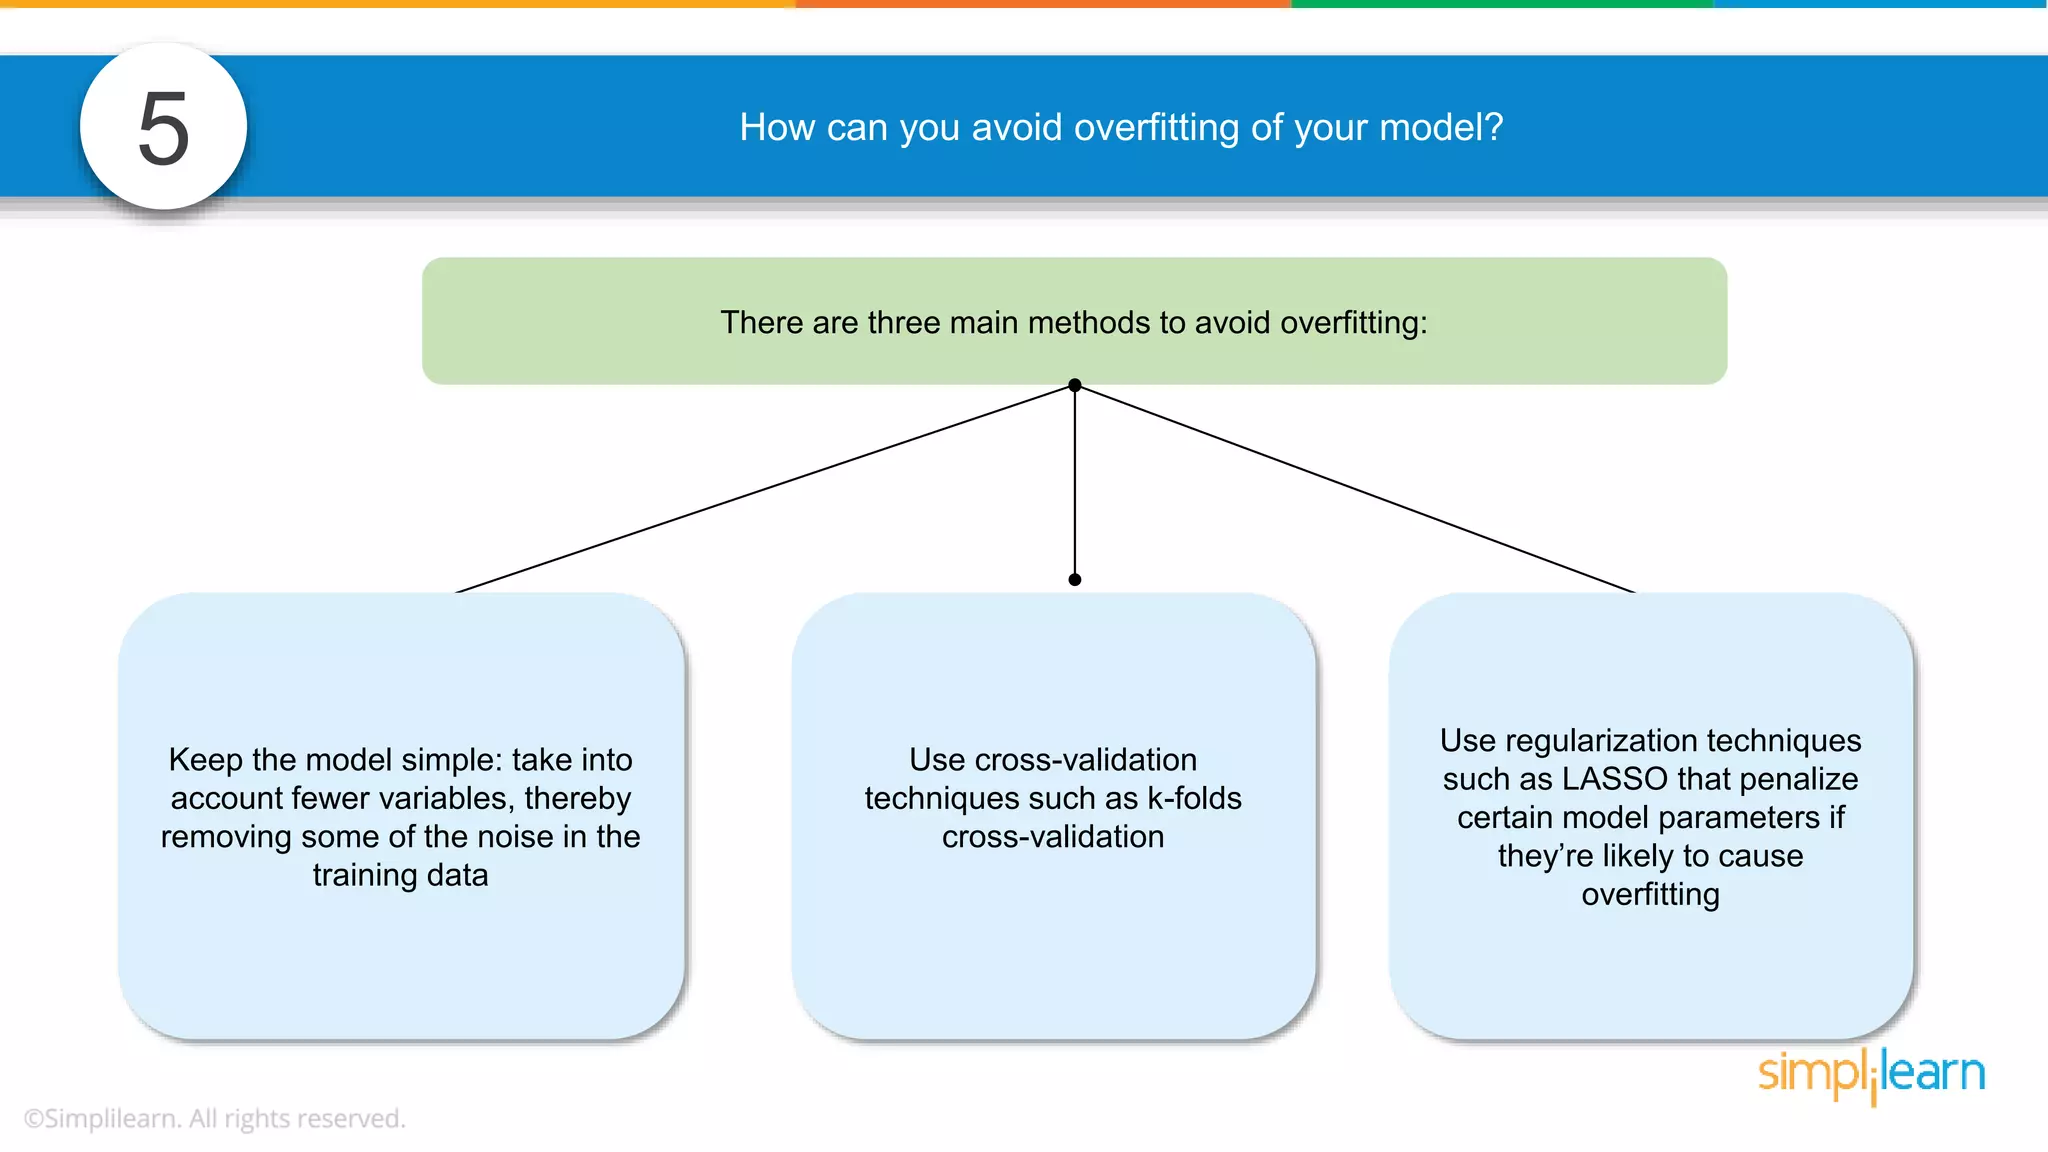
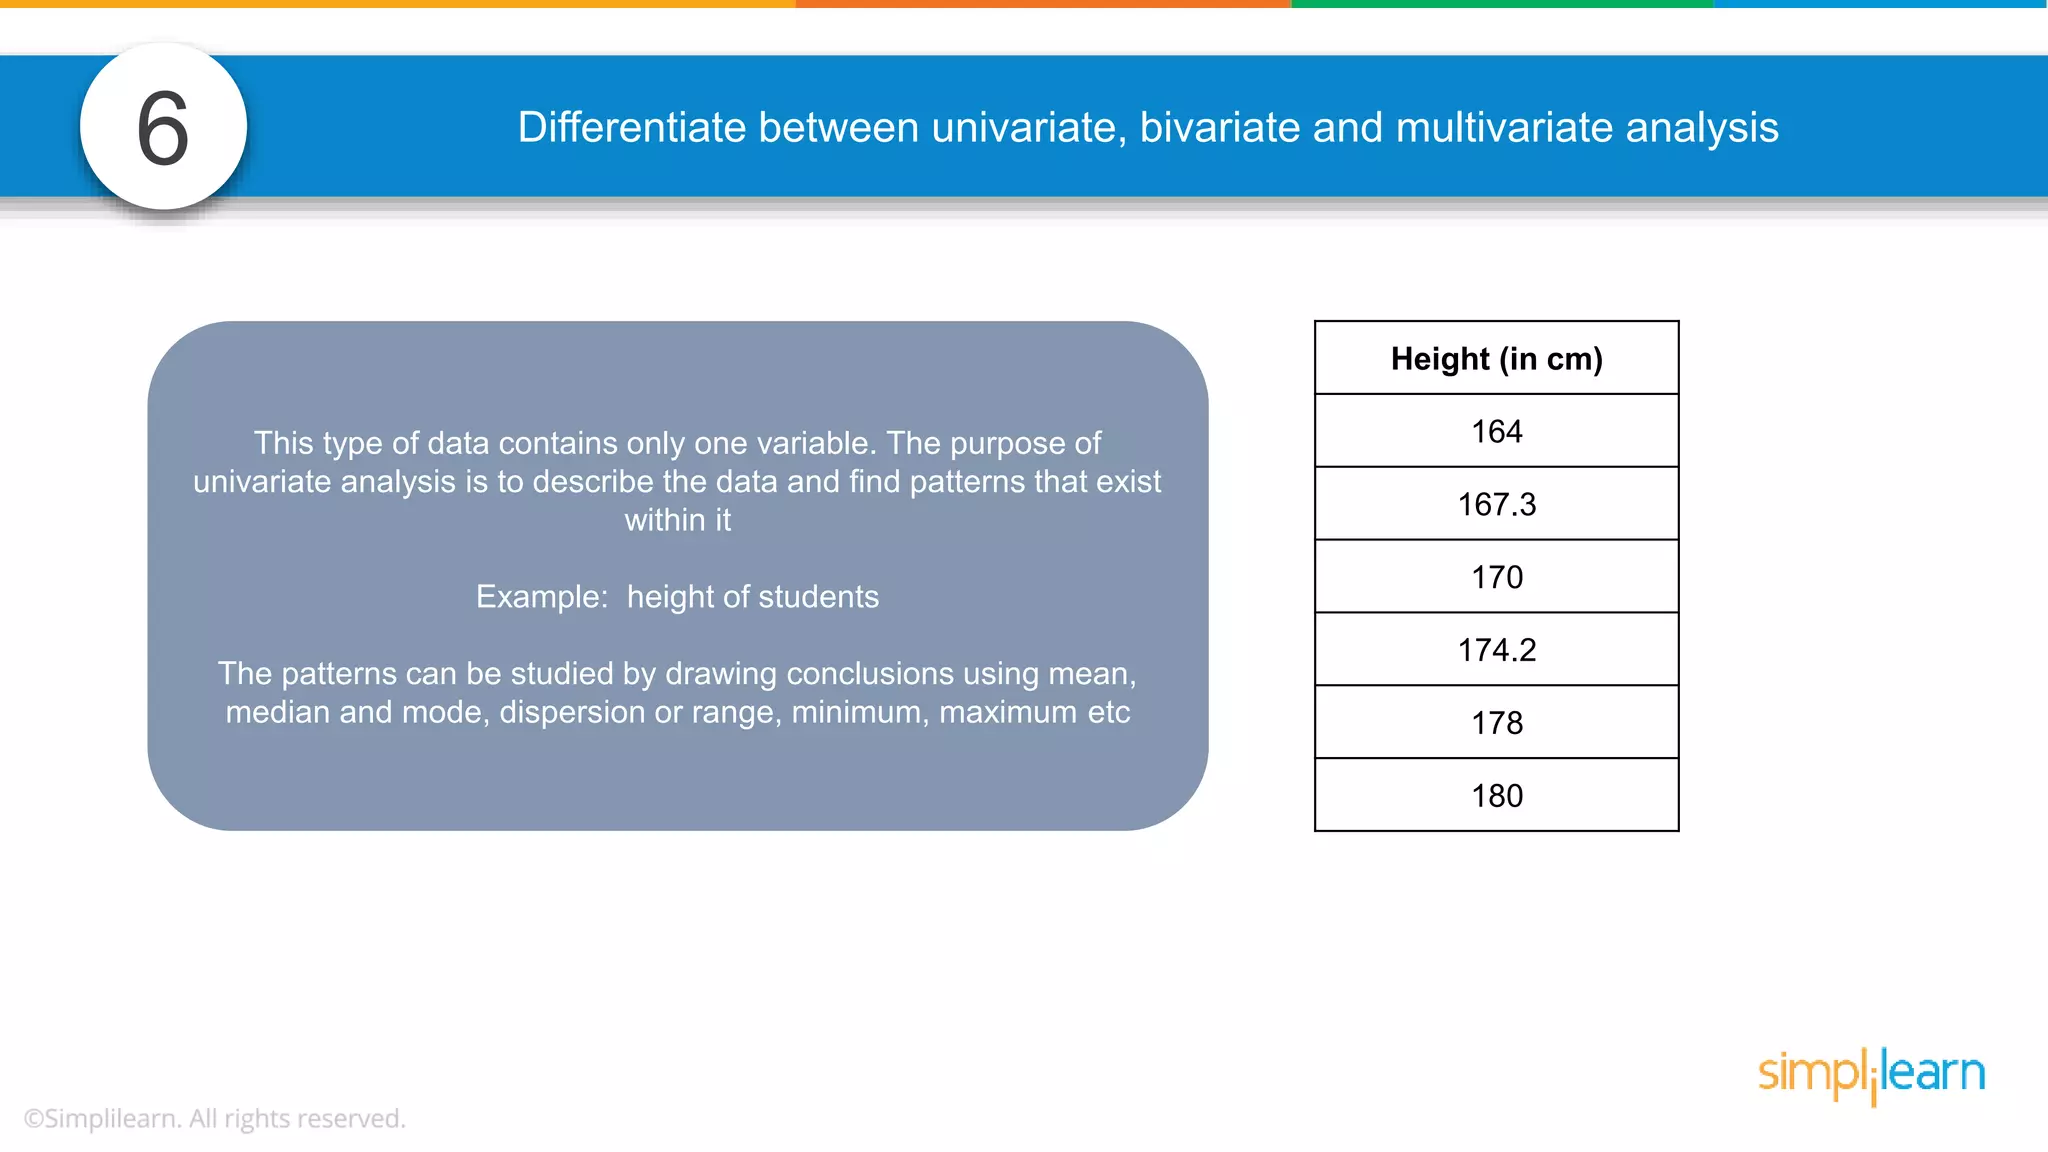
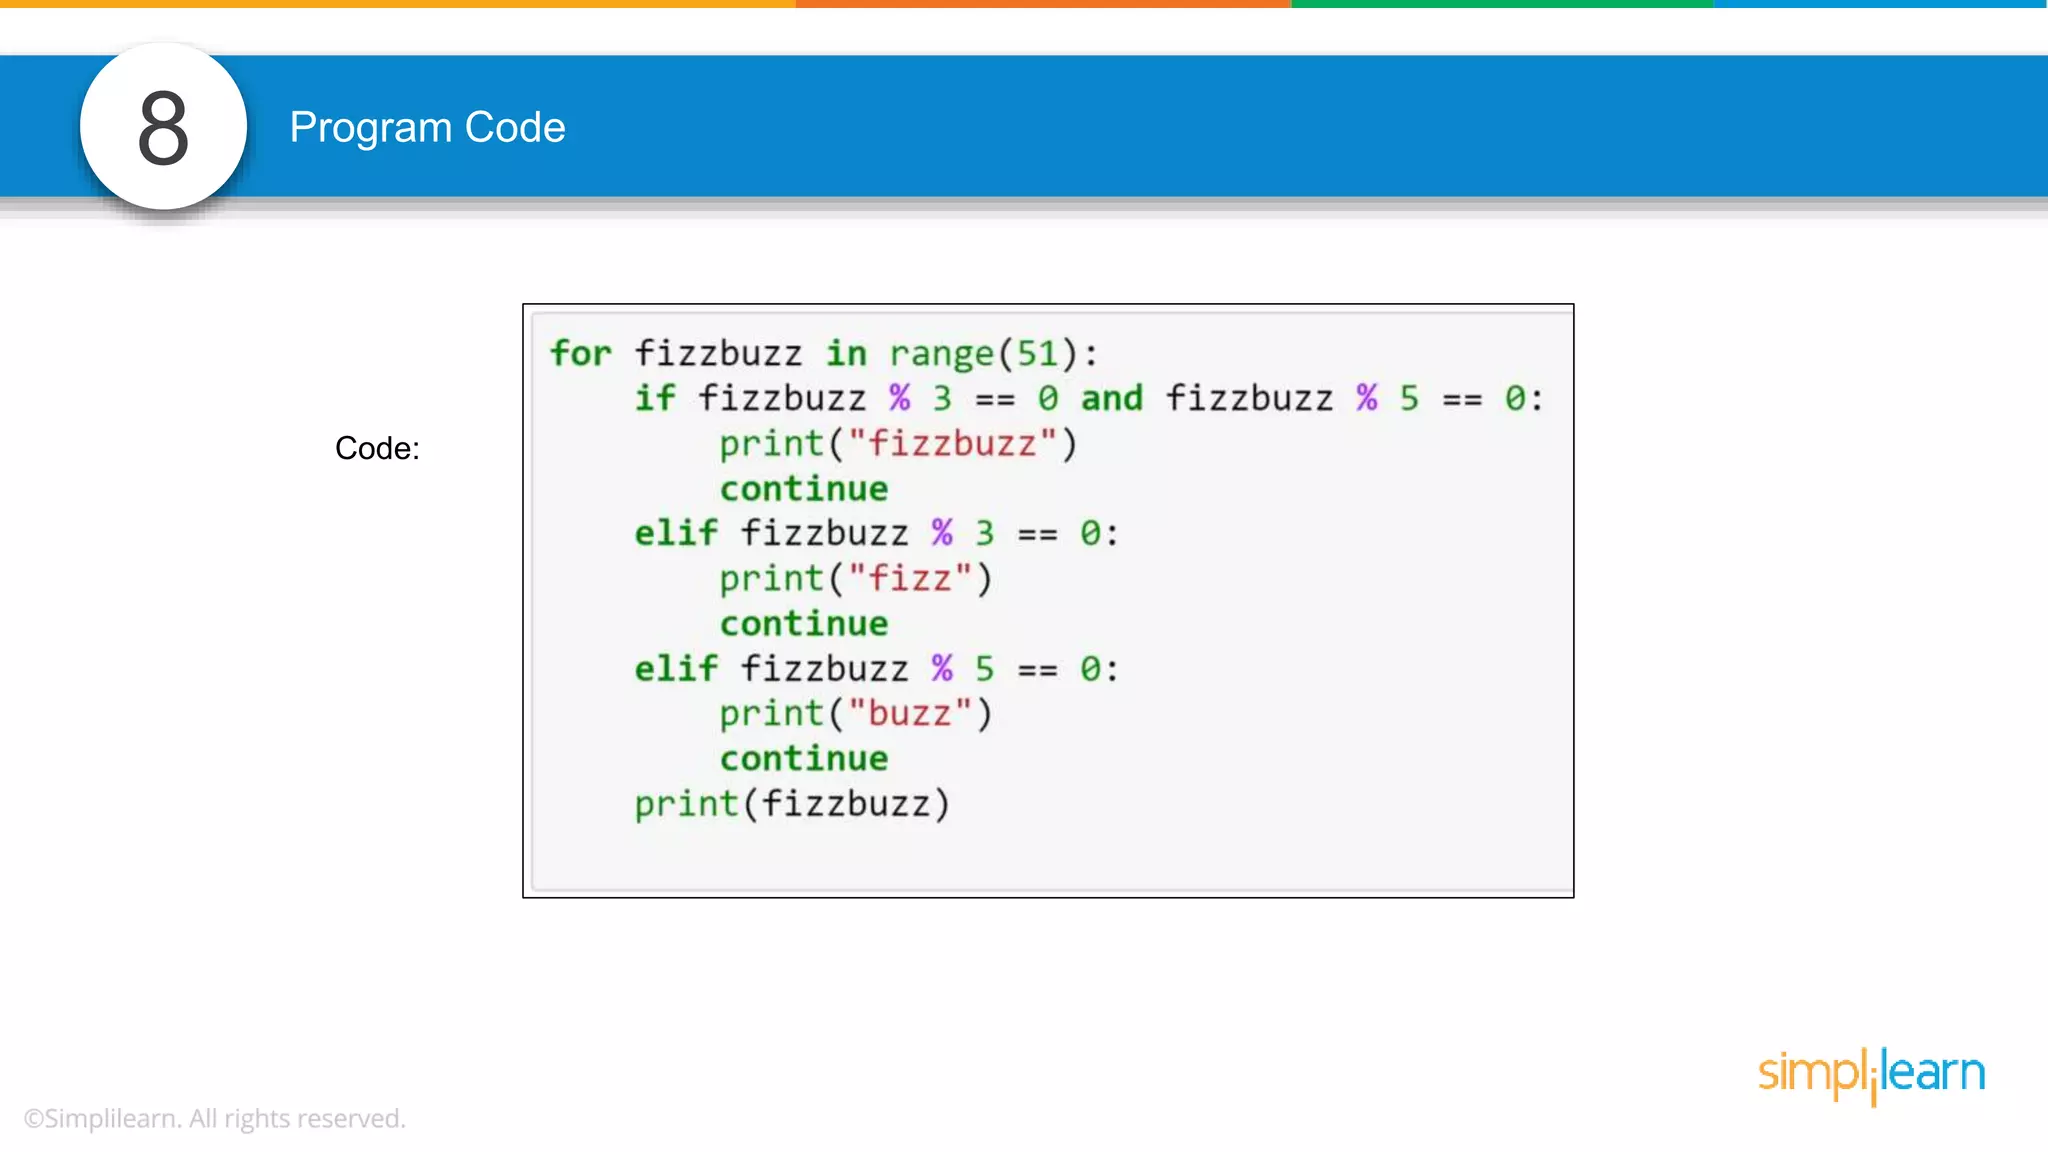
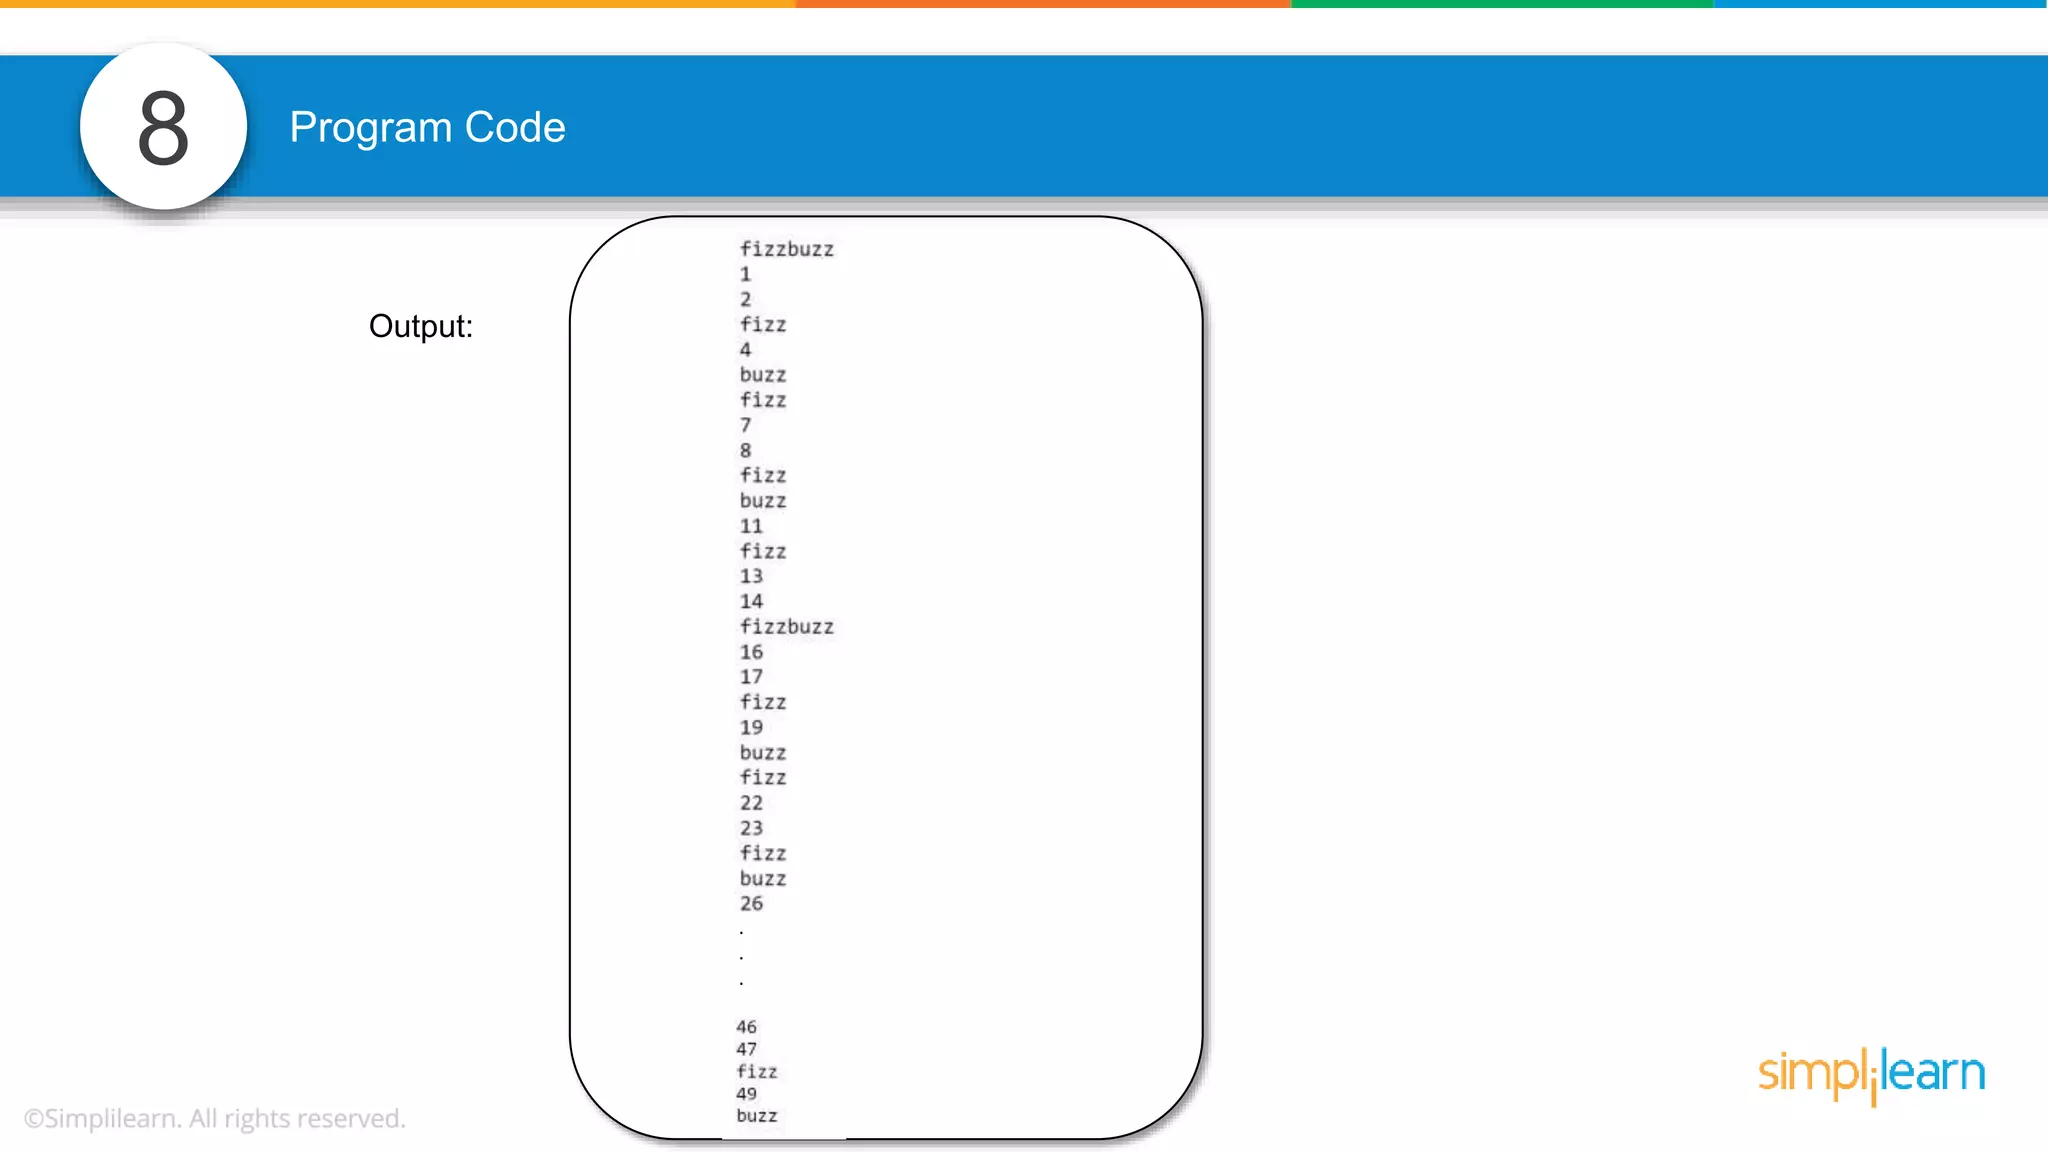
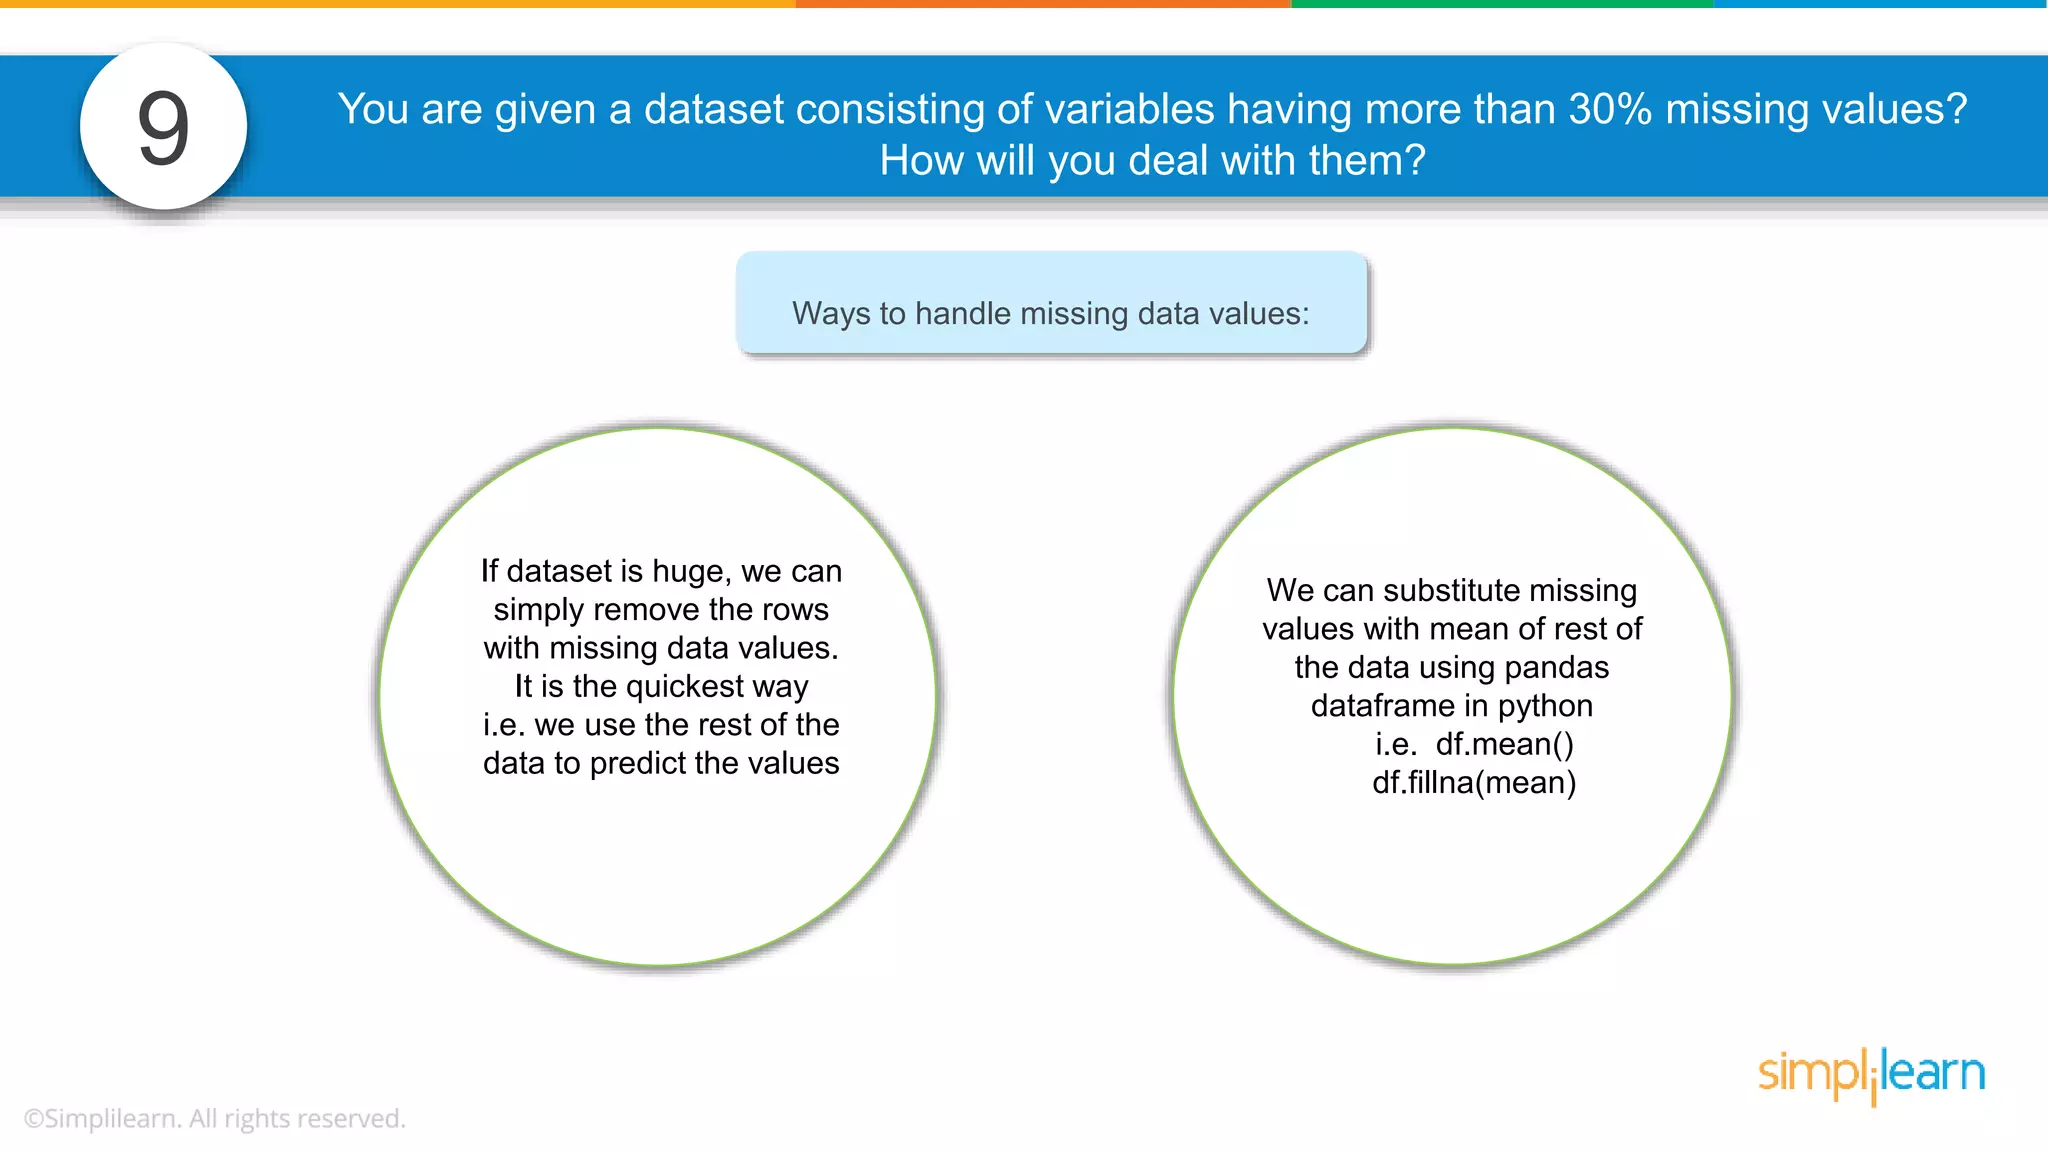
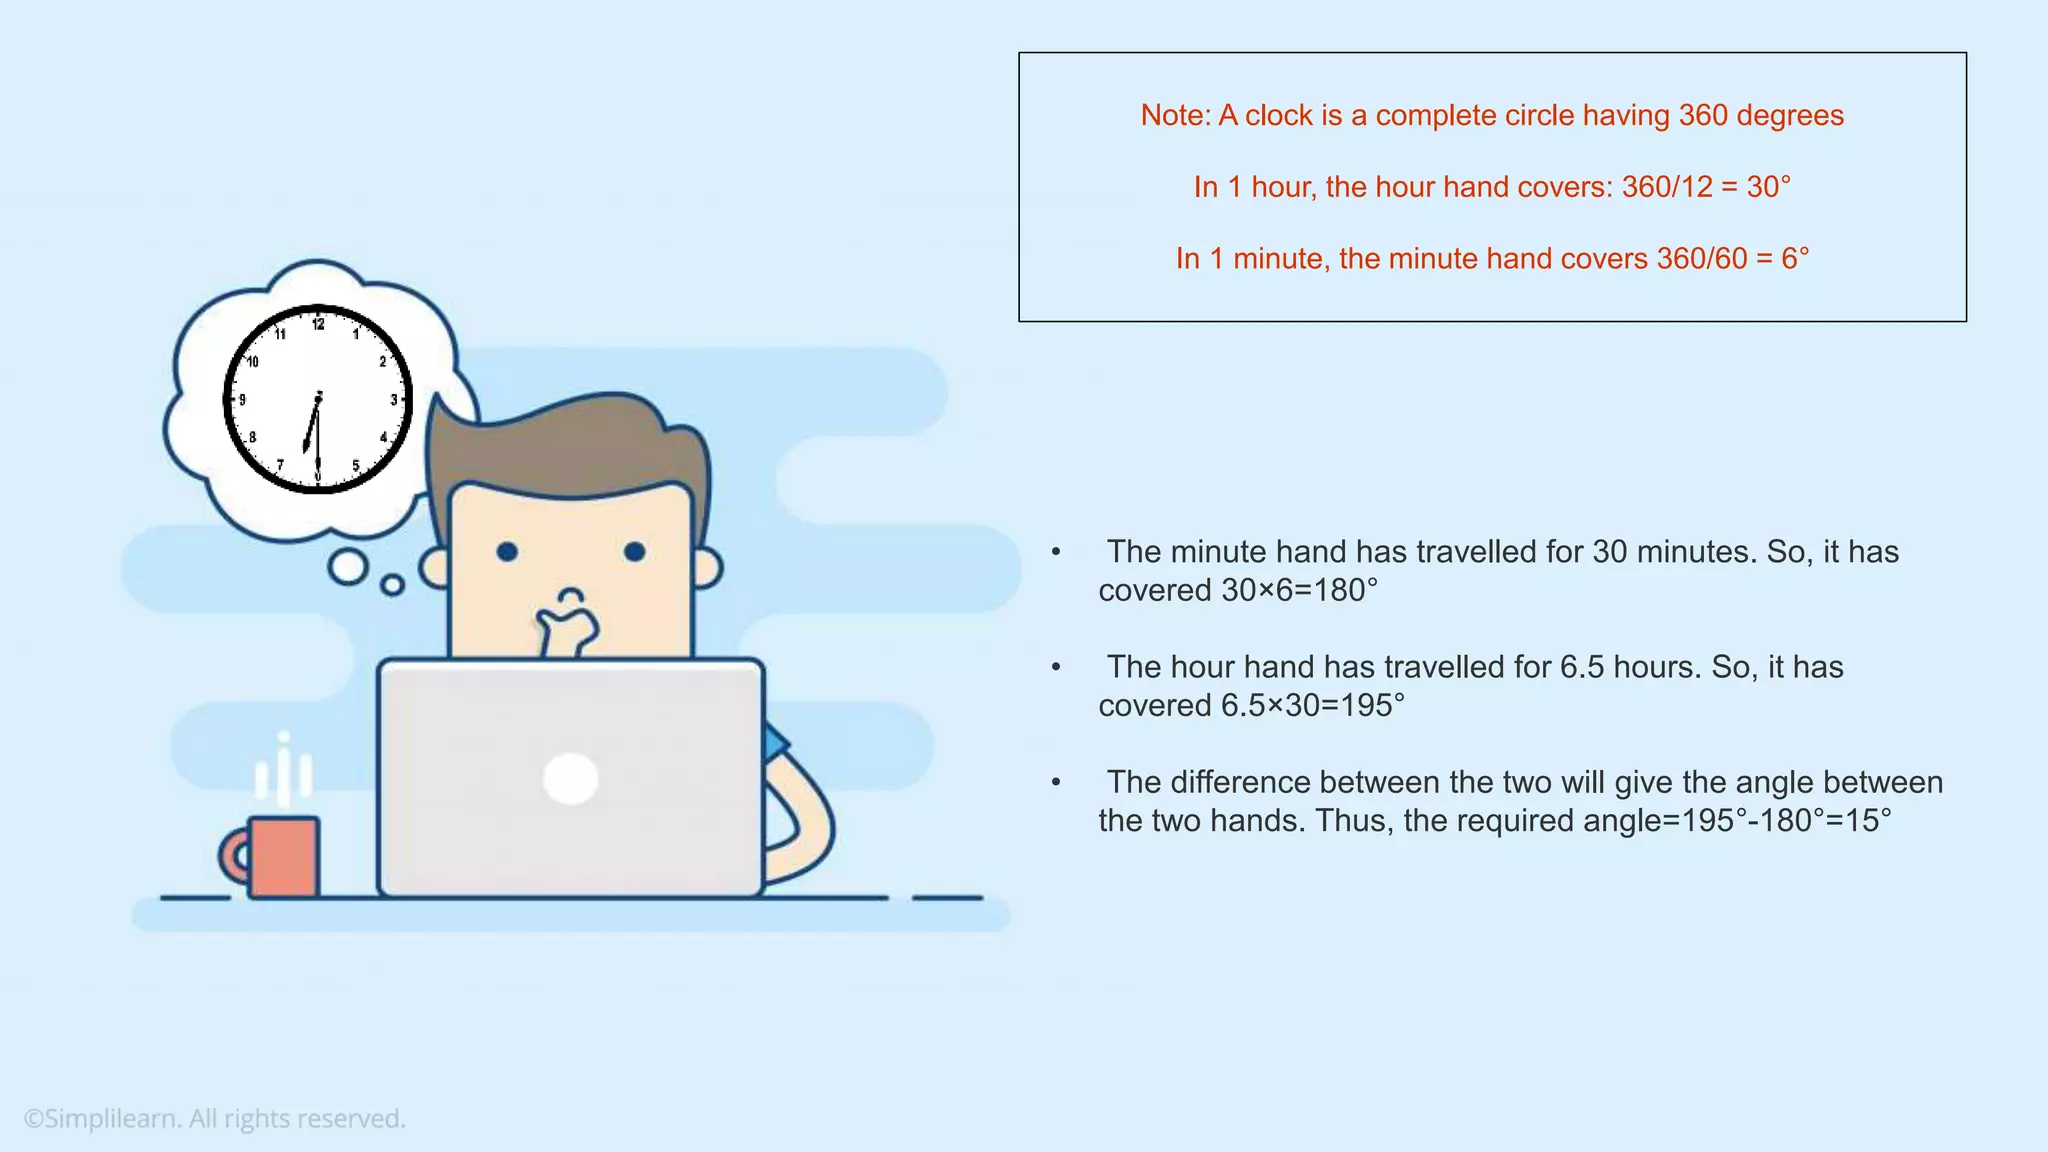
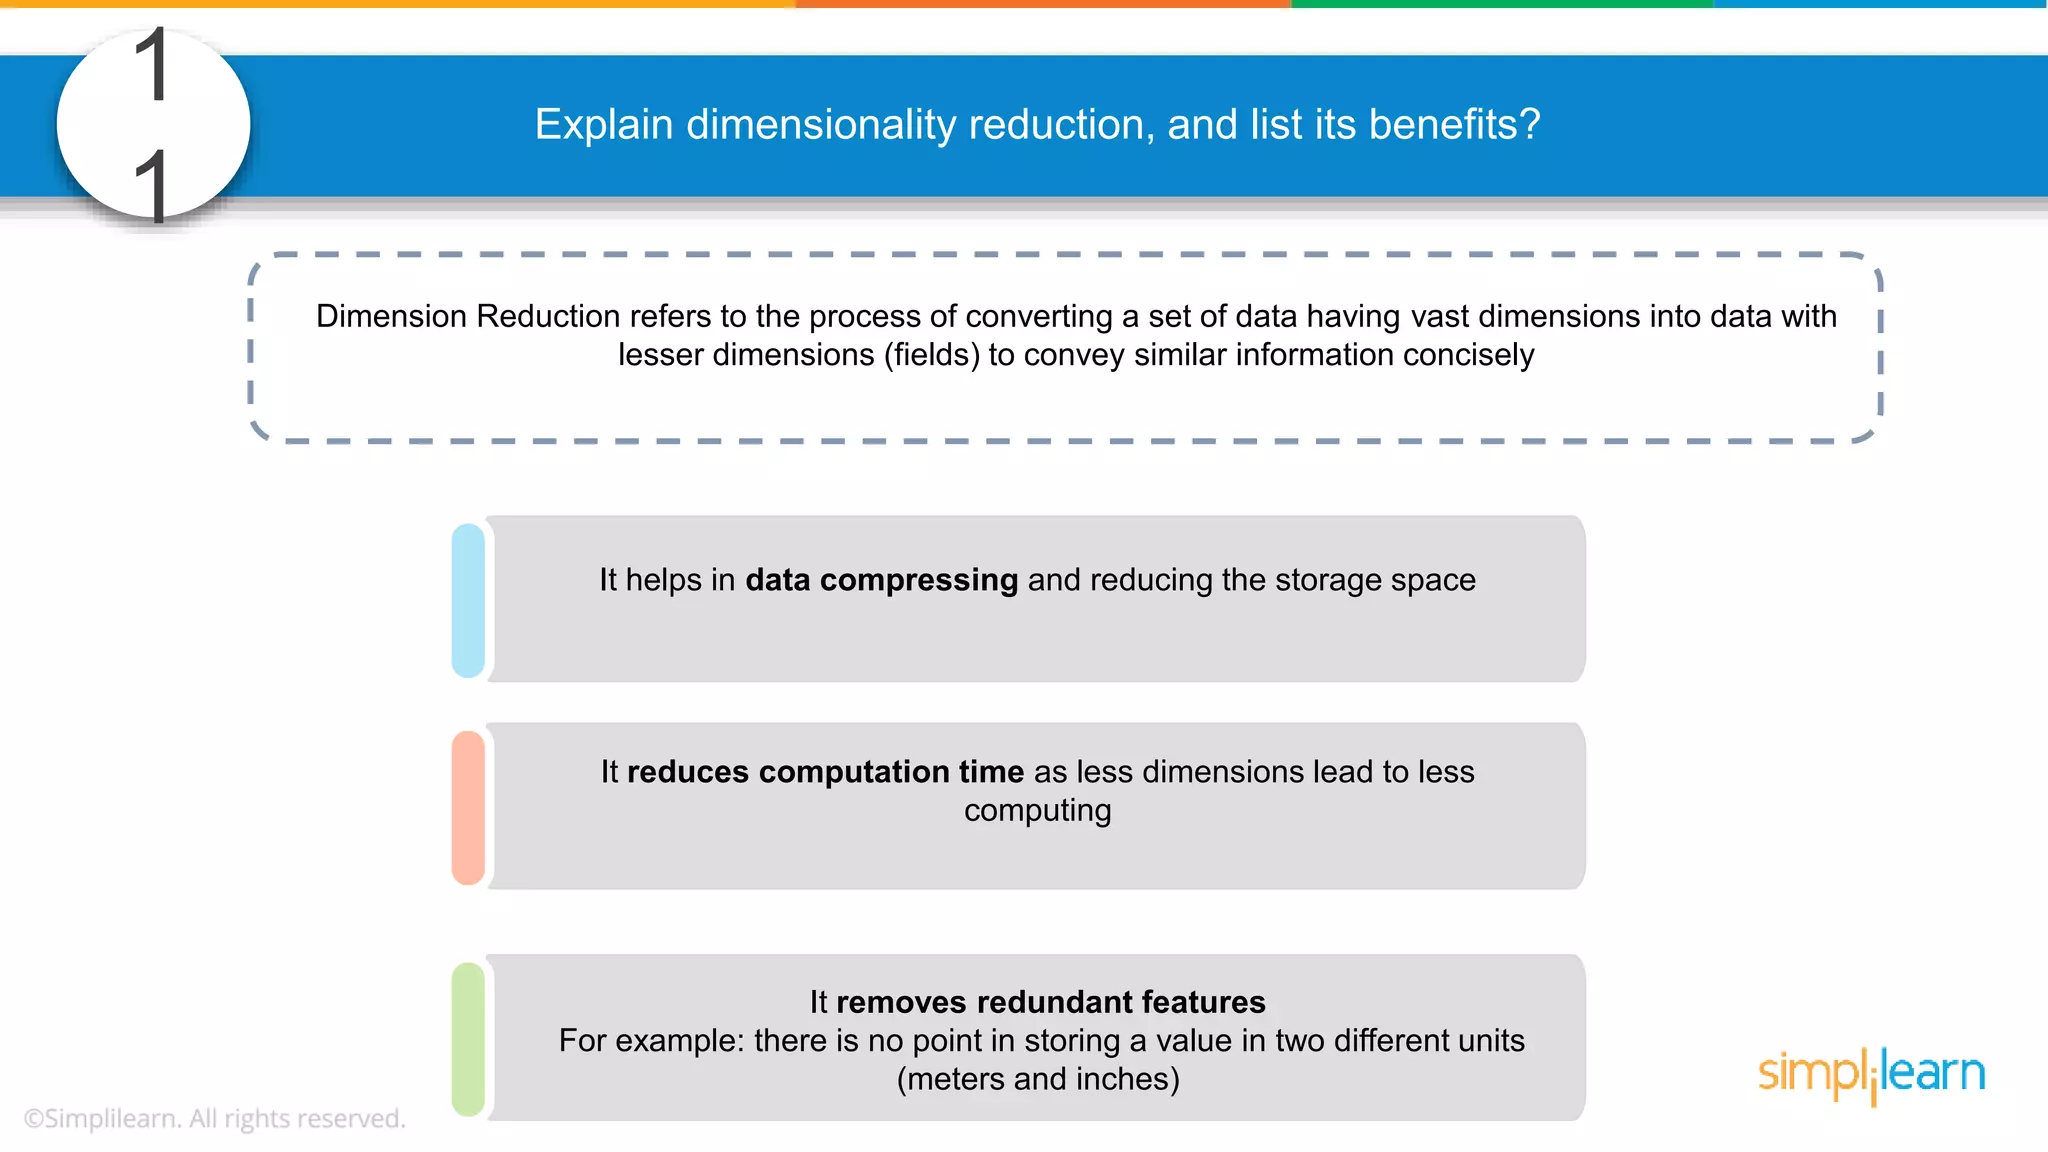
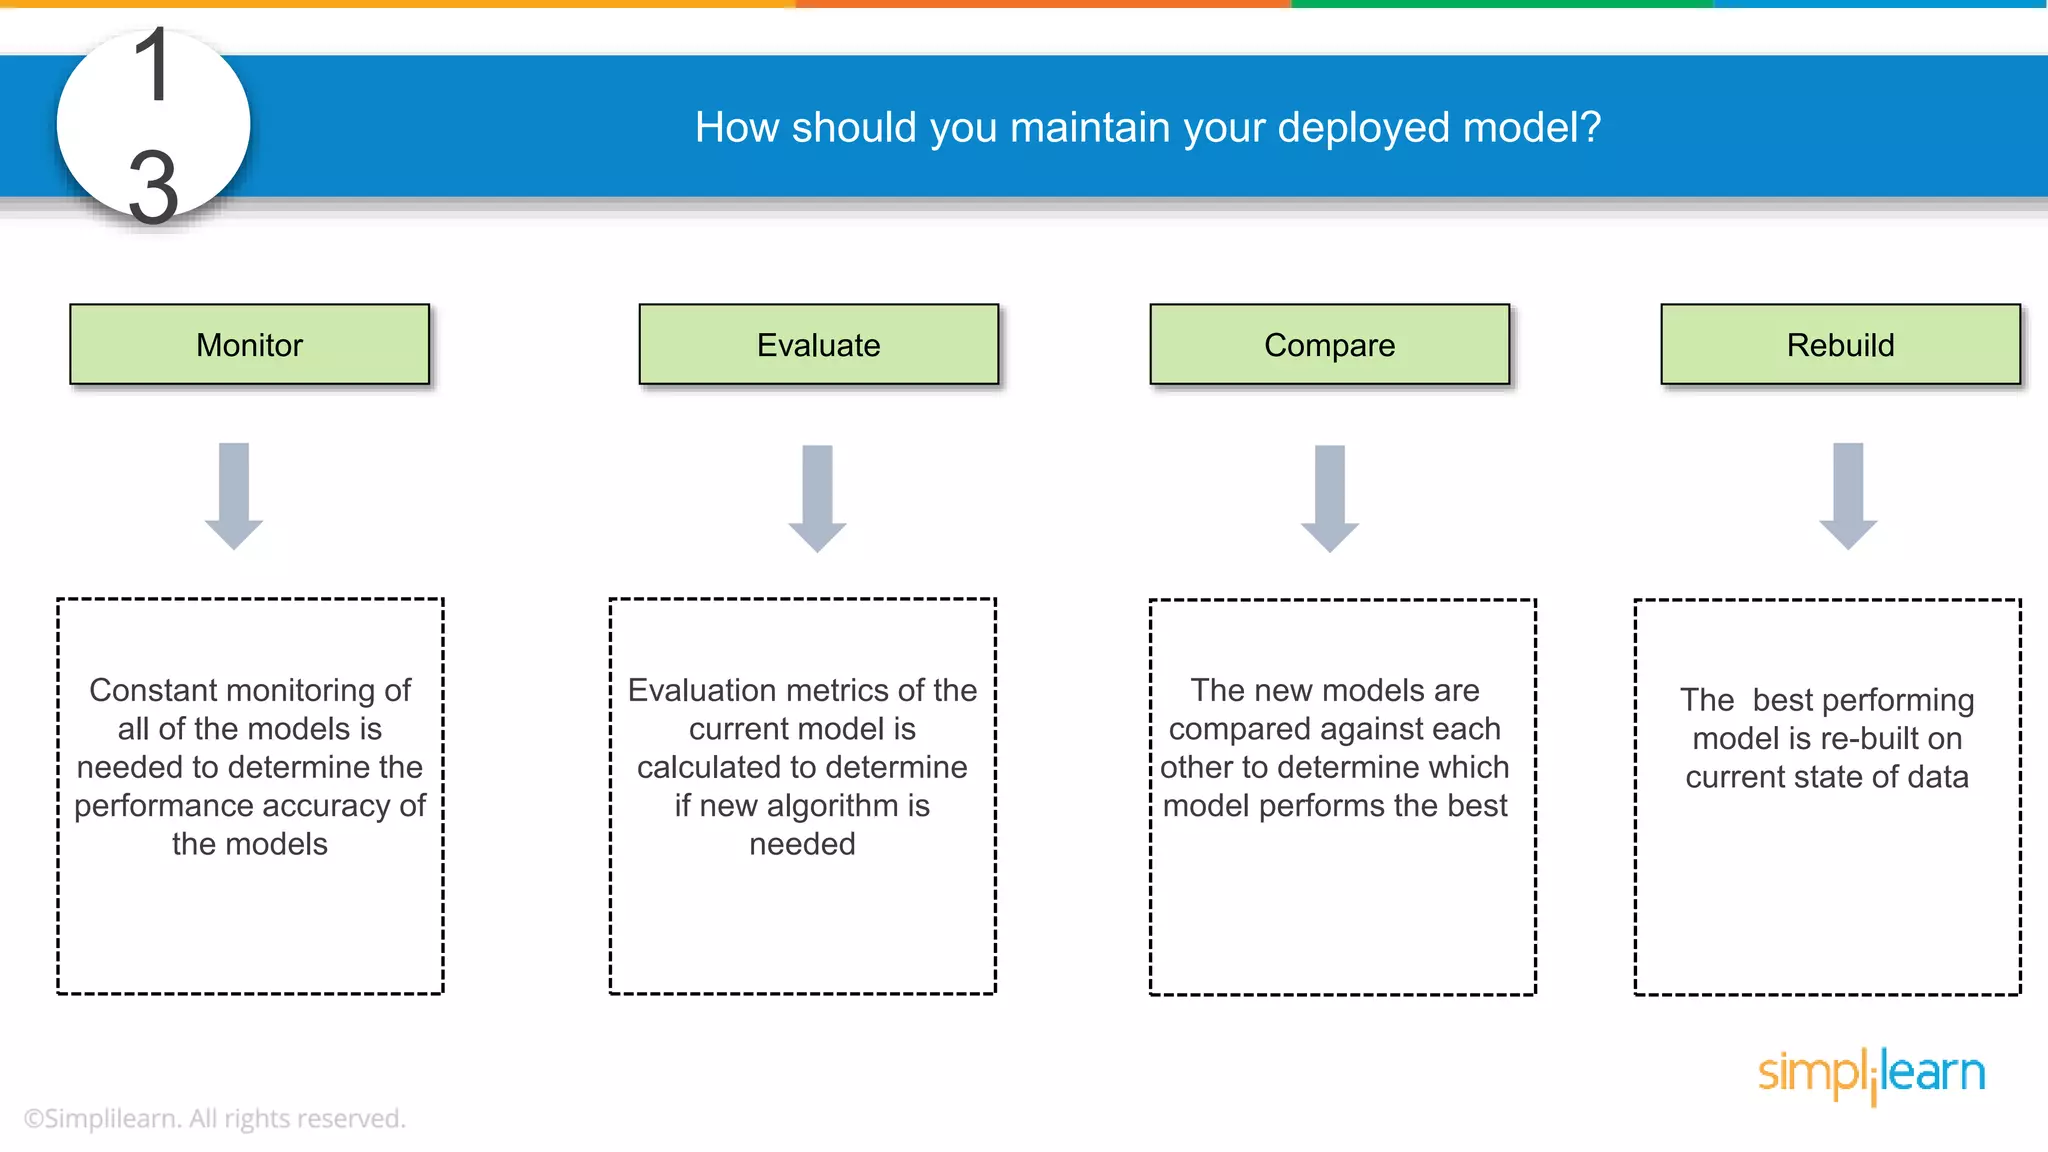
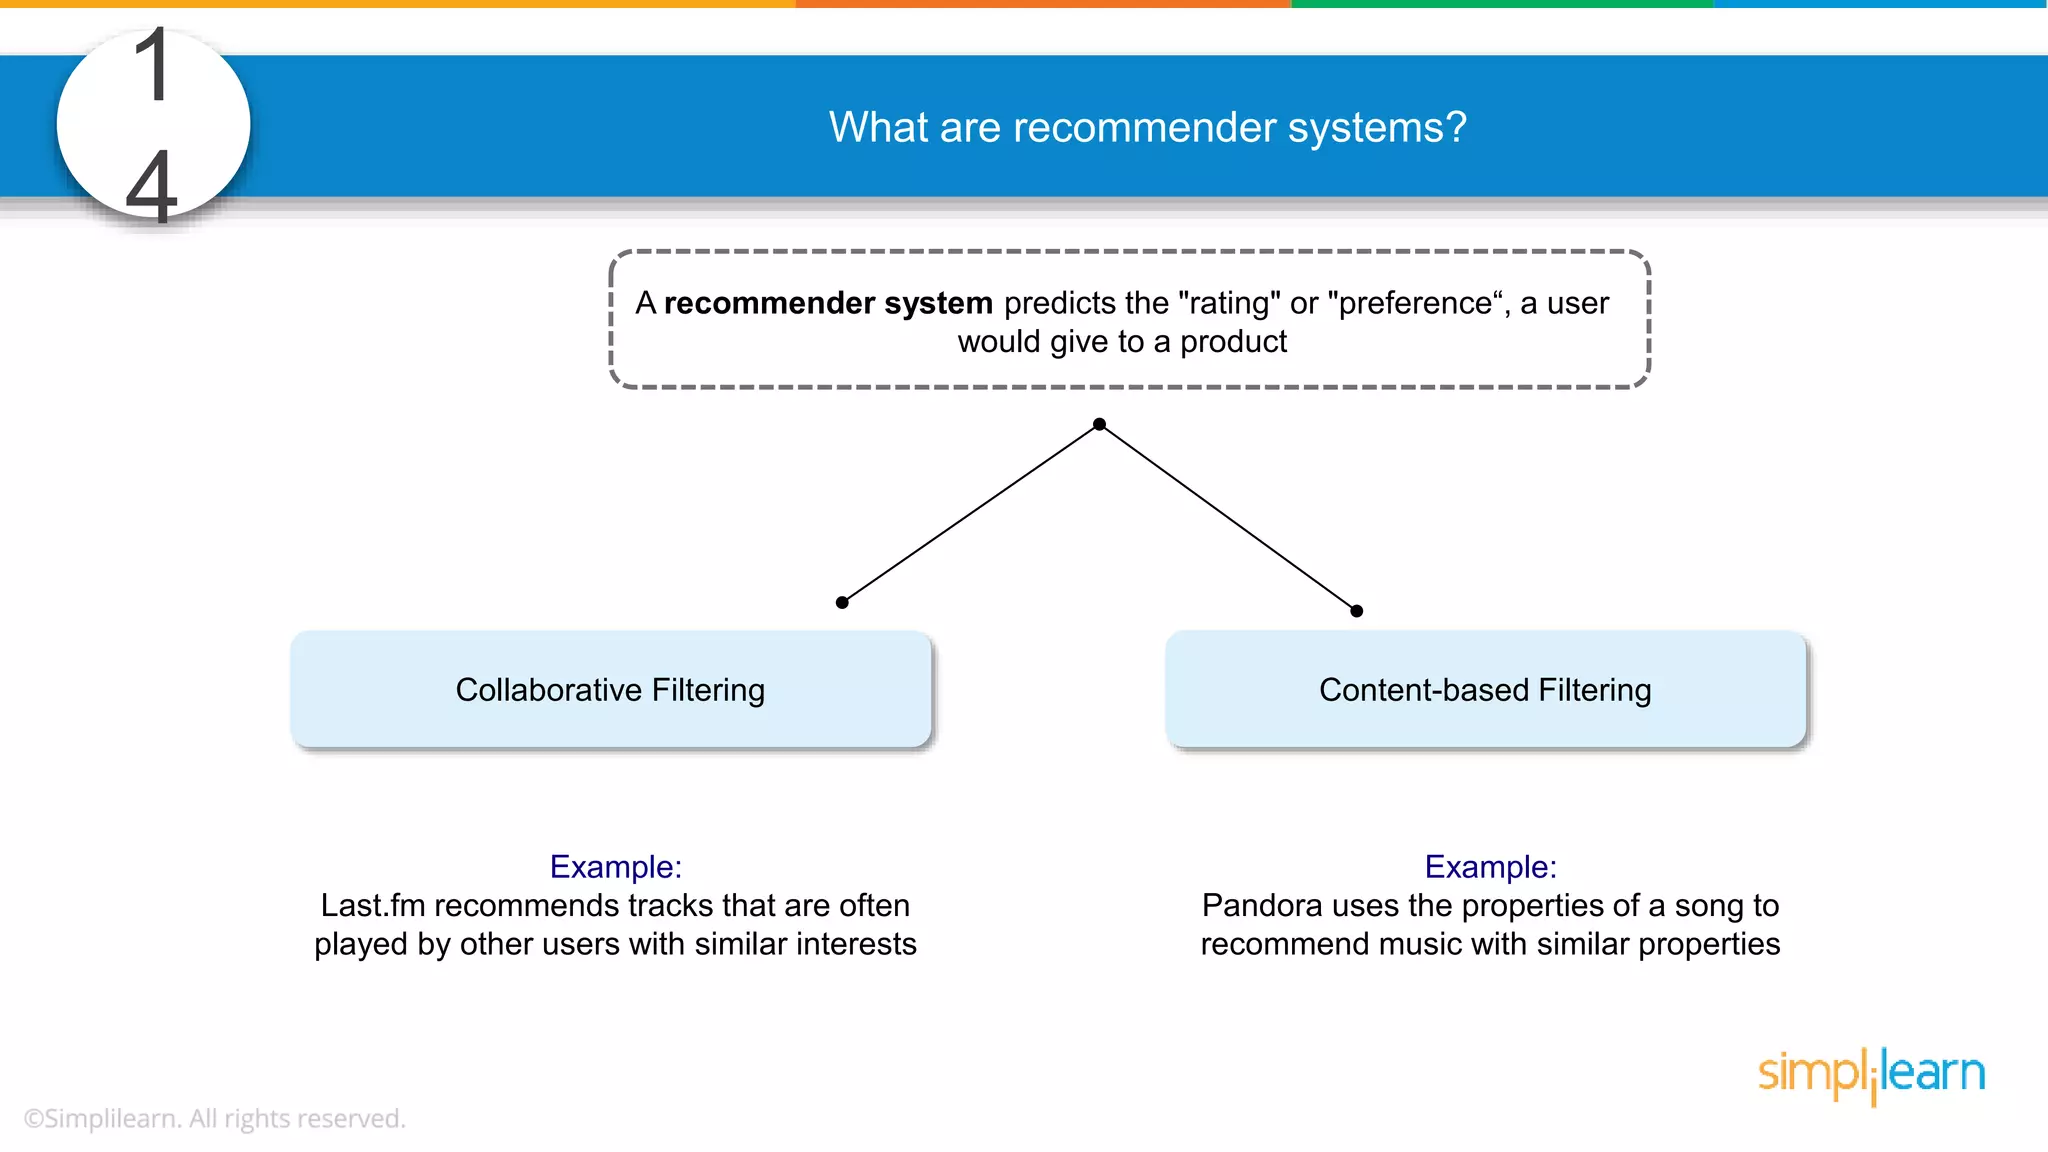
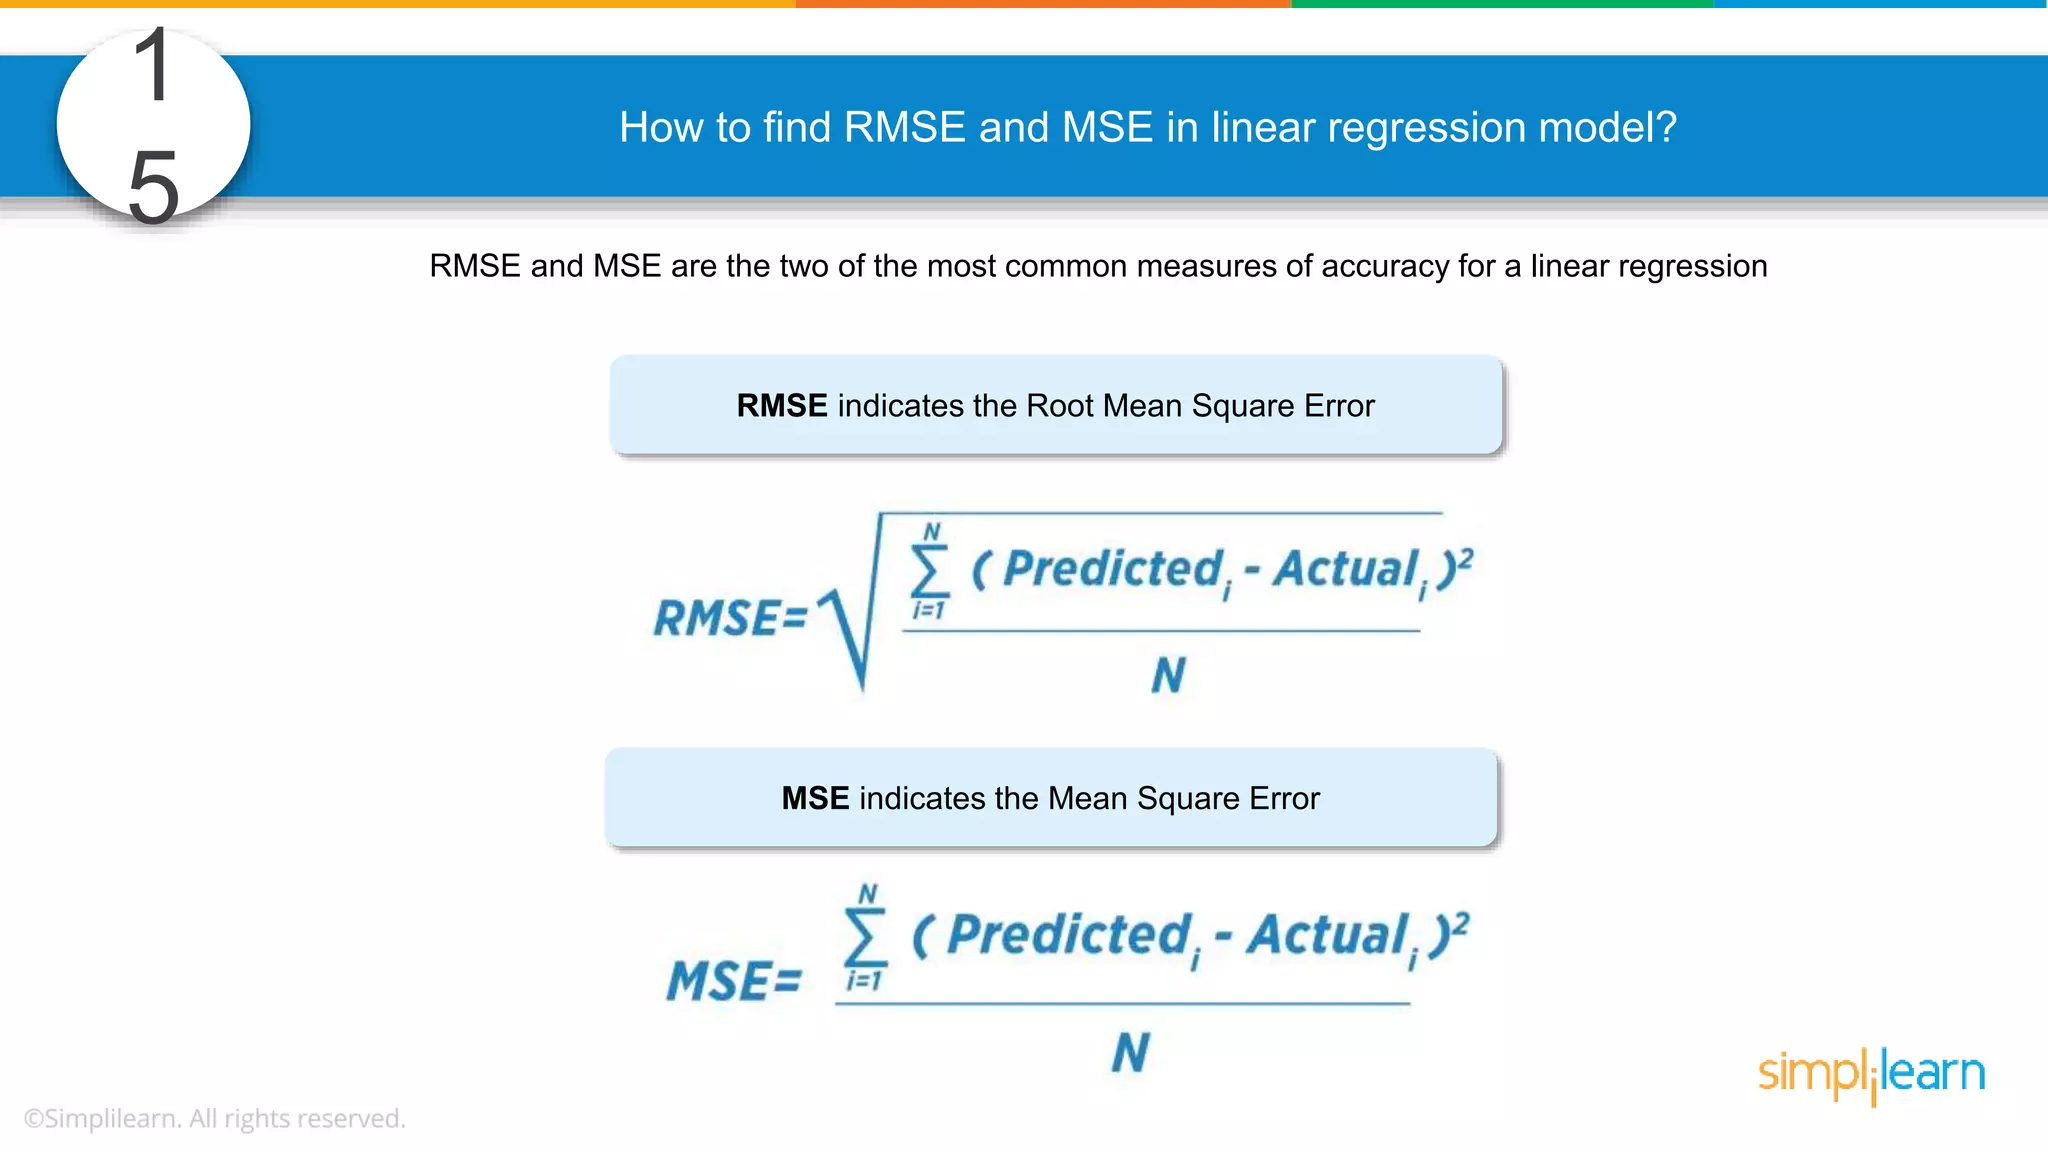
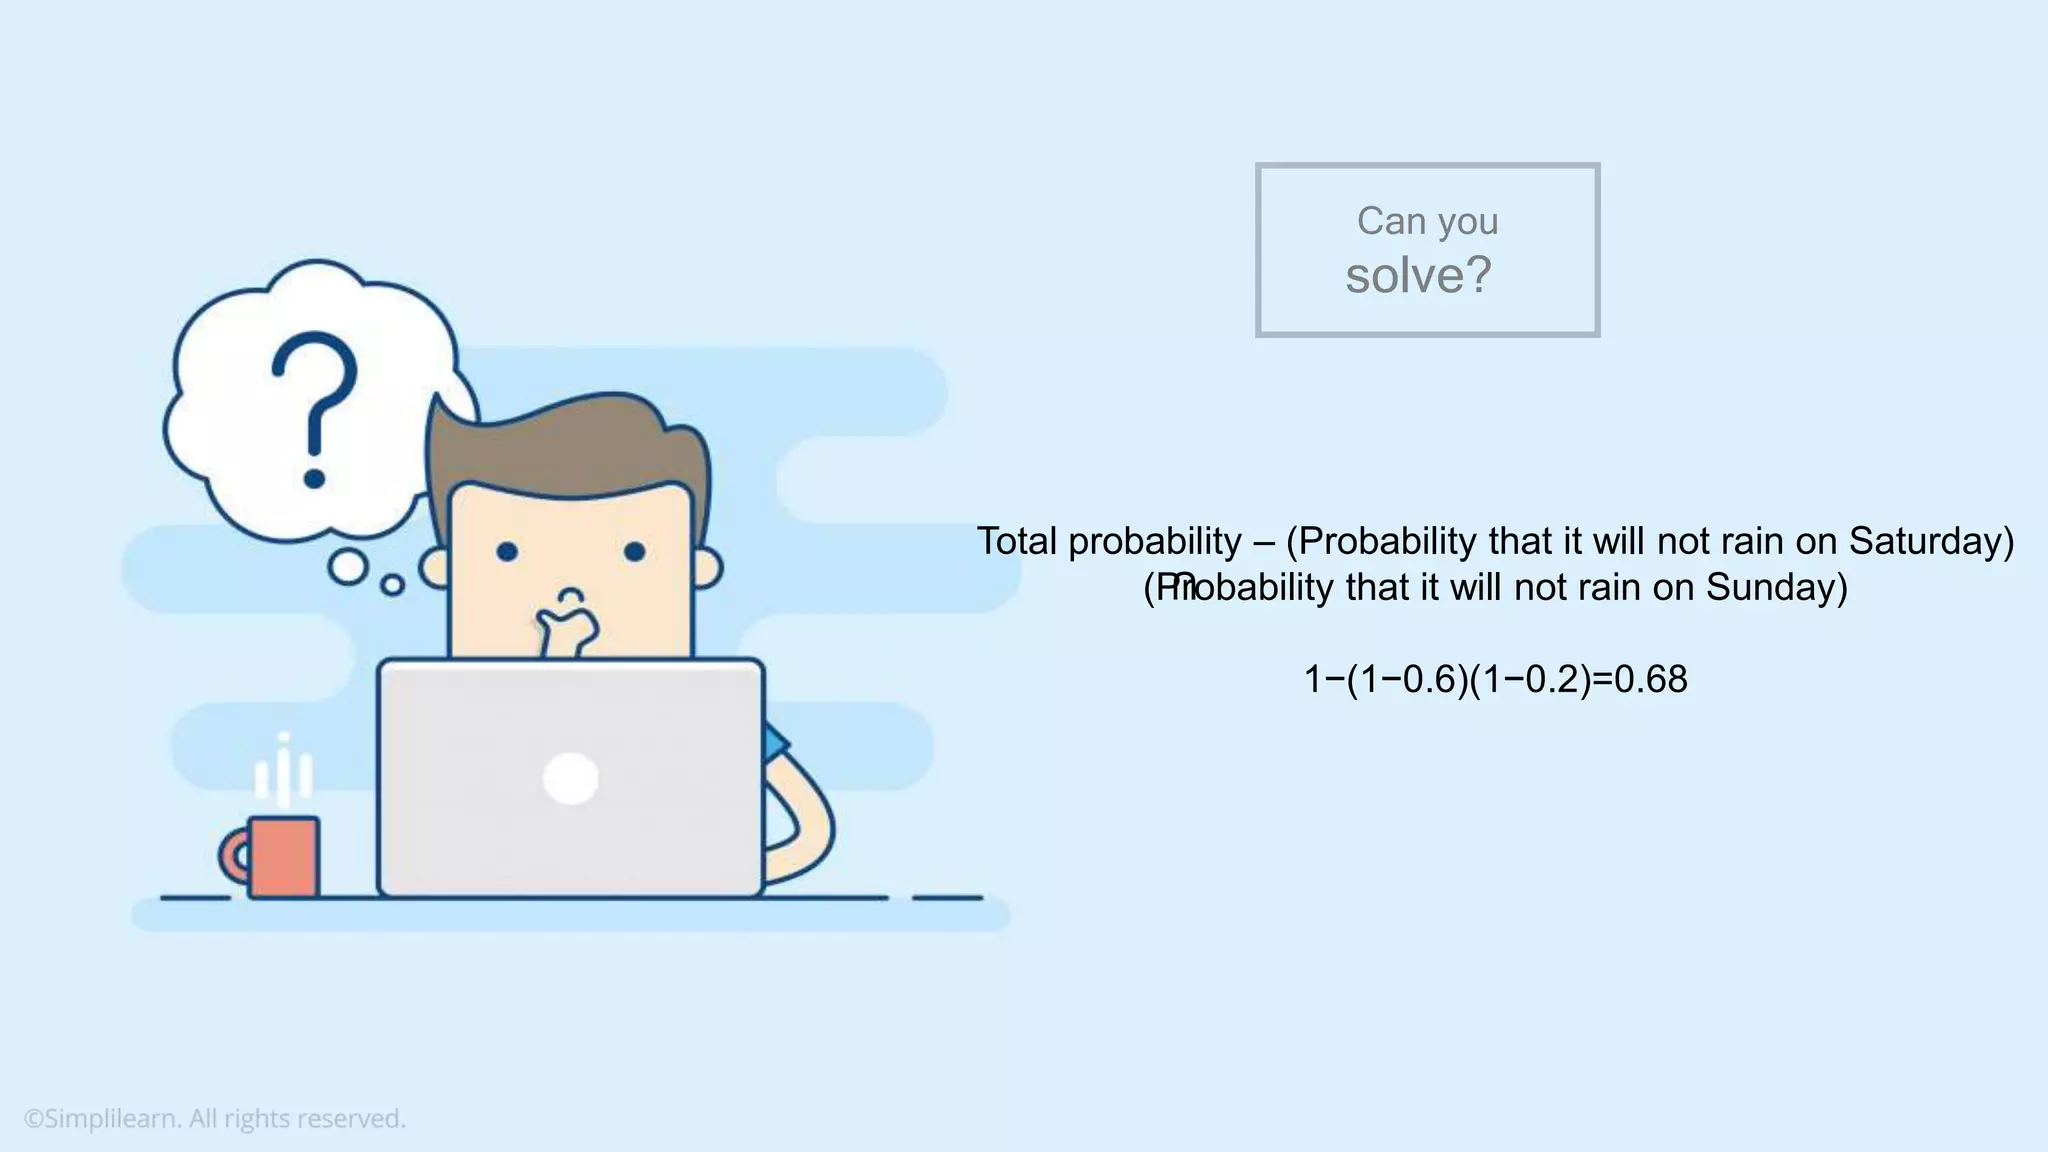
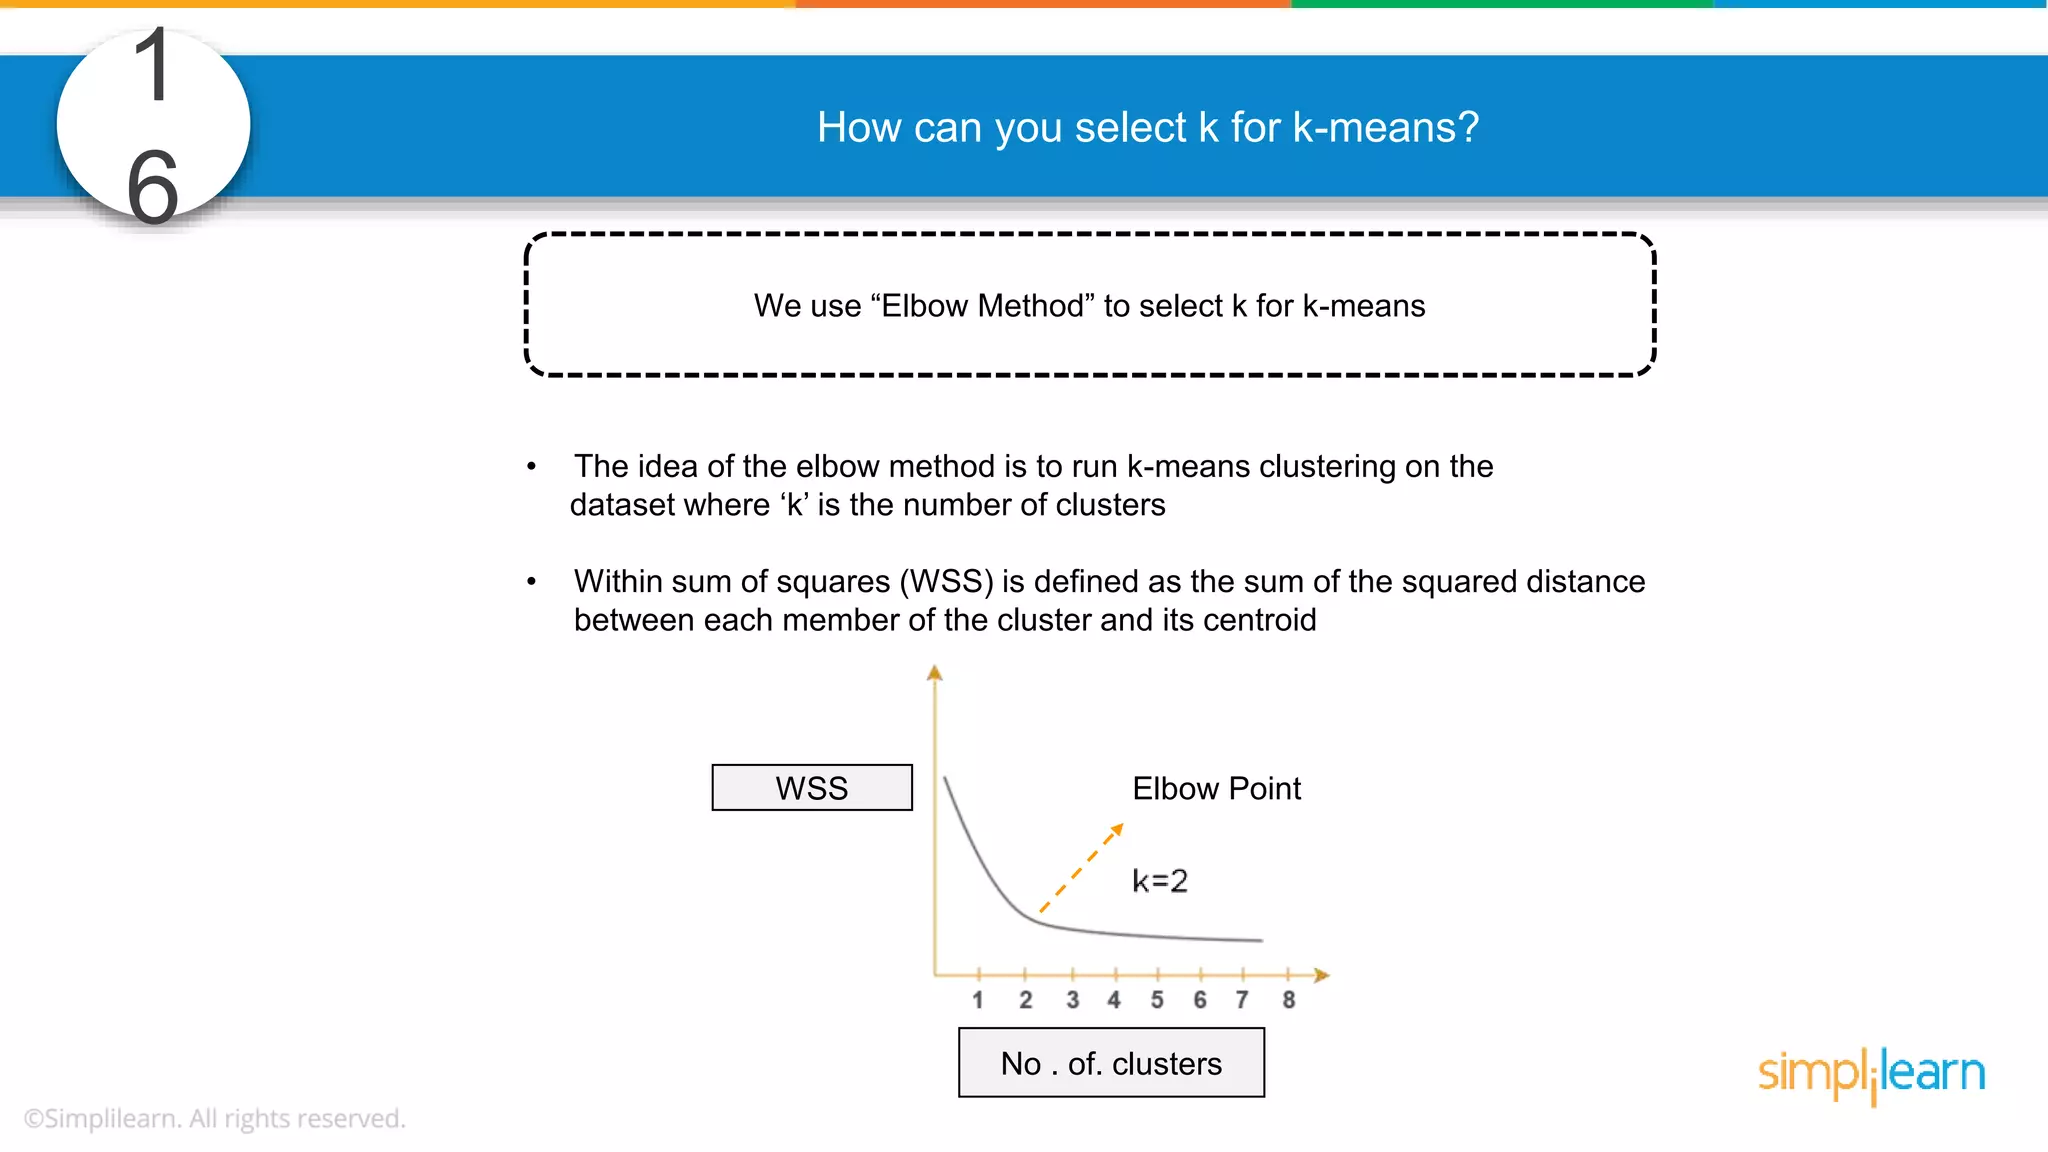
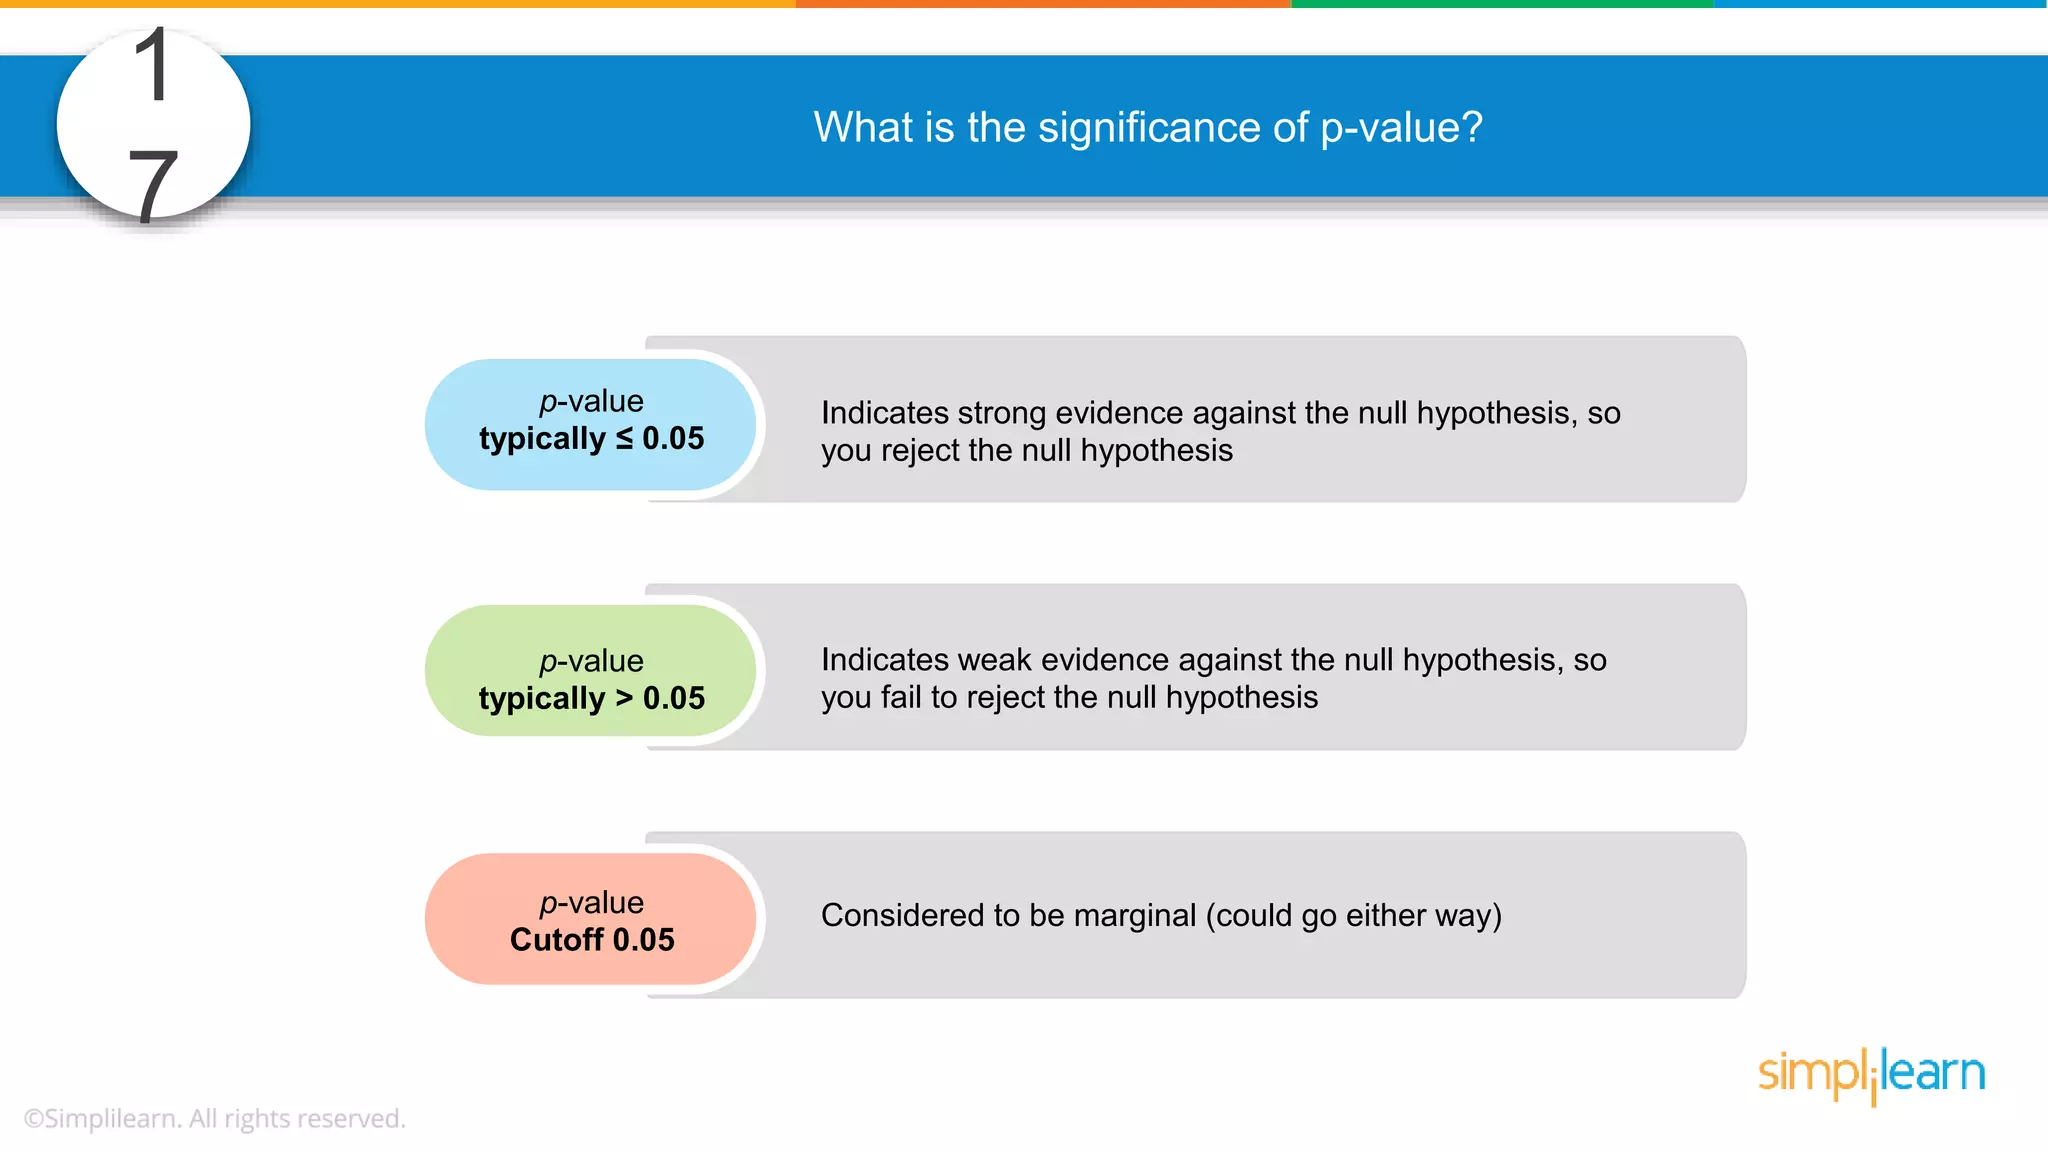
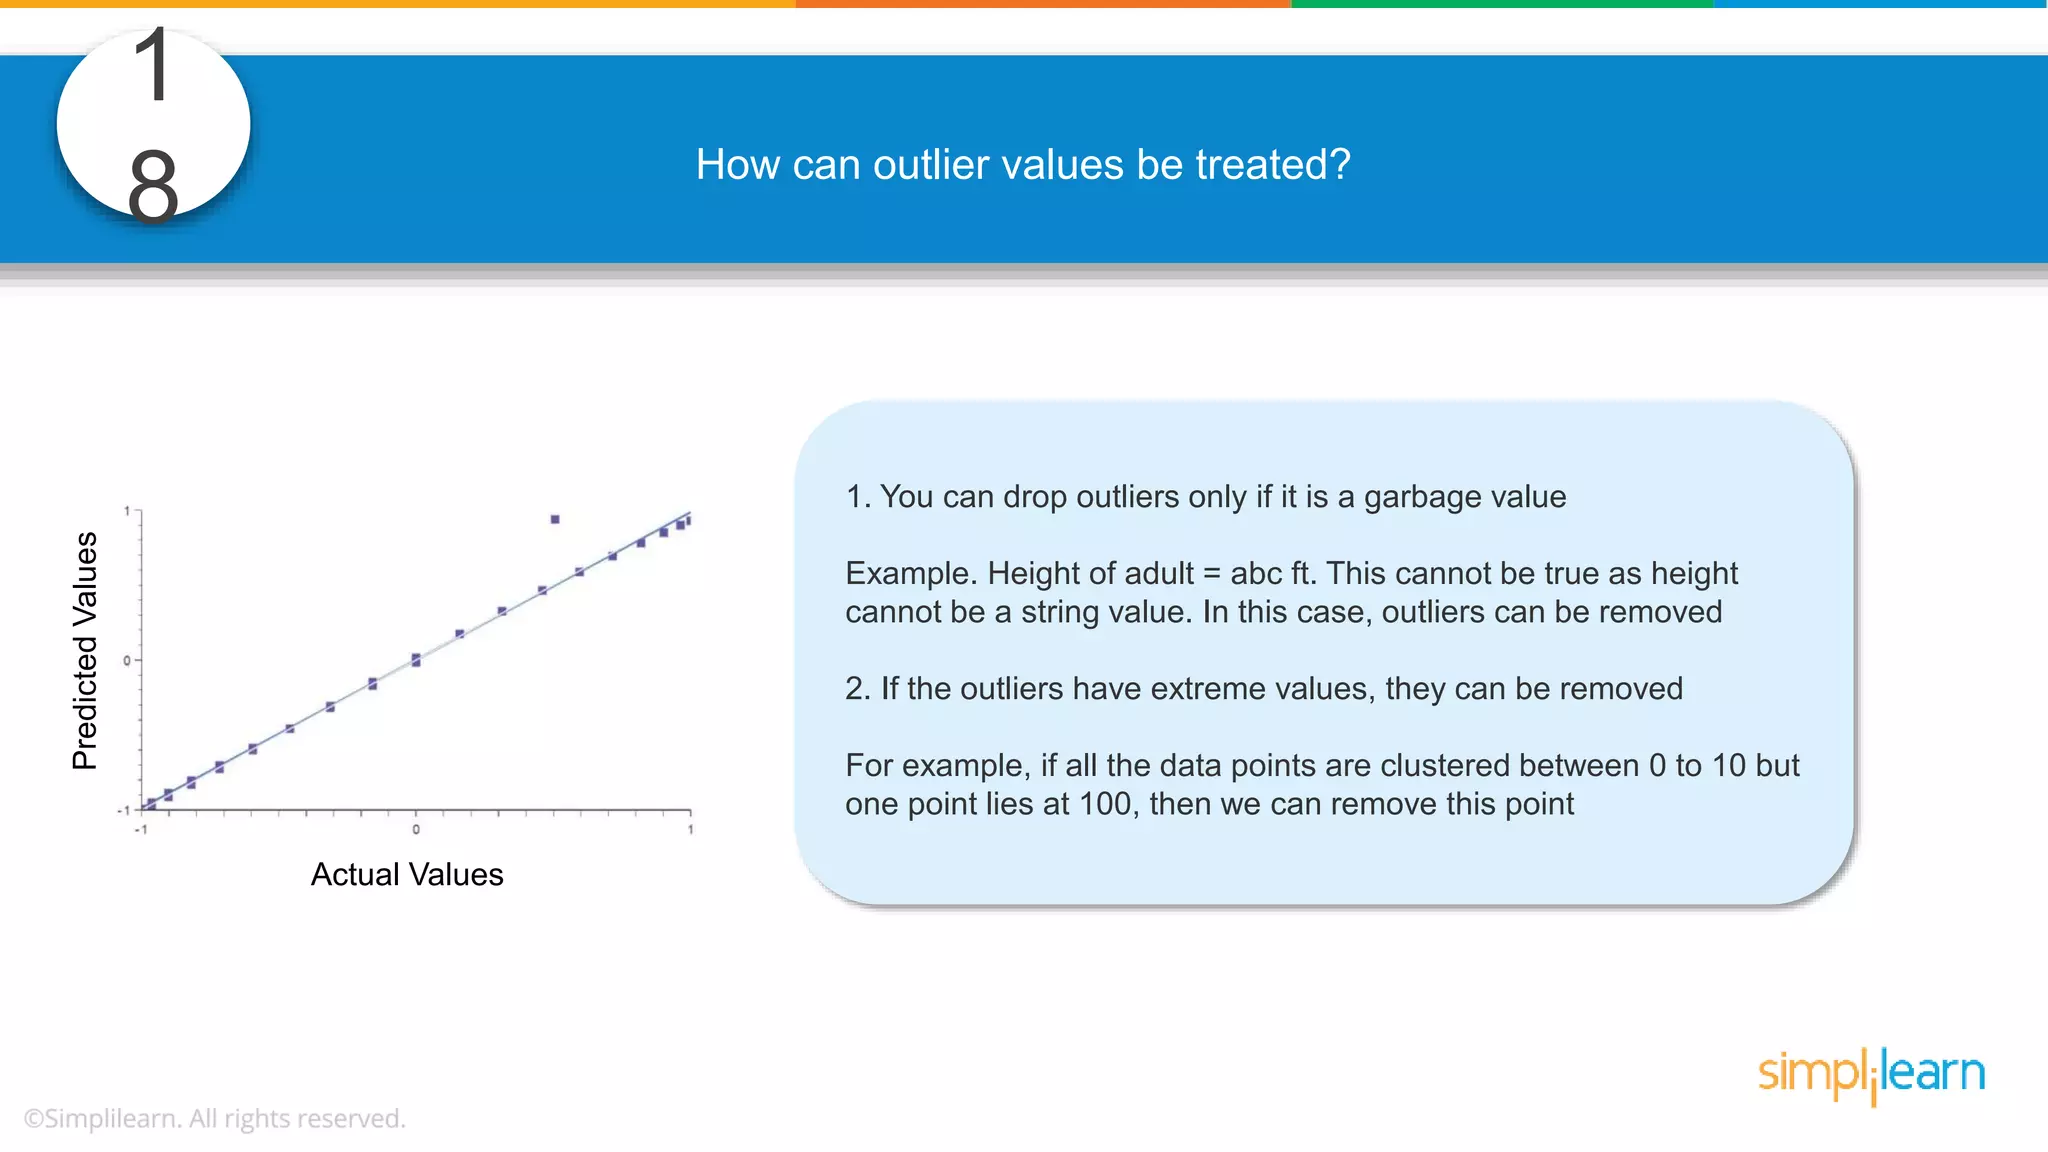
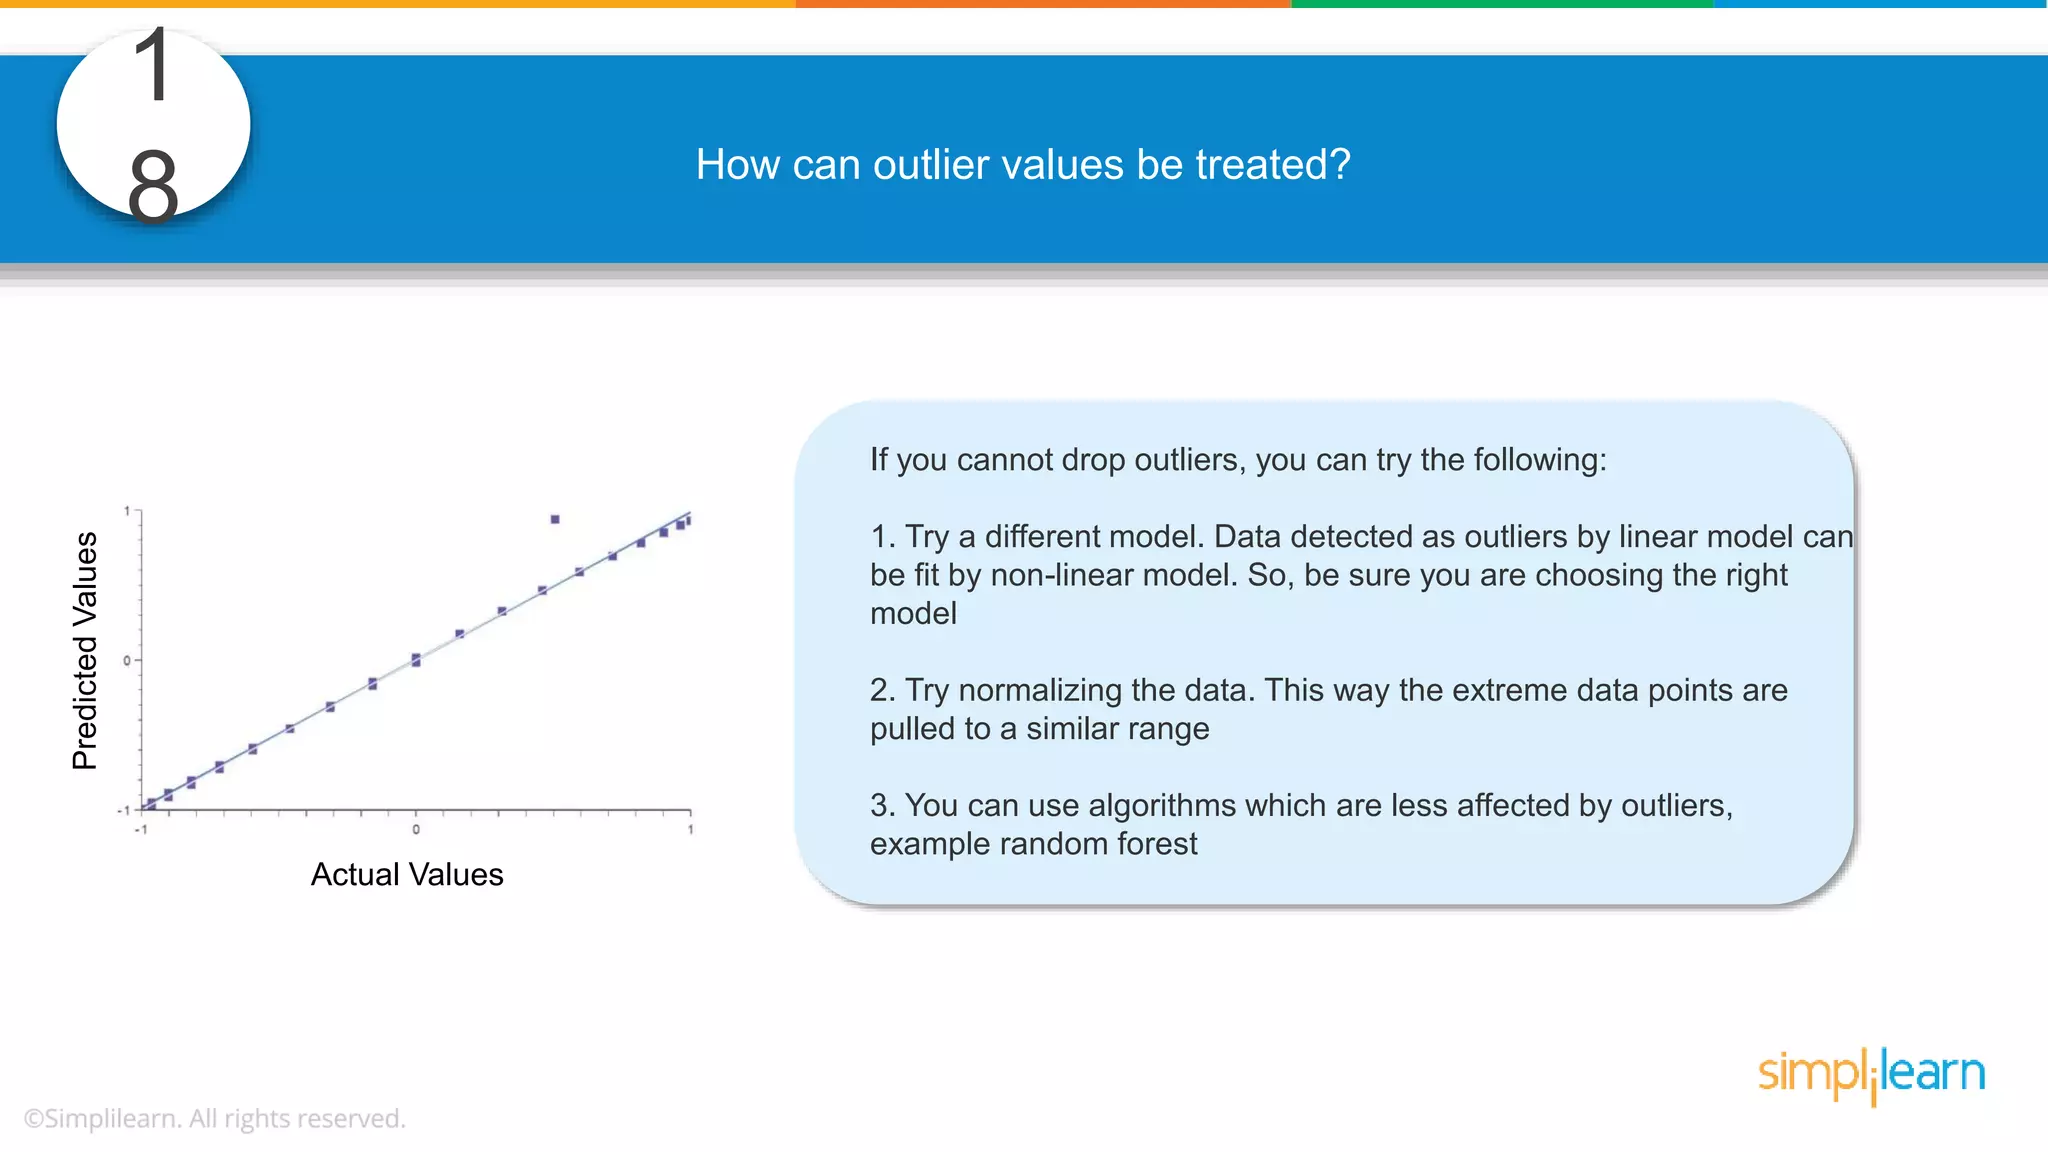
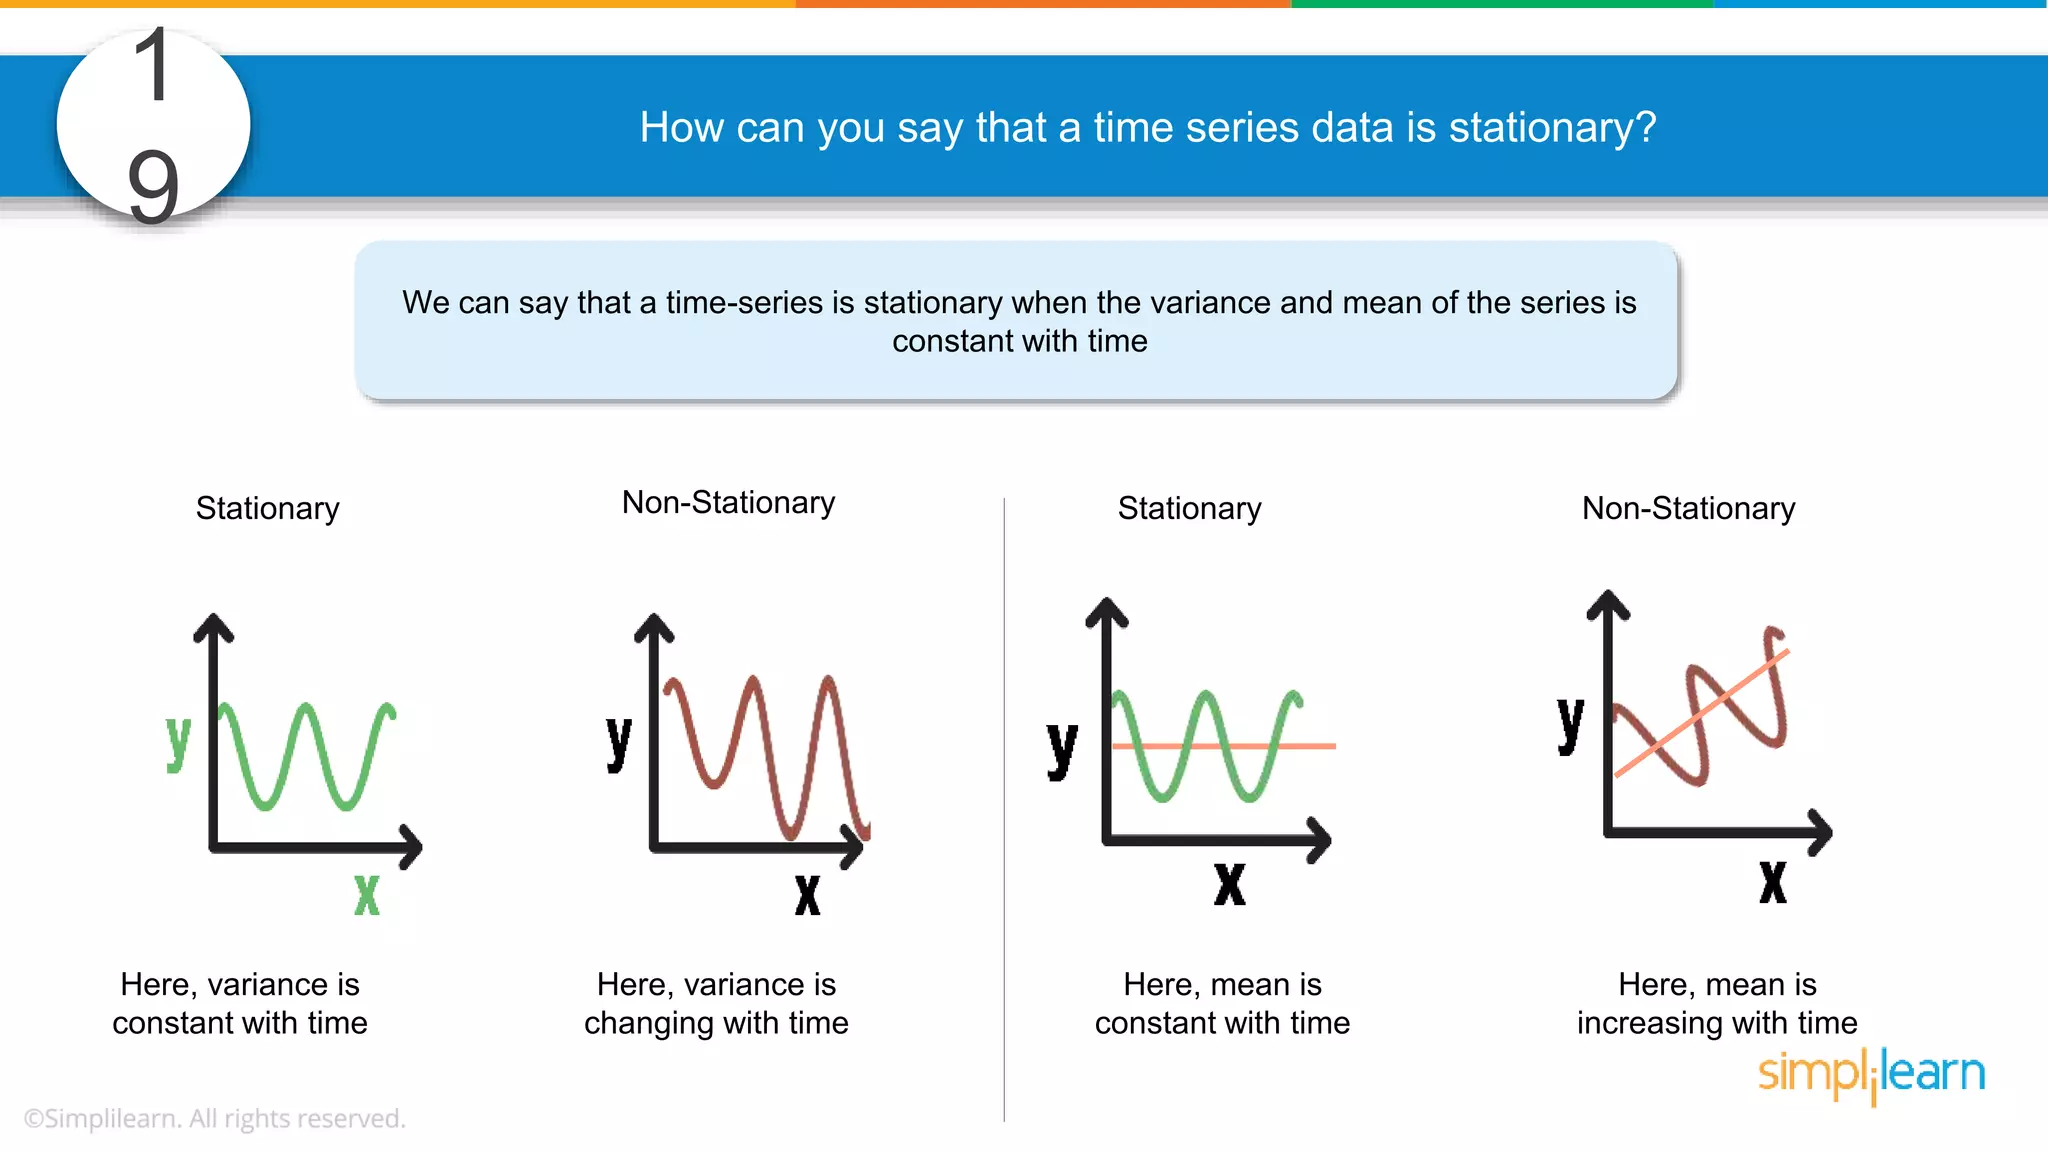
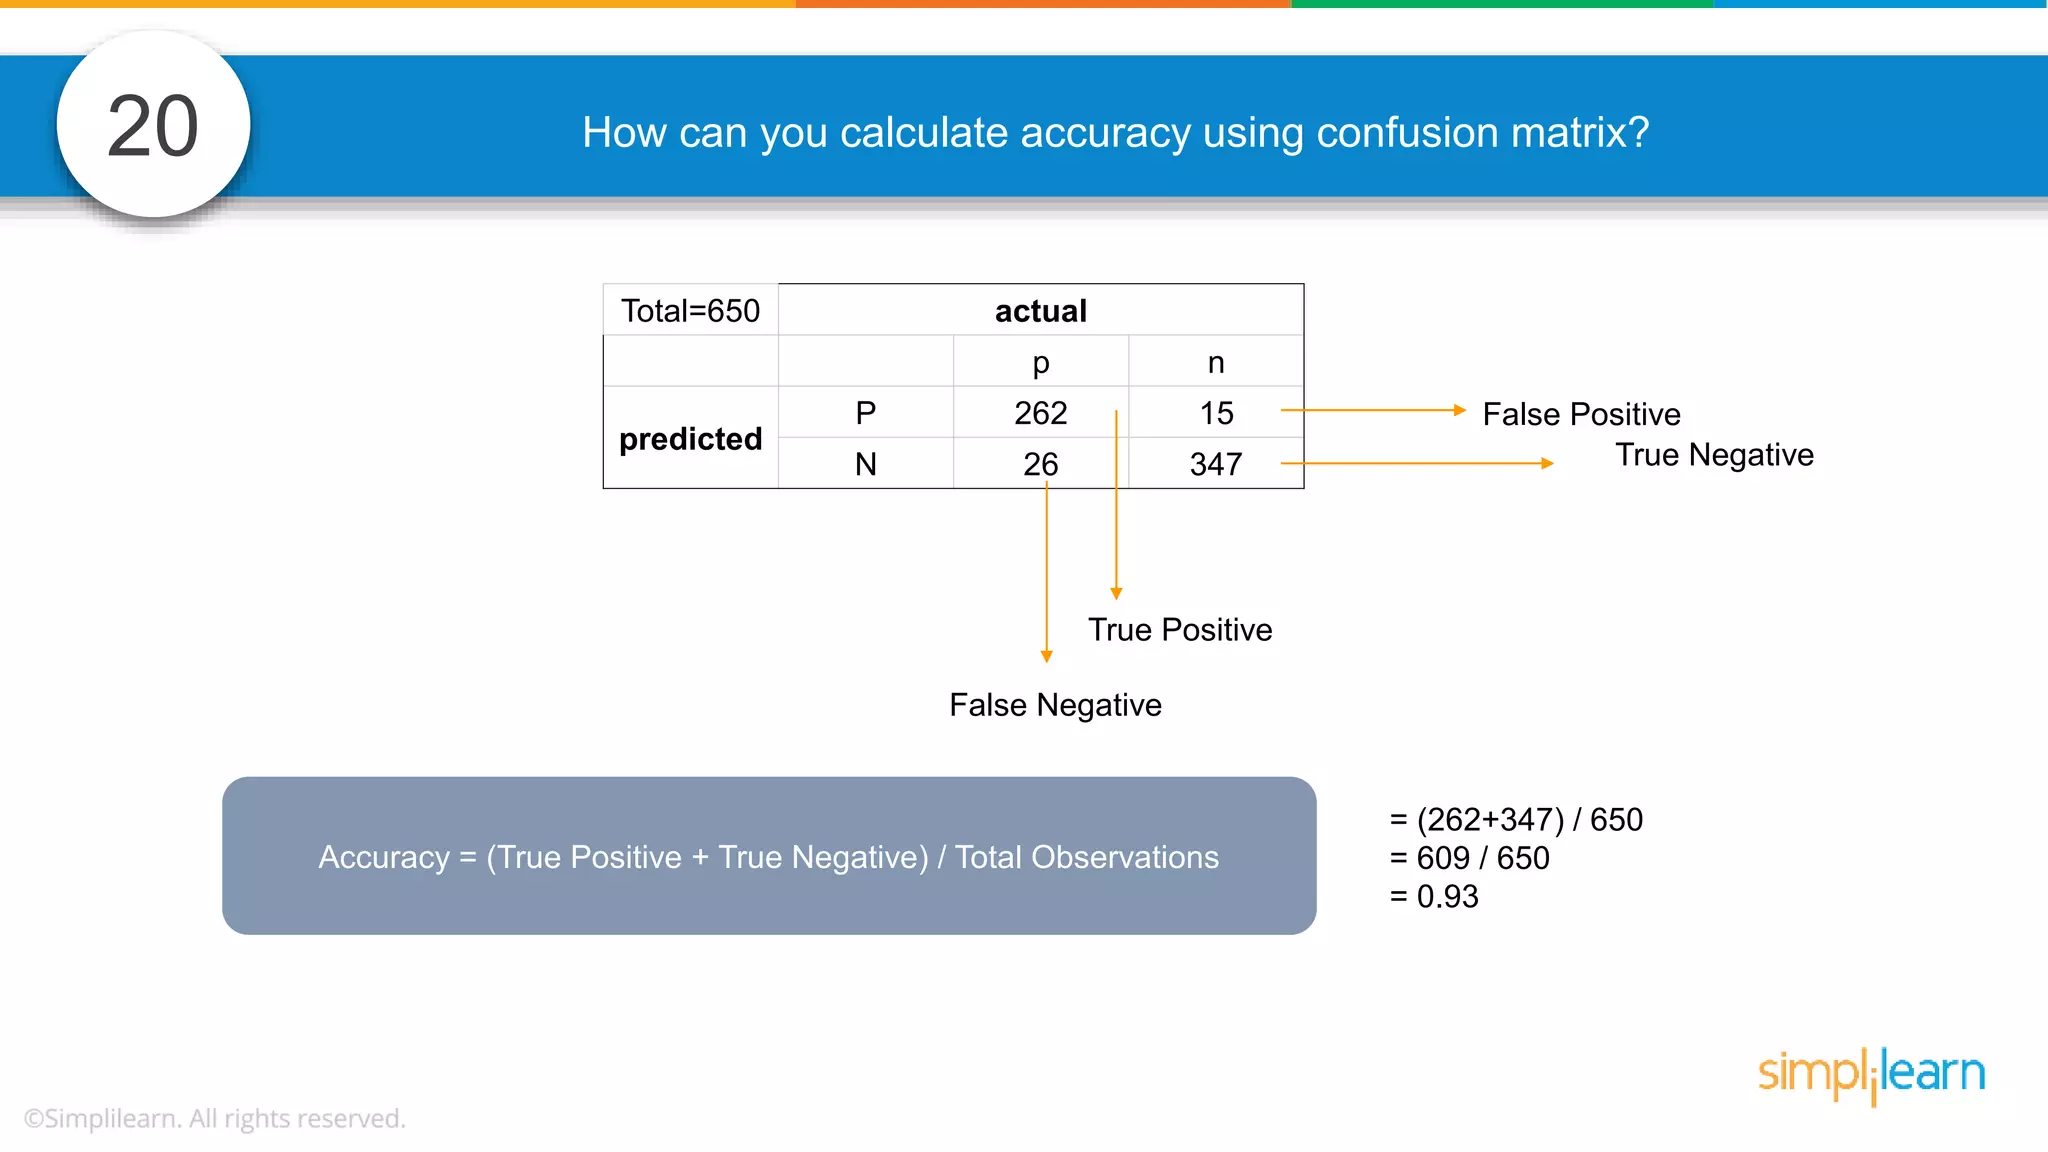
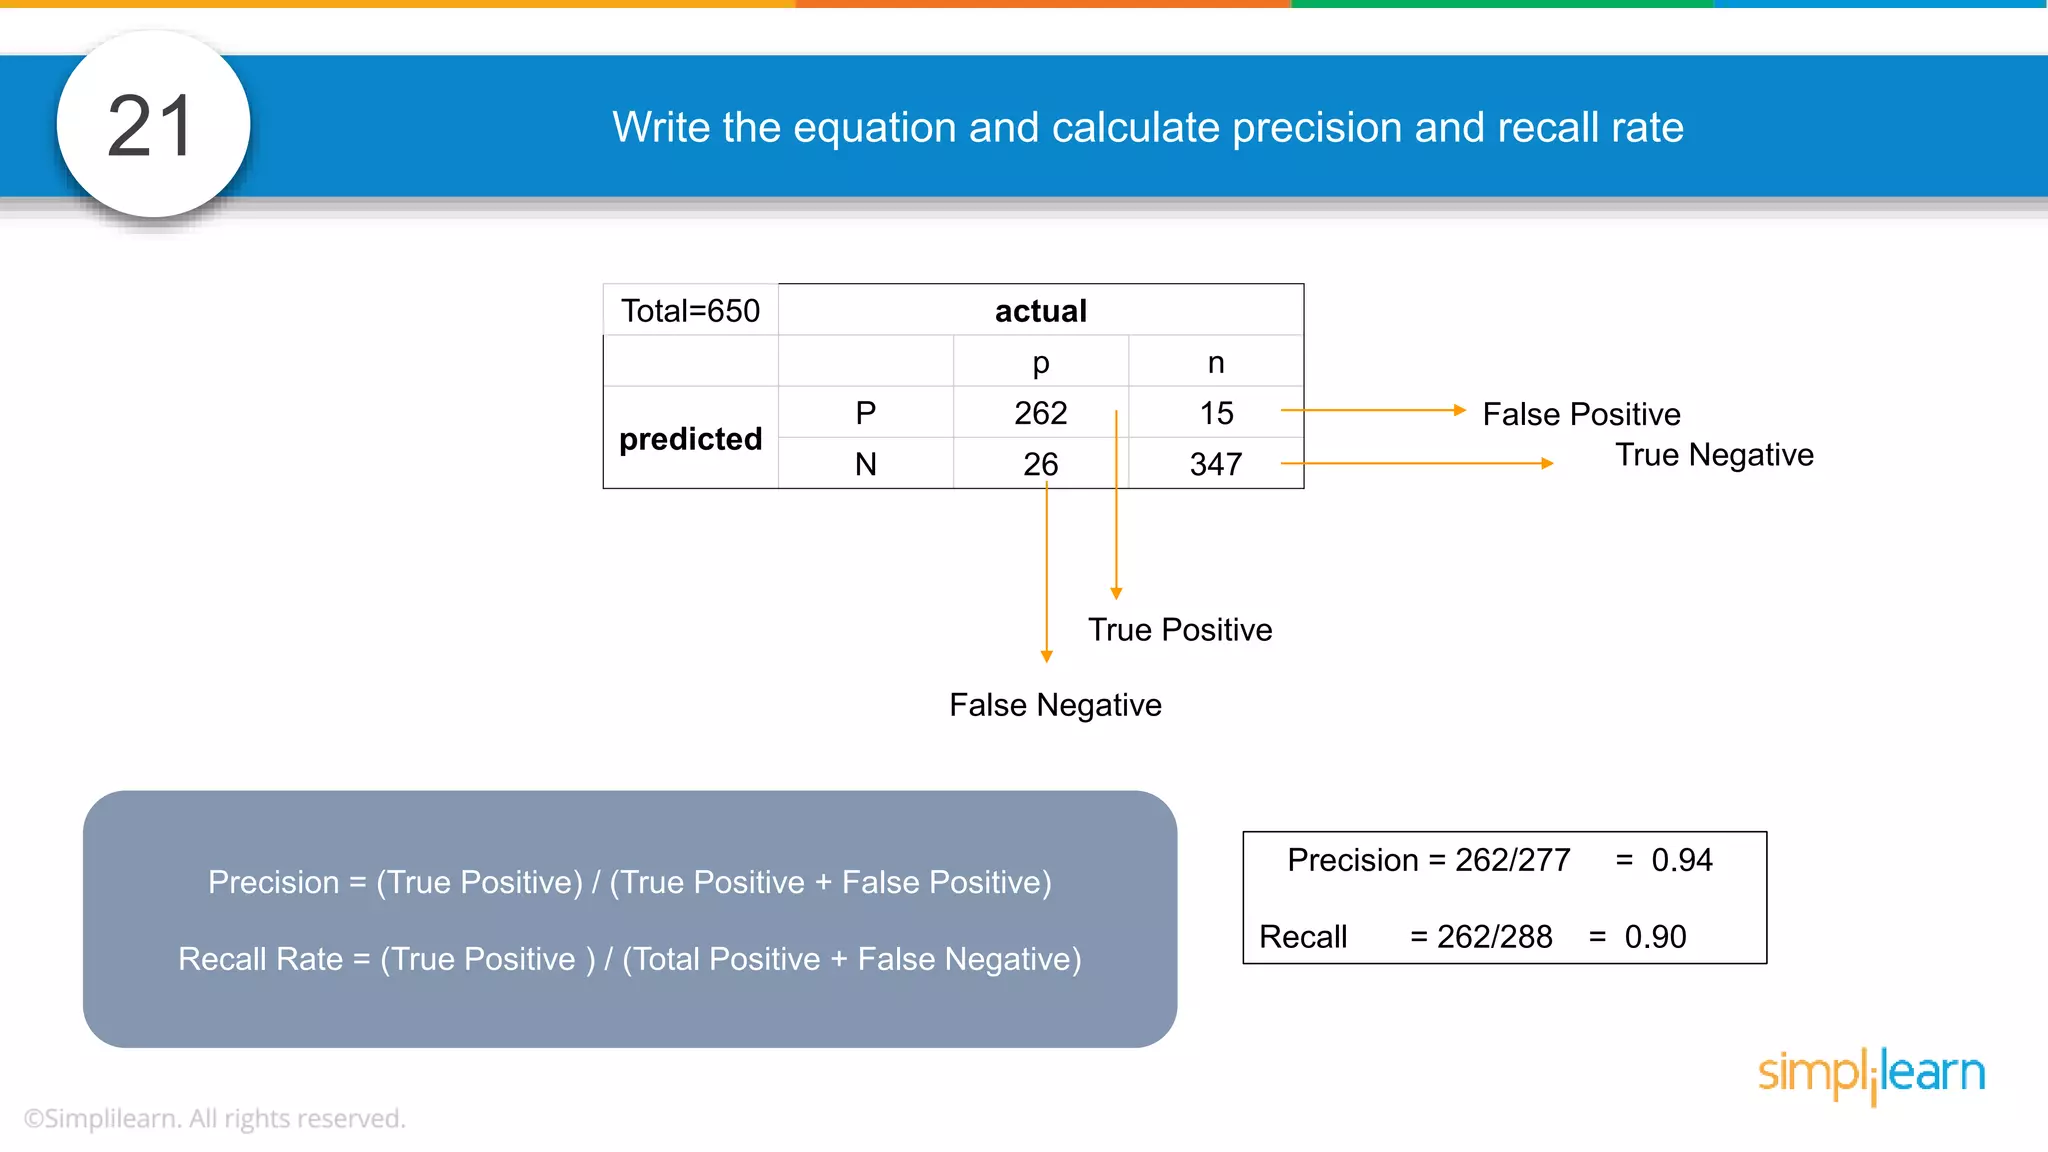
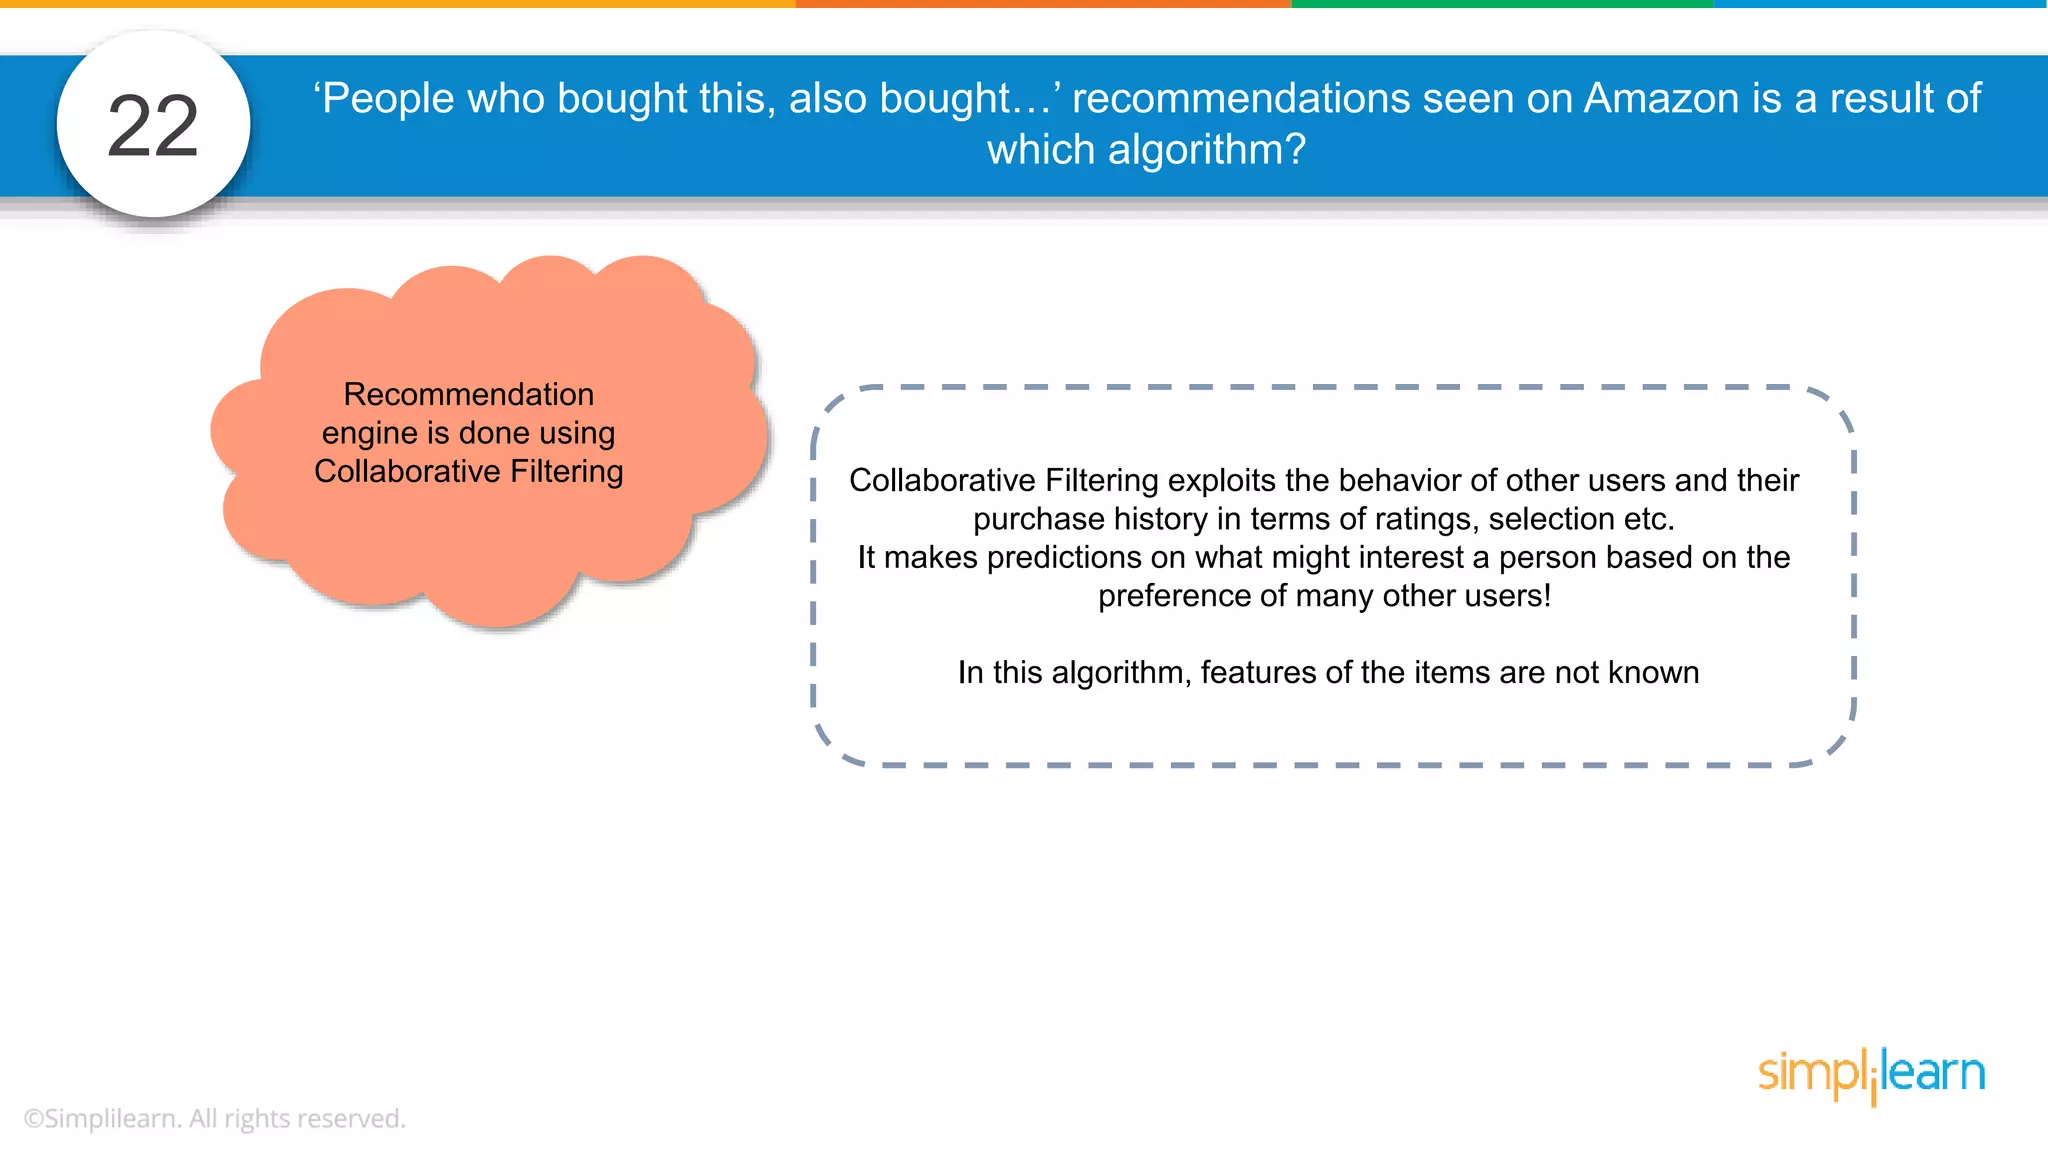
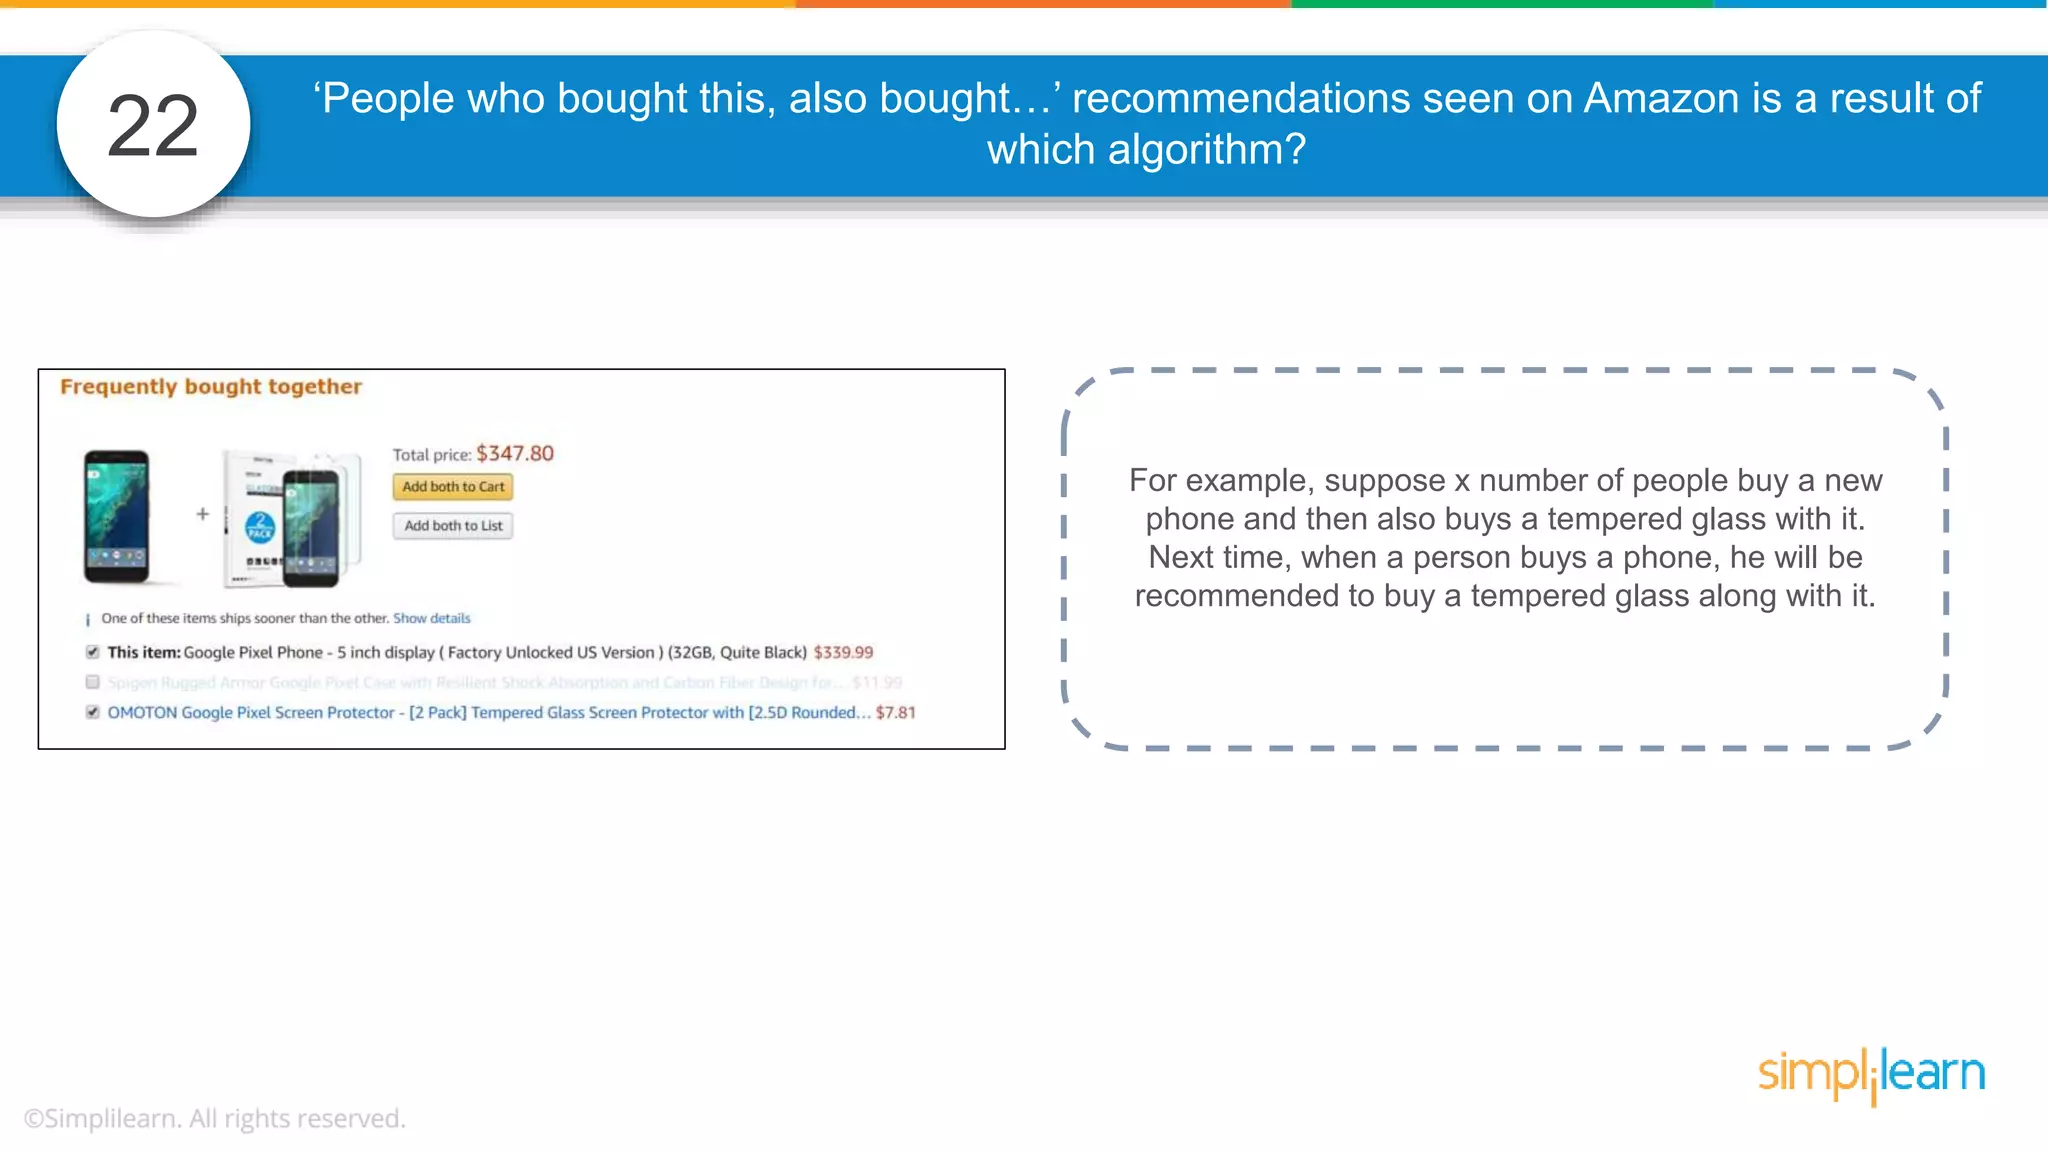
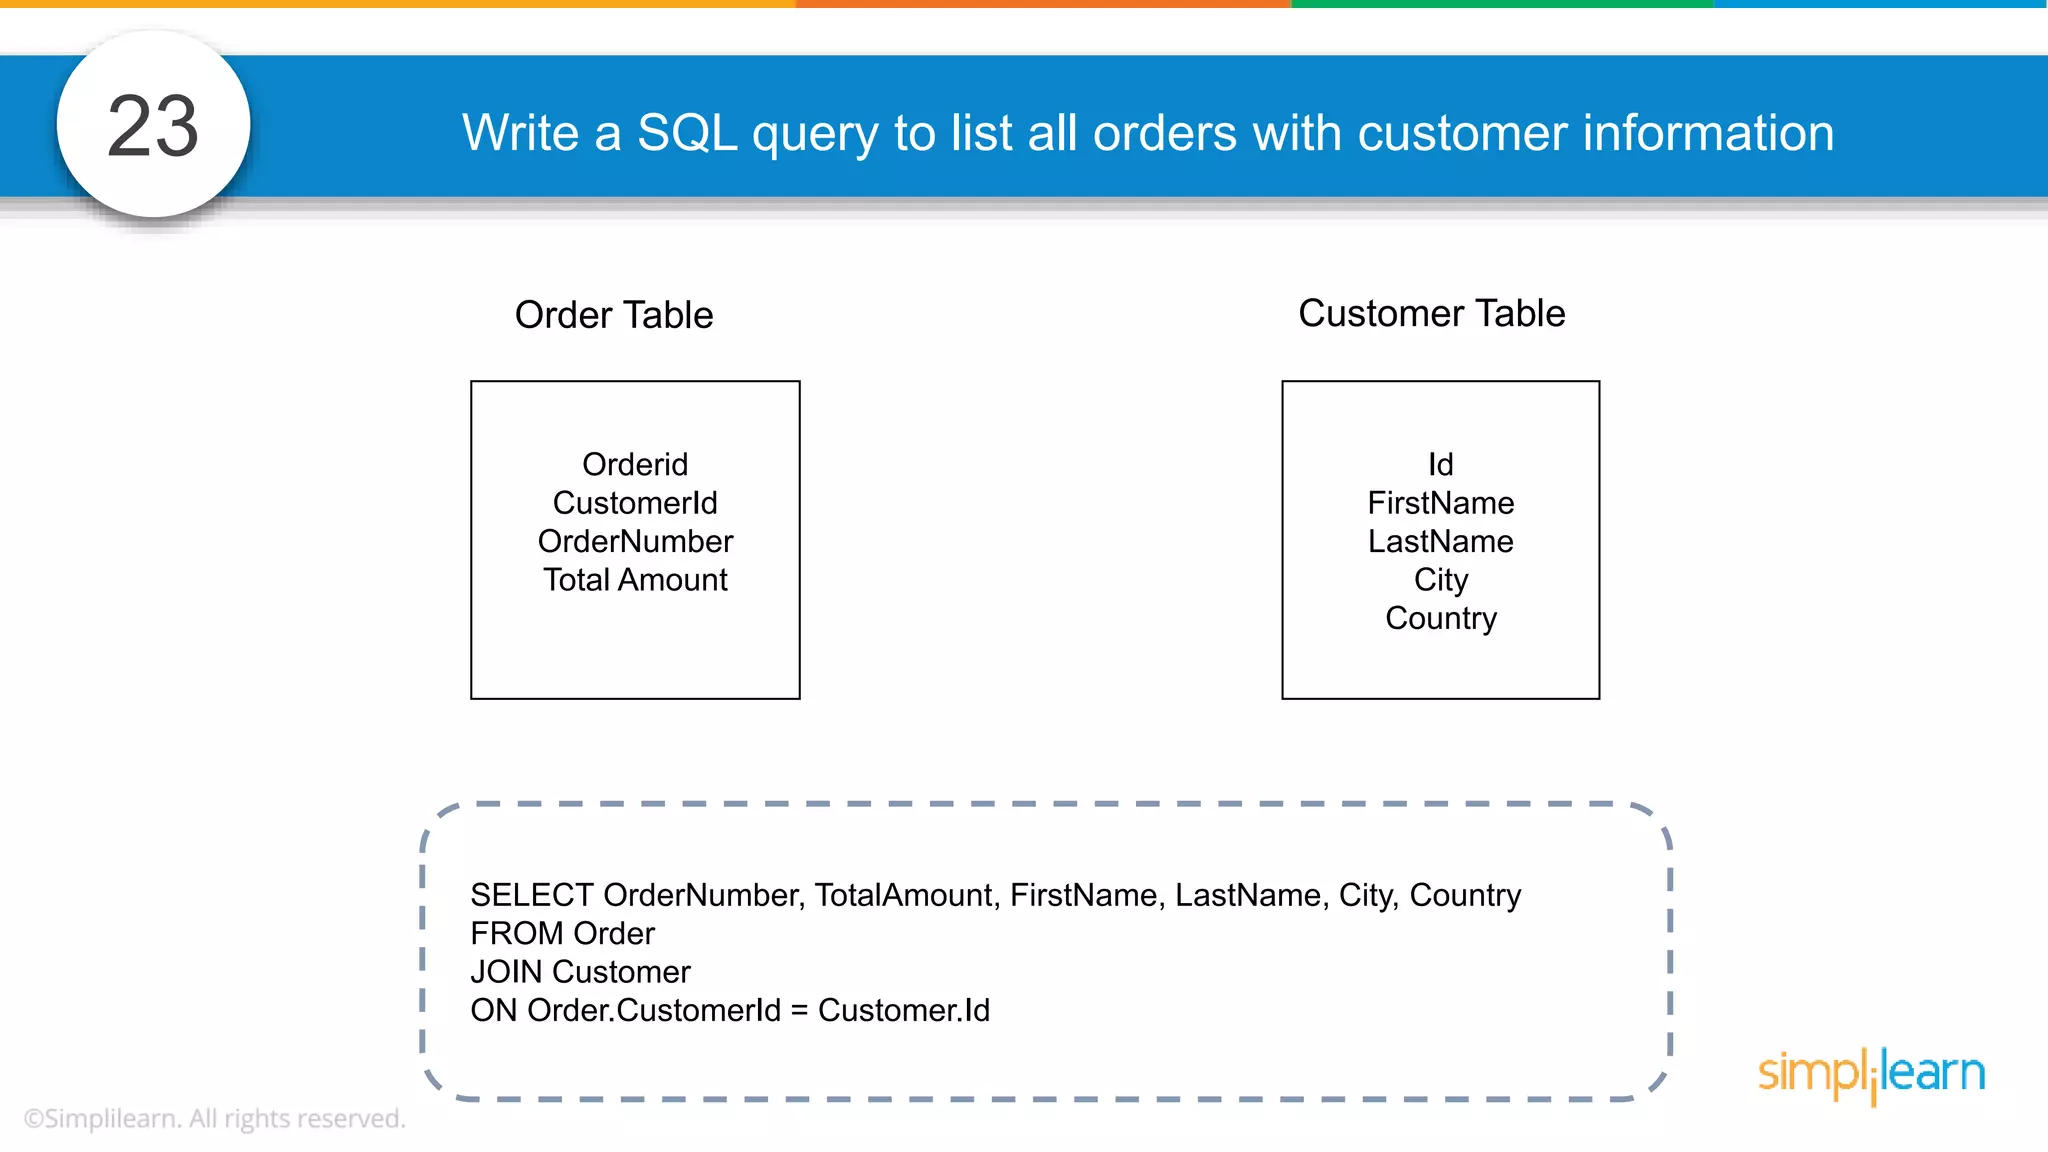
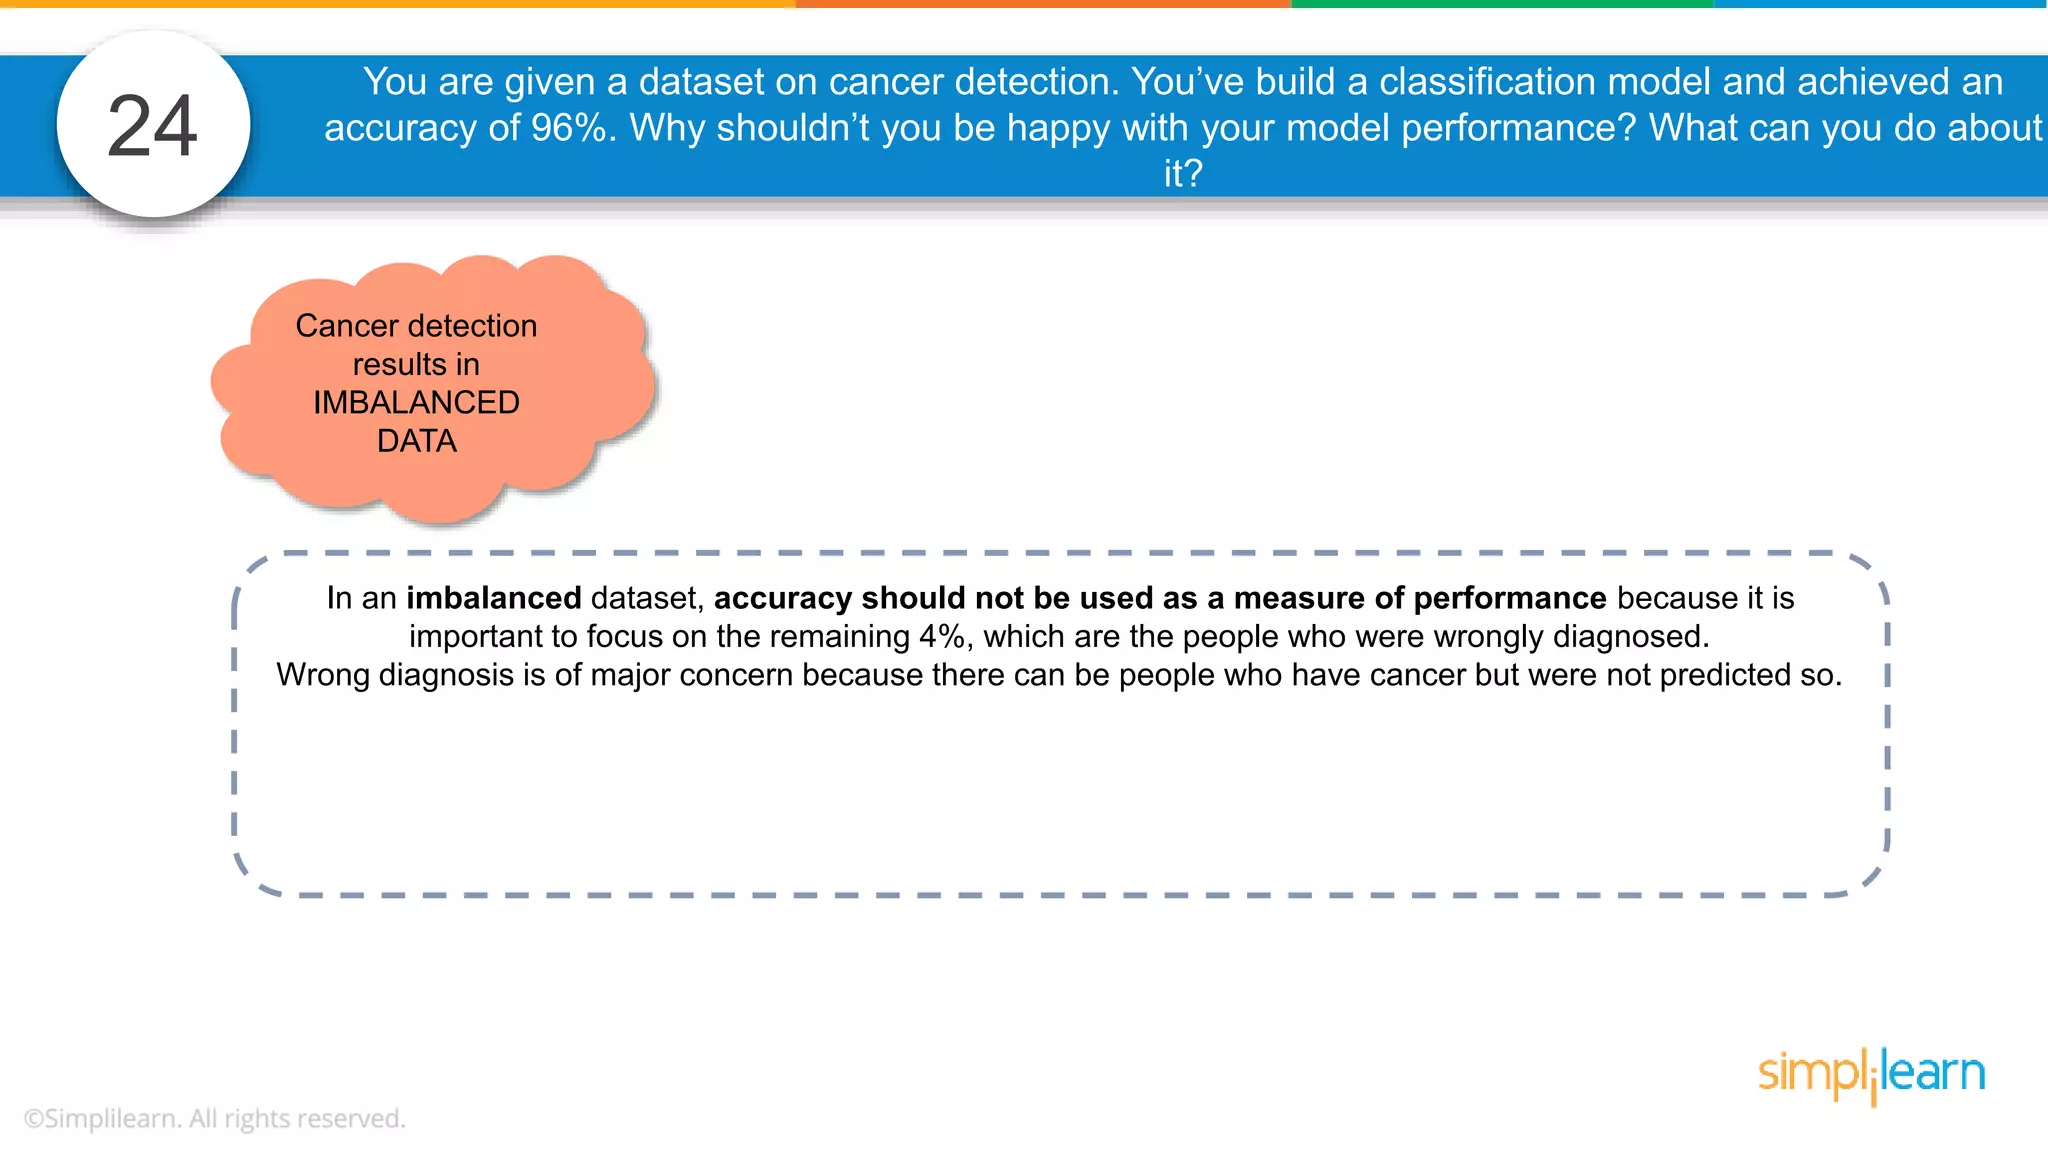
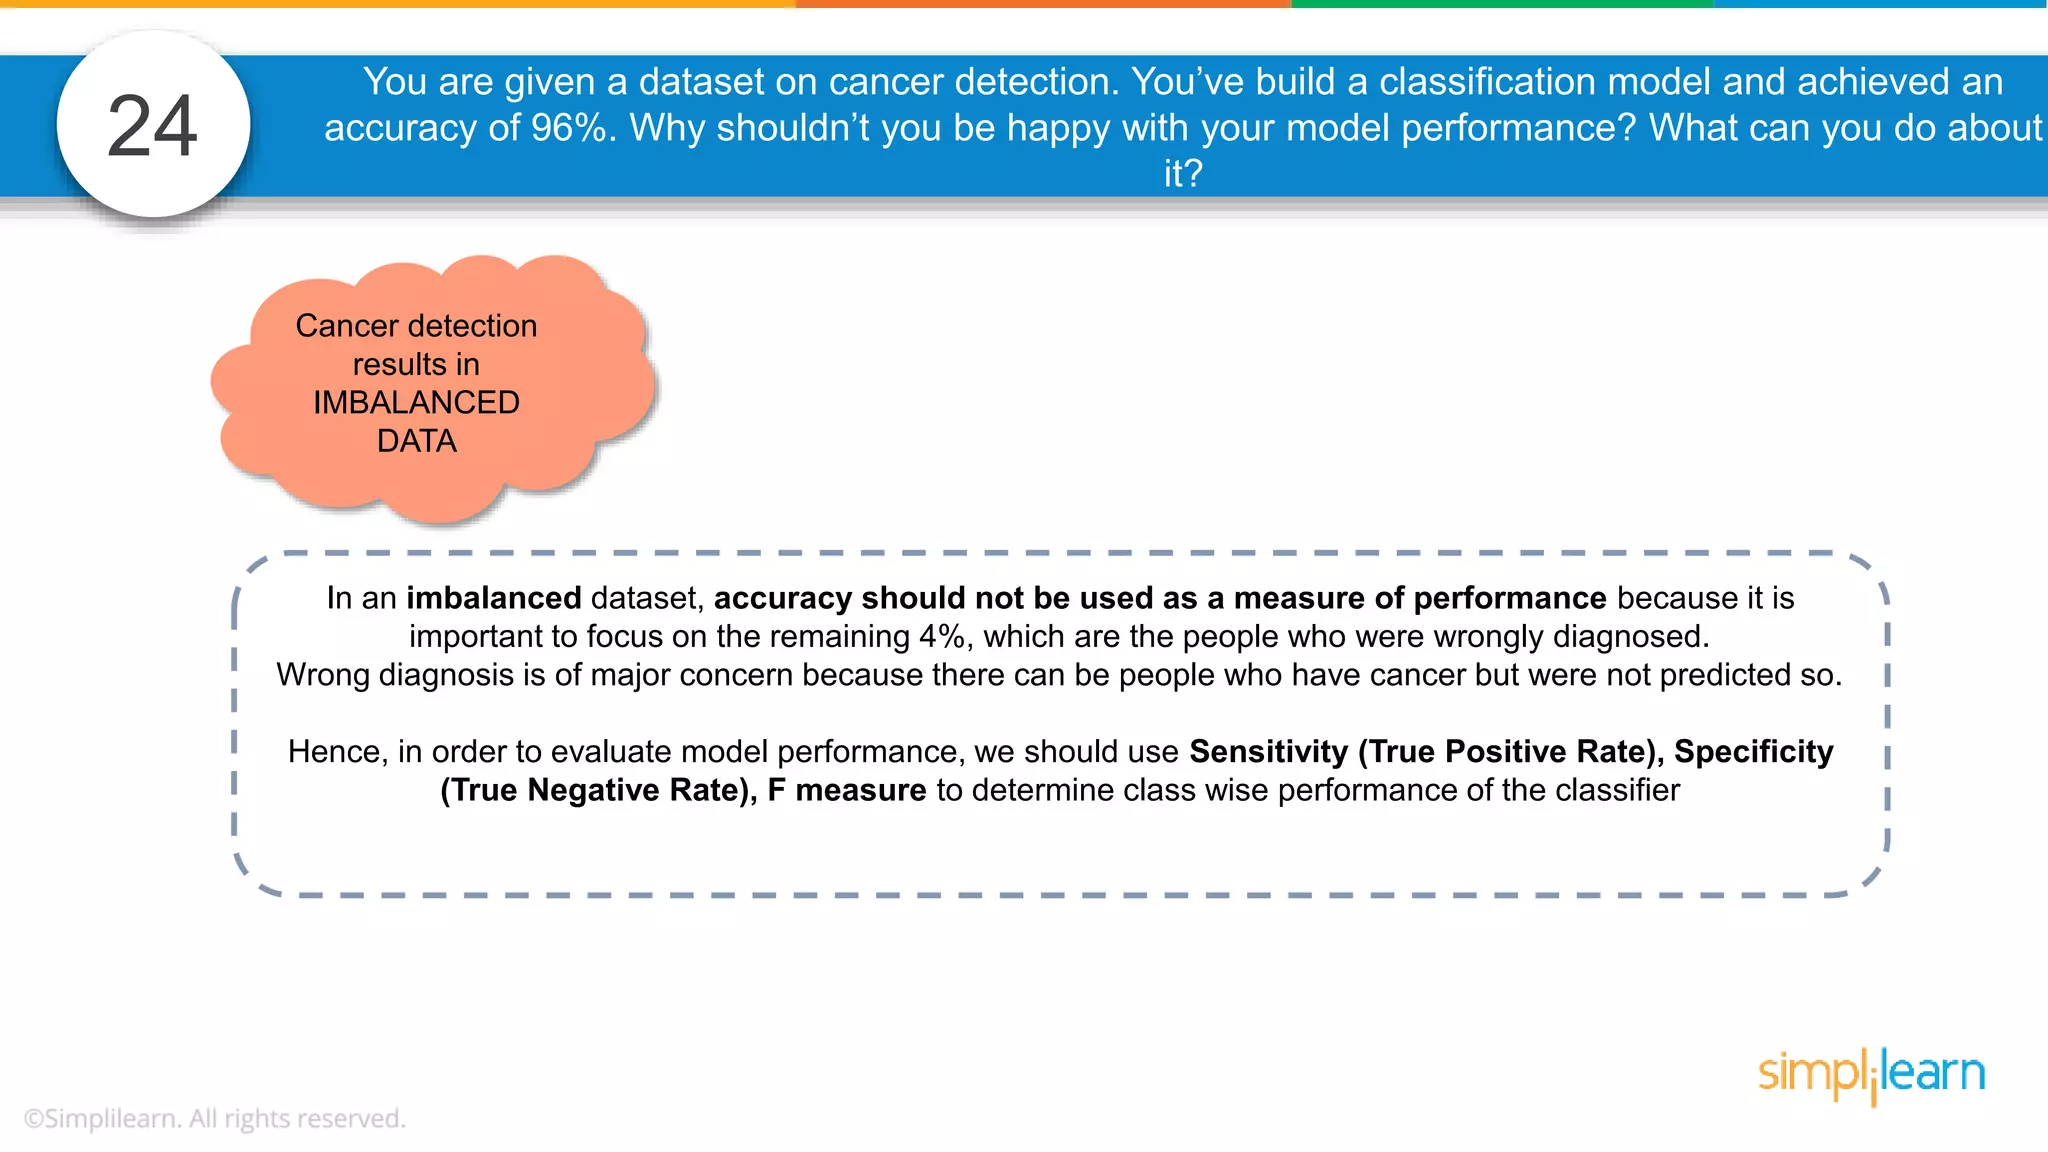
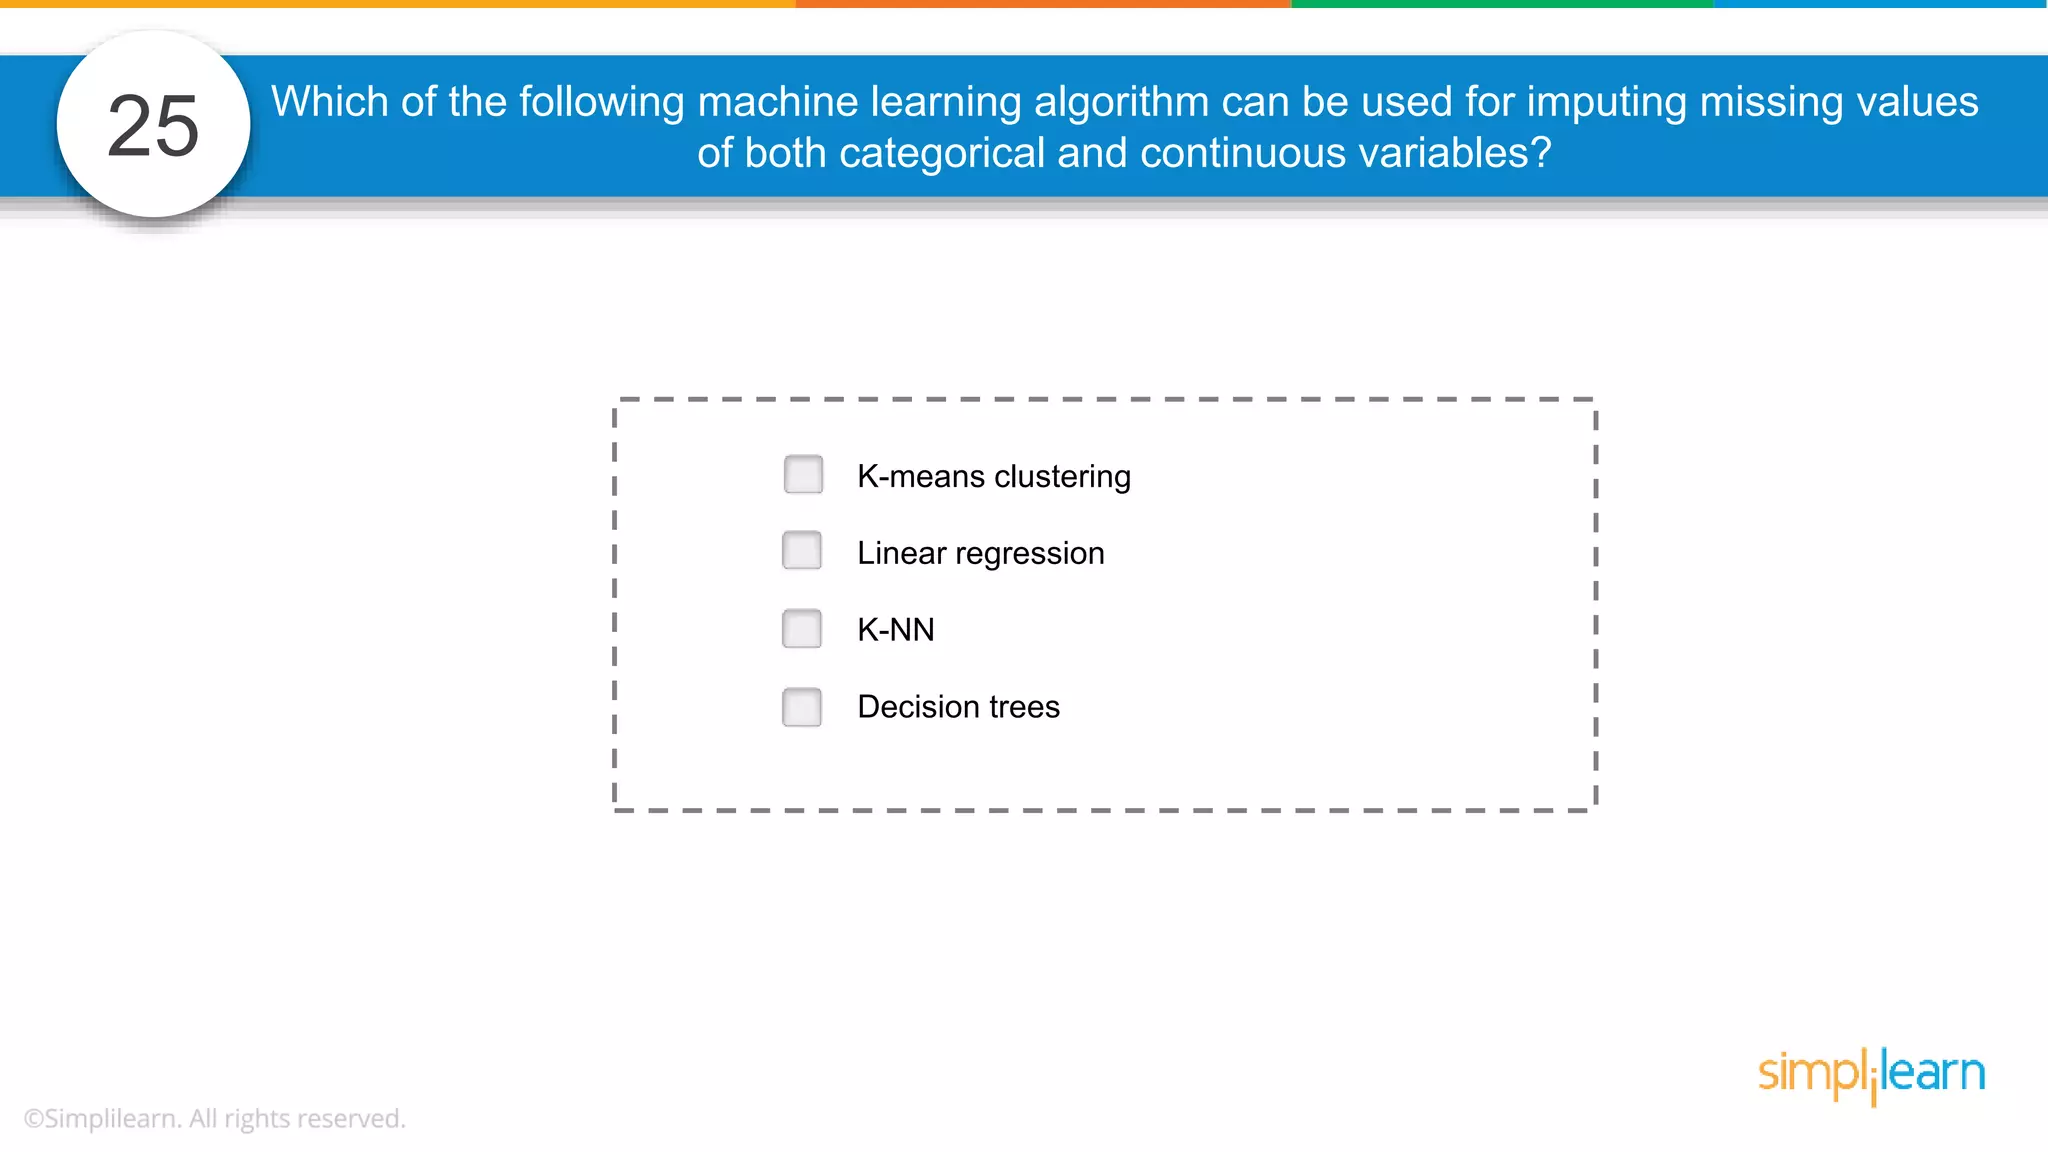
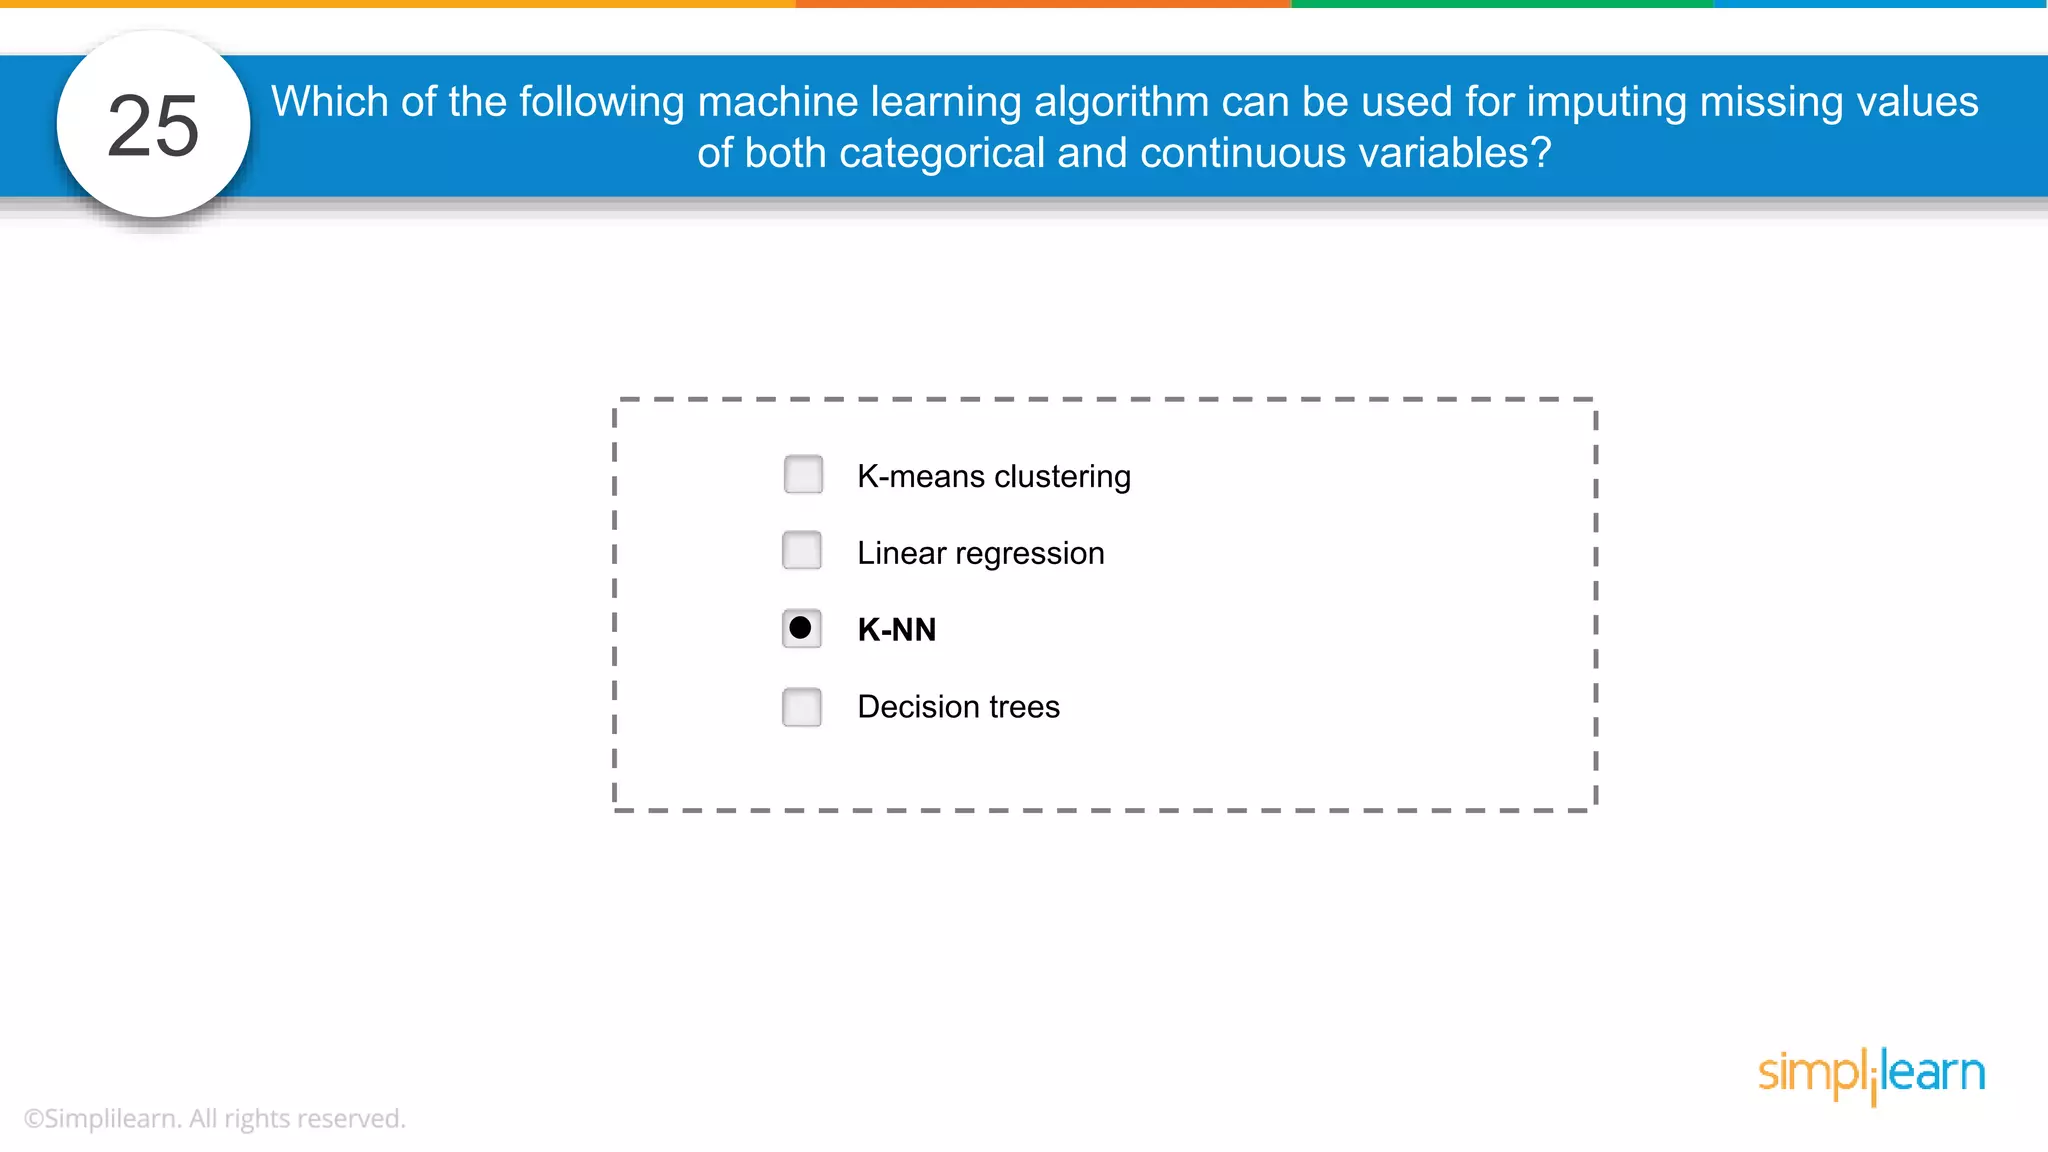
The document contains various data science interview questions covering topics such as measures and dimensions, logistic regression, decision trees, random forests, model overfitting, features selection methods, handling missing data, and accuracy calculations using a confusion matrix. It also includes comparisons between supervised and unsupervised learning, details on recommender systems, dimensionality reduction, p-values, and outlier handling techniques. Key programming examples and methods for evaluating models are presented throughout.