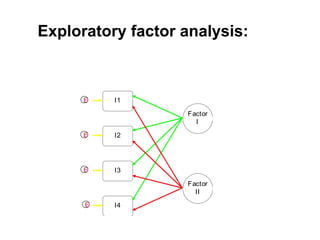
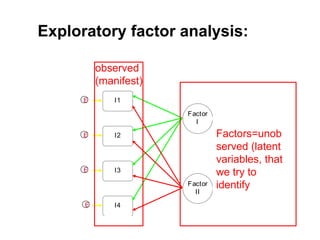
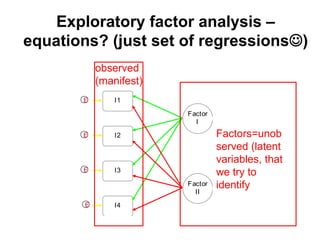
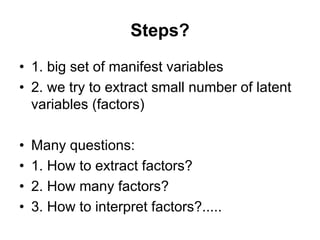
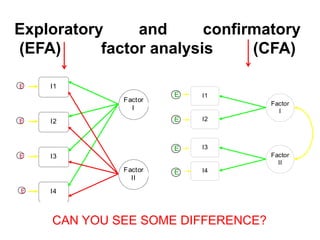
EXPLORATORY FACTOR
ANALYSIS (EFA)
P. Soukup
What is EFA?
• a statistical method used to uncover the
underlying structure of a relatively large
set of variables
• Example: intelligence
• Mainly for phenomenons that can not be
measured directly (other examples?)
Some pictures instead of
equations
Exploratory factor analysis:
I3
I2
I4
I1
Factor
I
Factor
II
E
E
E
E
Exploratory factor analysis:
I3
I2
I4
I1
Factor
I
Factor
II
E
E
E
E
Factors=unob
served (latent
variables, that
we try to
identify
observed
(manifest)
Exploratory factor analysis –
equations? (just set of regressions)
I3
I2
I4
I1
Factor
I
Factor
II
E
E
E
E
Factors=unob
served (latent
variables, that
we try to
identify
observed
(manifest)
Steps?
• 1. big set of manifest variables
• 2. we try to extract small number of latent
variables (factors)
• Many questions:
• 1. How to extract factors?
• 2. How many factors?
• 3. How to interpret factors?.....
Exploratory and confirmatory
(EFA) factor analysis (CFA)
I2
I1
Factor
I
I3
I4
Factor
II
E
E
E
E
I3
I2
I4
I1
Factor
I
Factor
II
E
E
E
E
CAN YOU SEE SOME DIFFERENCE?
Assumptions about data
• set of related continous (cardinal)
variables (how we can measure
relationship?)
• Expectation about some hidden dimension
(factor) behind data
Statistical „test“ for
assumptions
• Bartlett’s test (stat. sig. result=EFA can be
useful)
• KMO (value>0.5) – this is not formal test
just criteria
• Example in SPSS
Steps?
• 1. Extraction of factors (first solution)
• 2. Decision about nr. of factors
• 3. Interpretation: if complicated try rotate
factors
Extraction techniques
Possible approaches
• Principal components (PC):
– the first factor accounts for as much common variance as
possible, then the second factor next most variance, and so on
– mostly used
– does not offer confidence intervals and significance tests
• Maximum likelihood (ML):
– the best choice when data are normally distributed
– permits statistical significance testing
– rarely used
Example in SPSS
Basic results in SPSS
• Percentage of expl. variance
• Factor loadings – i.e. correlation of factor and
manifest variables (main tool for interpretation)
How to select nr. of factors
Many approaches:
• Minimum level of explained variance
• Kaiser's eigenvalue-greater-than-one rule
• Cattell's scree plot
• Example in SPSS
• Problem: Different reccomendations
Interpretation of factors
• Factor loadings are the key
• Correlation between factor and manifest variable
• Interpretation: try to find what the items have in common=
meaning of the factor
• Example in SPSS
• Problem: Impossible to find interpretation
• Solution: Rotation of factors
Rotation of factors
• Orthogonal rotation:
• factors are uncorrelated
• Mostly used technique is varimax
• Problem: for many constructs we expect they are related
• Oblique rotation:
• Factors are related
• Mostly used technique is direct oblimin
• More complicated (more outputs including correlation matrix
for factors)
• Example in SPSS
Saving of factors (factor scores)
• Factor score = value of factor for every unit in my data set
• Continous variable
• Can be used for next analysis
• Replace original (manifest variables)
• Example in SPSS

Exploratory Factor Analysis (EFA), presented by P. Soukup

  • 1.
  • 2.
    What is EFA? •a statistical method used to uncover the underlying structure of a relatively large set of variables • Example: intelligence • Mainly for phenomenons that can not be measured directly (other examples?)
  • 3.
  • 4.
  • 5.
    Exploratory factor analysis: I3 I2 I4 I1 Factor I Factor II E E E E Factors=unob served(latent variables, that we try to identify observed (manifest)
  • 6.
    Exploratory factor analysis– equations? (just set of regressions) I3 I2 I4 I1 Factor I Factor II E E E E Factors=unob served (latent variables, that we try to identify observed (manifest)
  • 7.
    Steps? • 1. bigset of manifest variables • 2. we try to extract small number of latent variables (factors) • Many questions: • 1. How to extract factors? • 2. How many factors? • 3. How to interpret factors?.....
  • 8.
    Exploratory and confirmatory (EFA)factor analysis (CFA) I2 I1 Factor I I3 I4 Factor II E E E E I3 I2 I4 I1 Factor I Factor II E E E E CAN YOU SEE SOME DIFFERENCE?
  • 9.
    Assumptions about data •set of related continous (cardinal) variables (how we can measure relationship?) • Expectation about some hidden dimension (factor) behind data
  • 10.
    Statistical „test“ for assumptions •Bartlett’s test (stat. sig. result=EFA can be useful) • KMO (value>0.5) – this is not formal test just criteria • Example in SPSS
  • 11.
    Steps? • 1. Extractionof factors (first solution) • 2. Decision about nr. of factors • 3. Interpretation: if complicated try rotate factors
  • 12.
  • 13.
    Possible approaches • Principalcomponents (PC): – the first factor accounts for as much common variance as possible, then the second factor next most variance, and so on – mostly used – does not offer confidence intervals and significance tests • Maximum likelihood (ML): – the best choice when data are normally distributed – permits statistical significance testing – rarely used Example in SPSS
  • 14.
    Basic results inSPSS • Percentage of expl. variance • Factor loadings – i.e. correlation of factor and manifest variables (main tool for interpretation)
  • 15.
    How to selectnr. of factors Many approaches: • Minimum level of explained variance • Kaiser's eigenvalue-greater-than-one rule • Cattell's scree plot • Example in SPSS • Problem: Different reccomendations
  • 16.
    Interpretation of factors •Factor loadings are the key • Correlation between factor and manifest variable • Interpretation: try to find what the items have in common= meaning of the factor • Example in SPSS • Problem: Impossible to find interpretation • Solution: Rotation of factors
  • 17.
    Rotation of factors •Orthogonal rotation: • factors are uncorrelated • Mostly used technique is varimax • Problem: for many constructs we expect they are related • Oblique rotation: • Factors are related • Mostly used technique is direct oblimin • More complicated (more outputs including correlation matrix for factors) • Example in SPSS
  • 18.
    Saving of factors(factor scores) • Factor score = value of factor for every unit in my data set • Continous variable • Can be used for next analysis • Replace original (manifest variables) • Example in SPSS