Downloaded 140 times

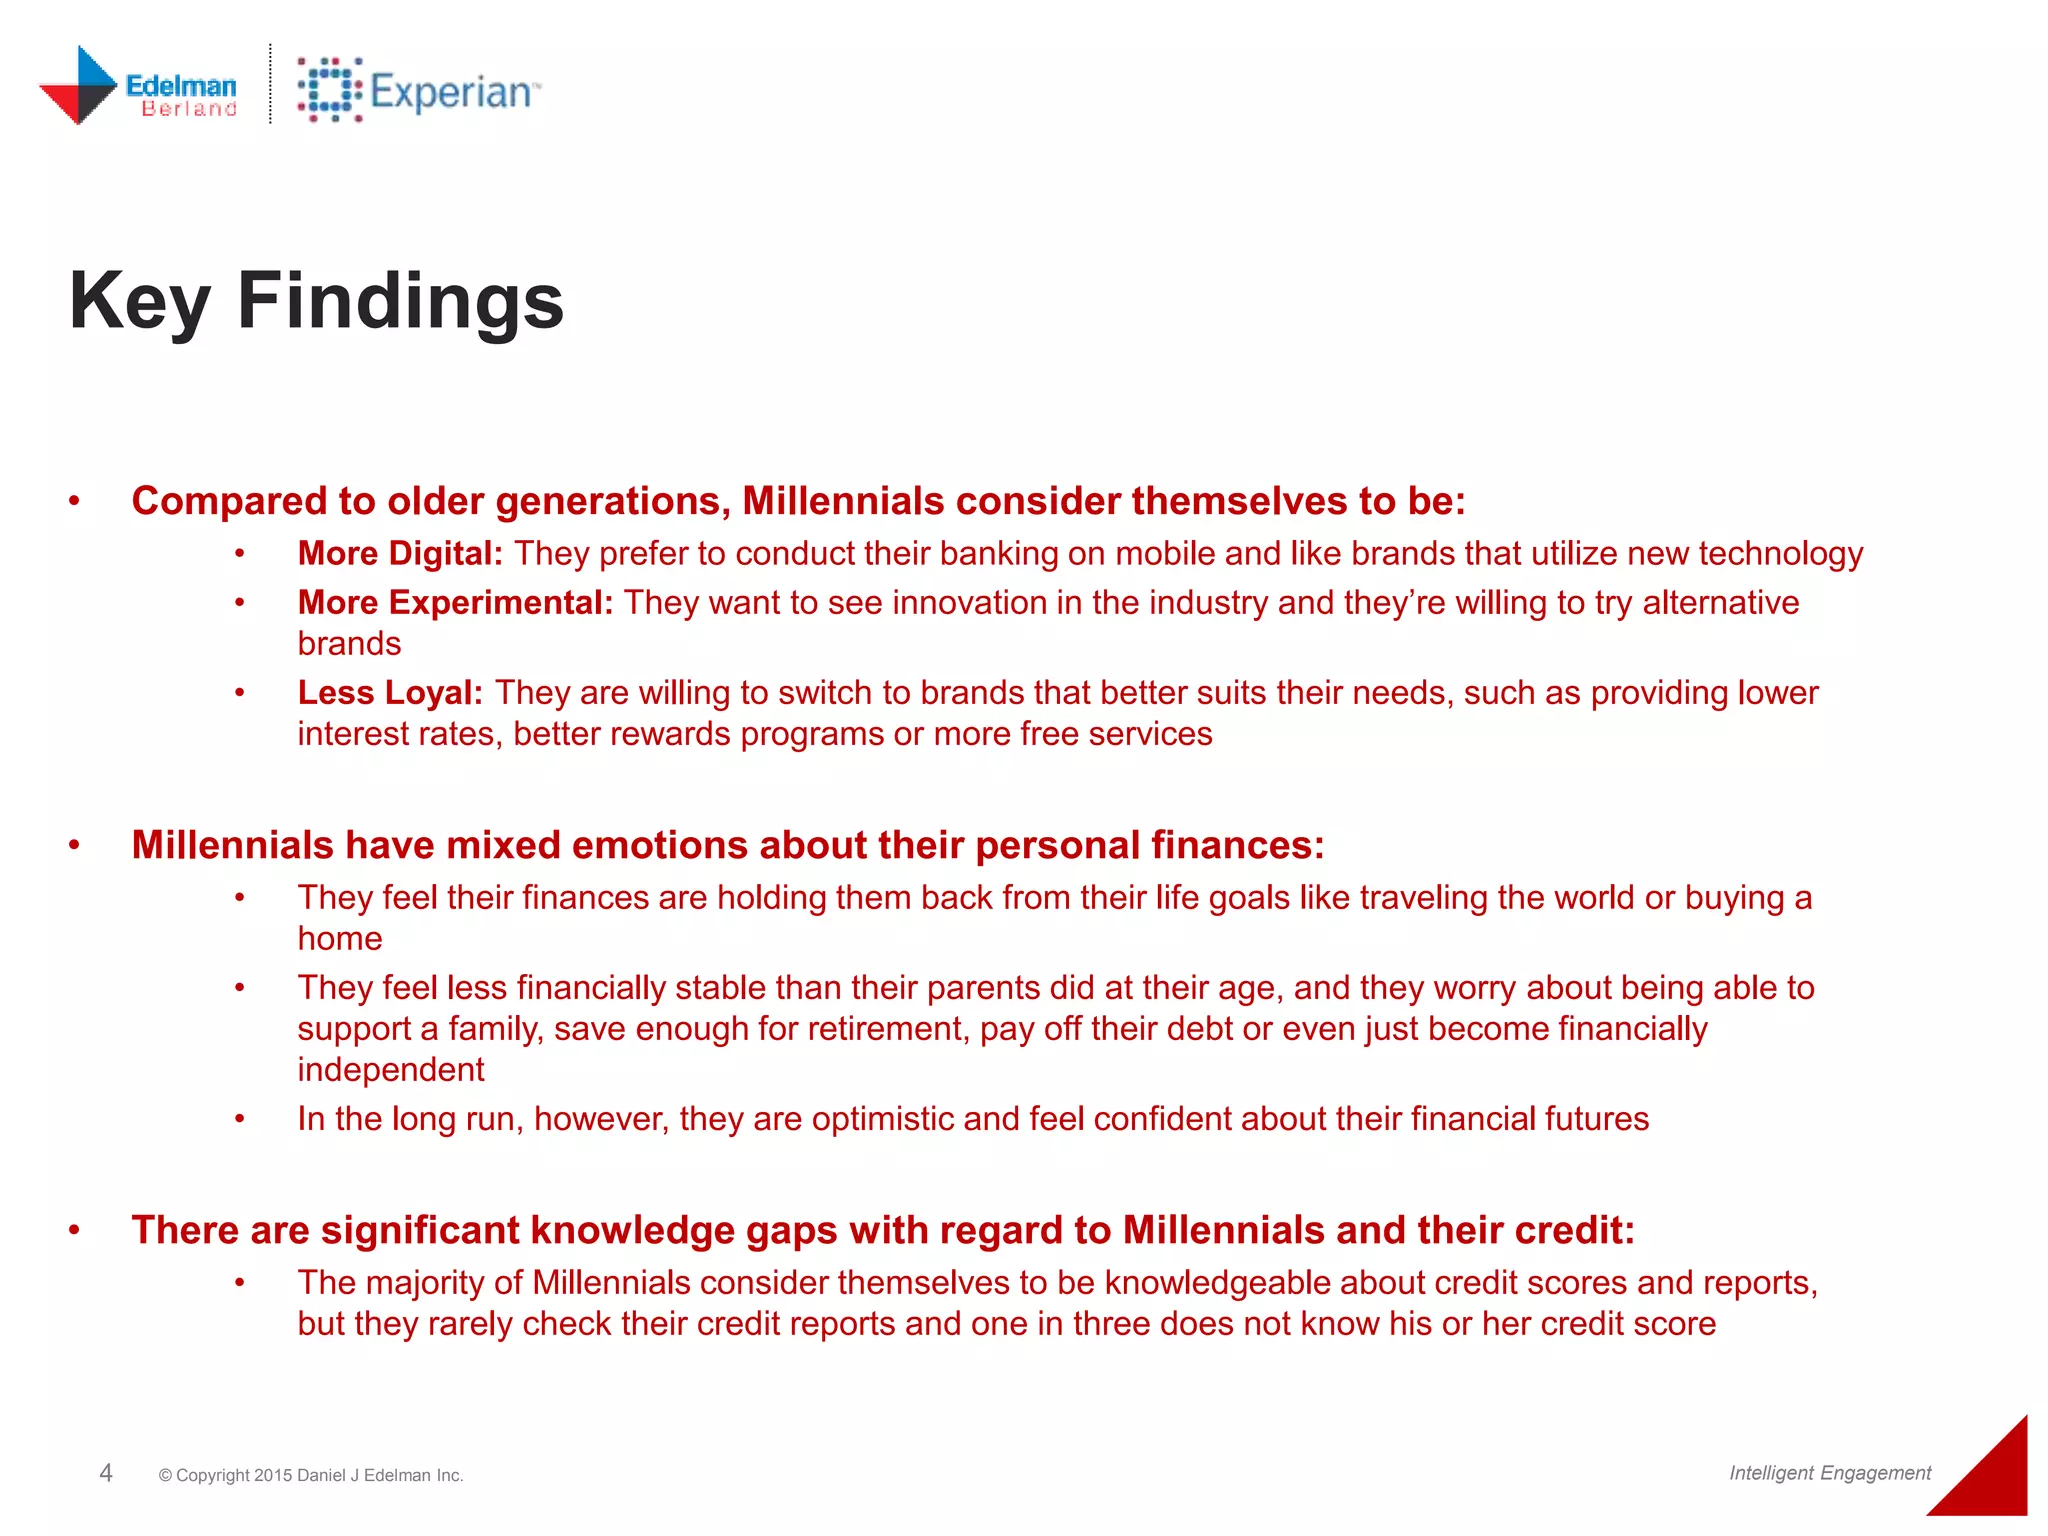
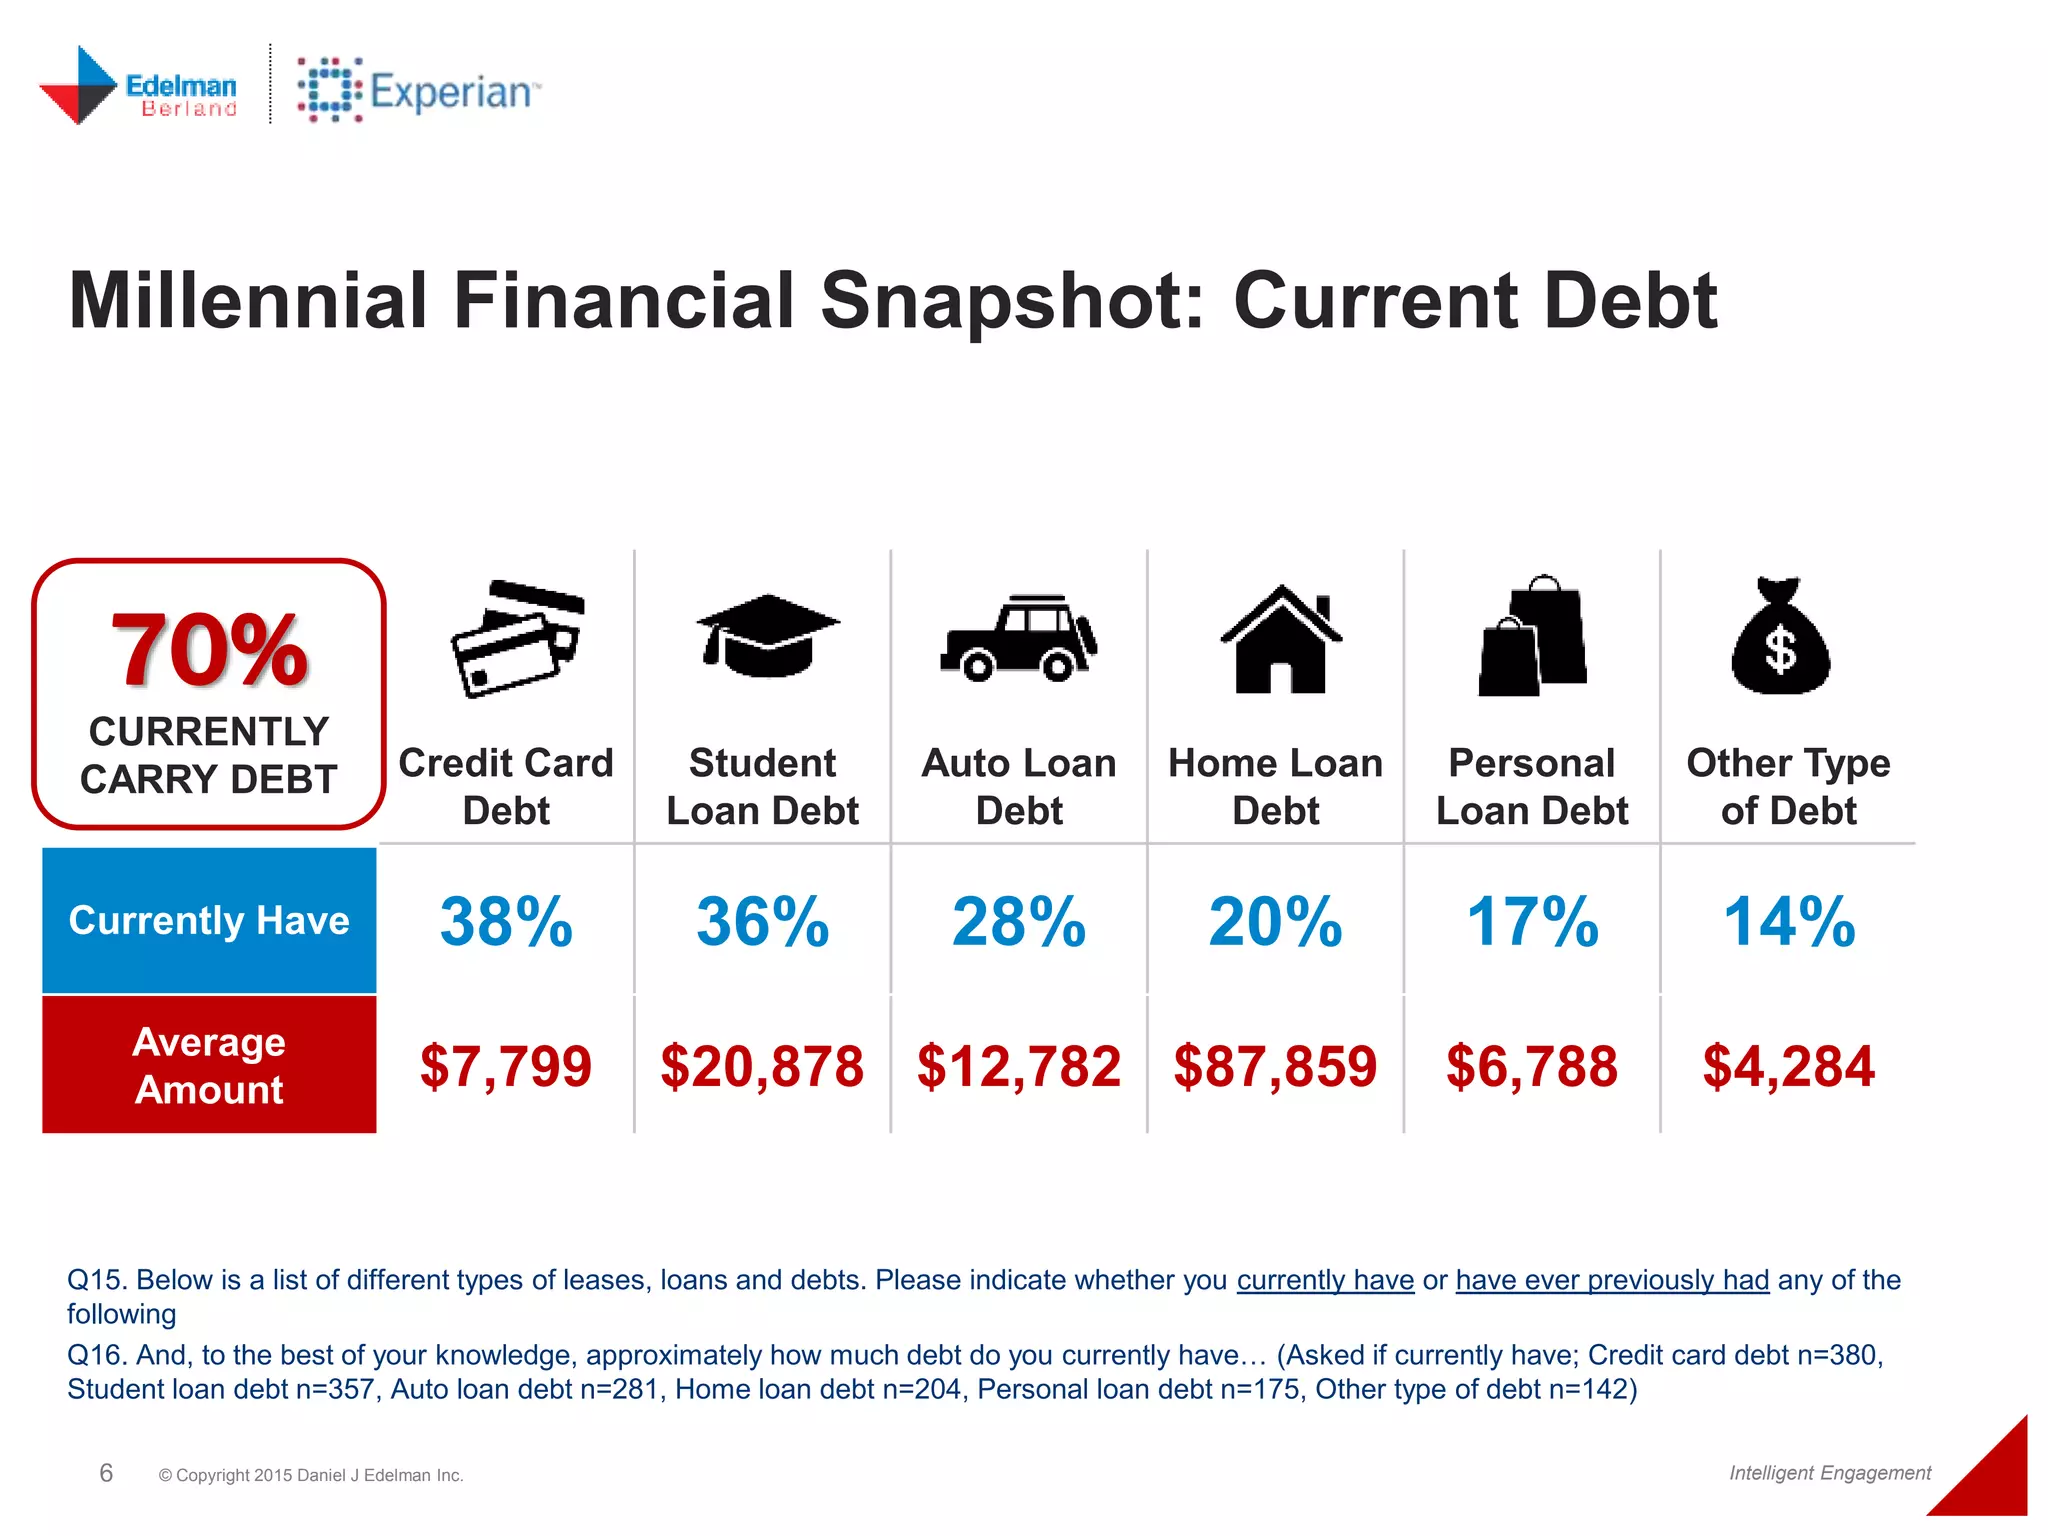

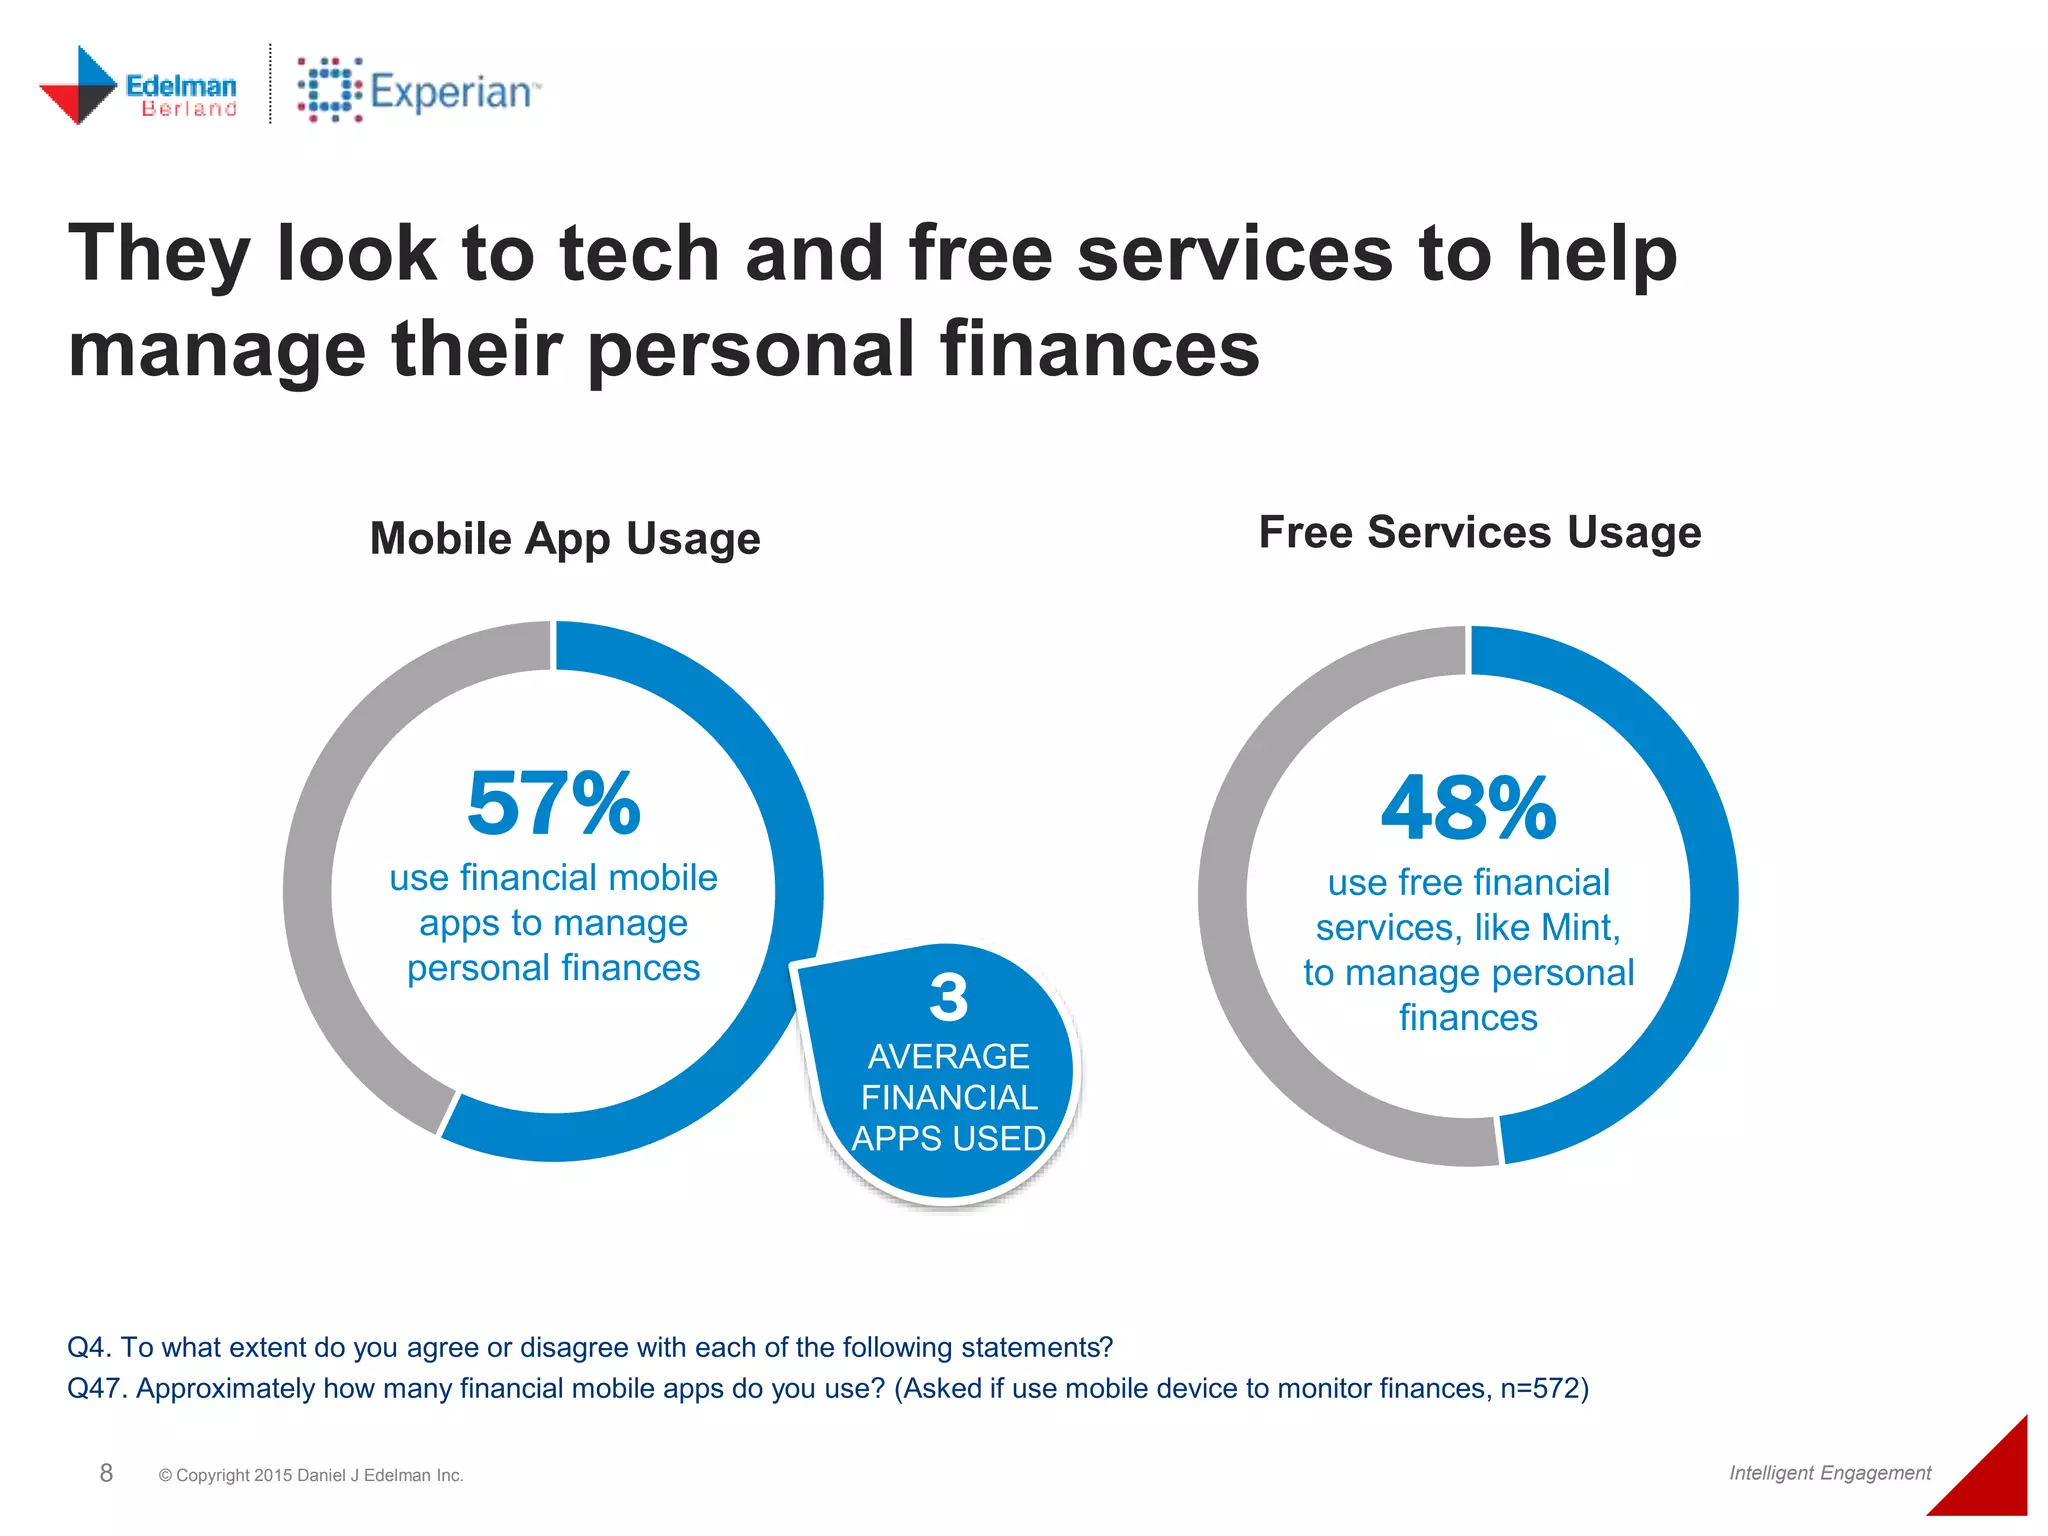
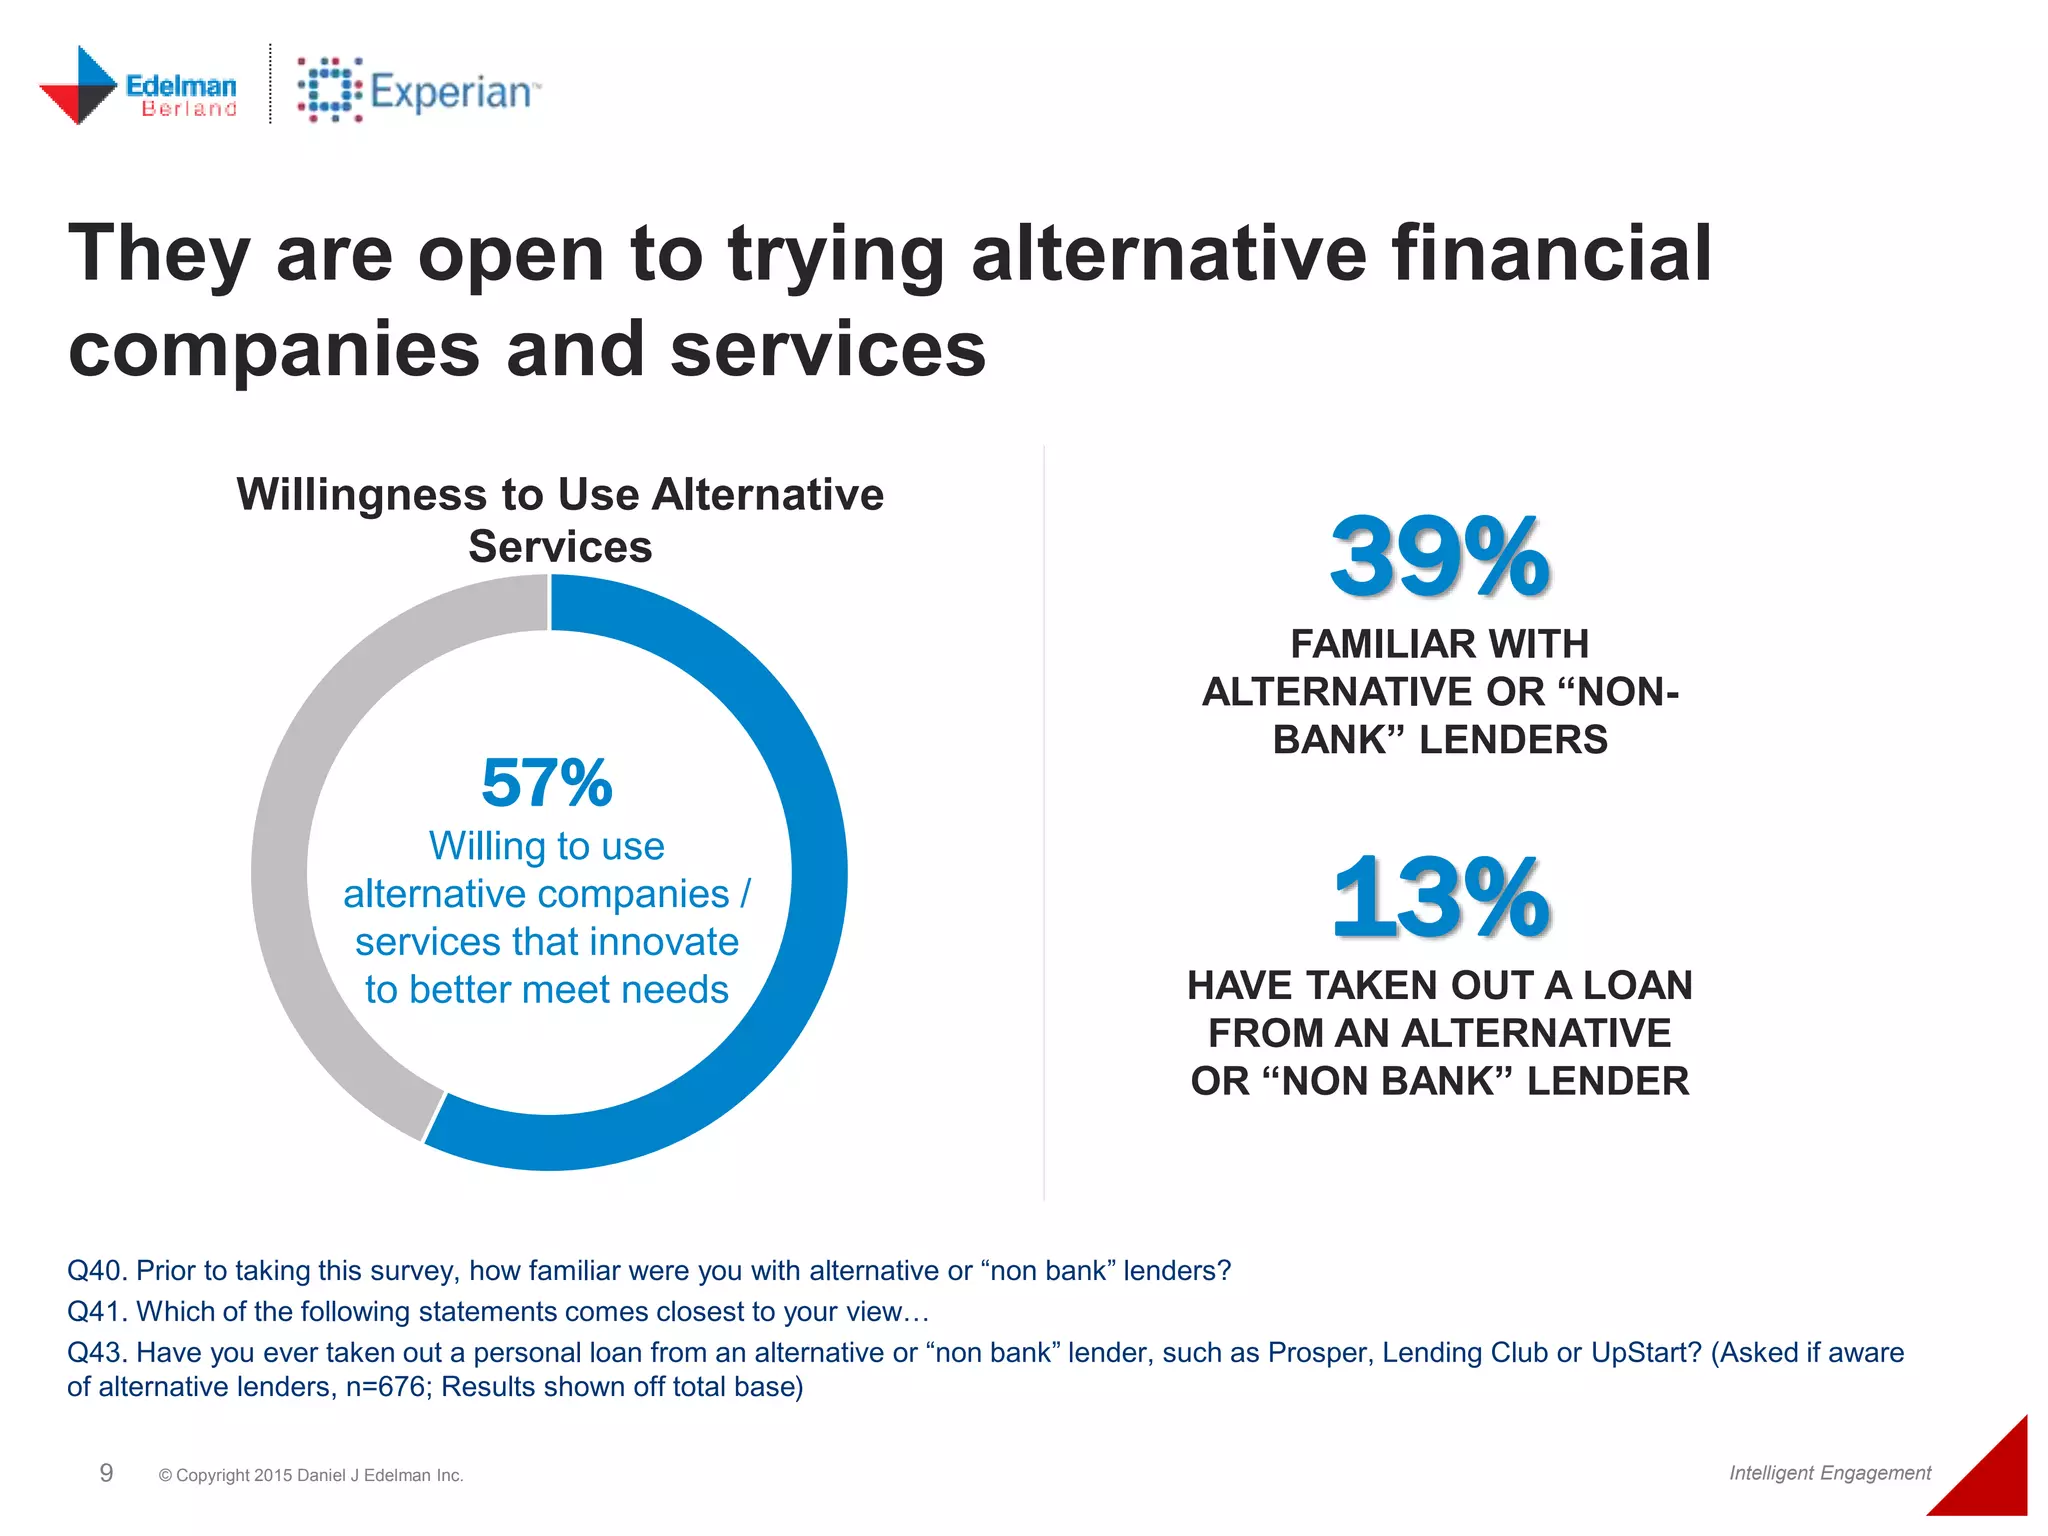
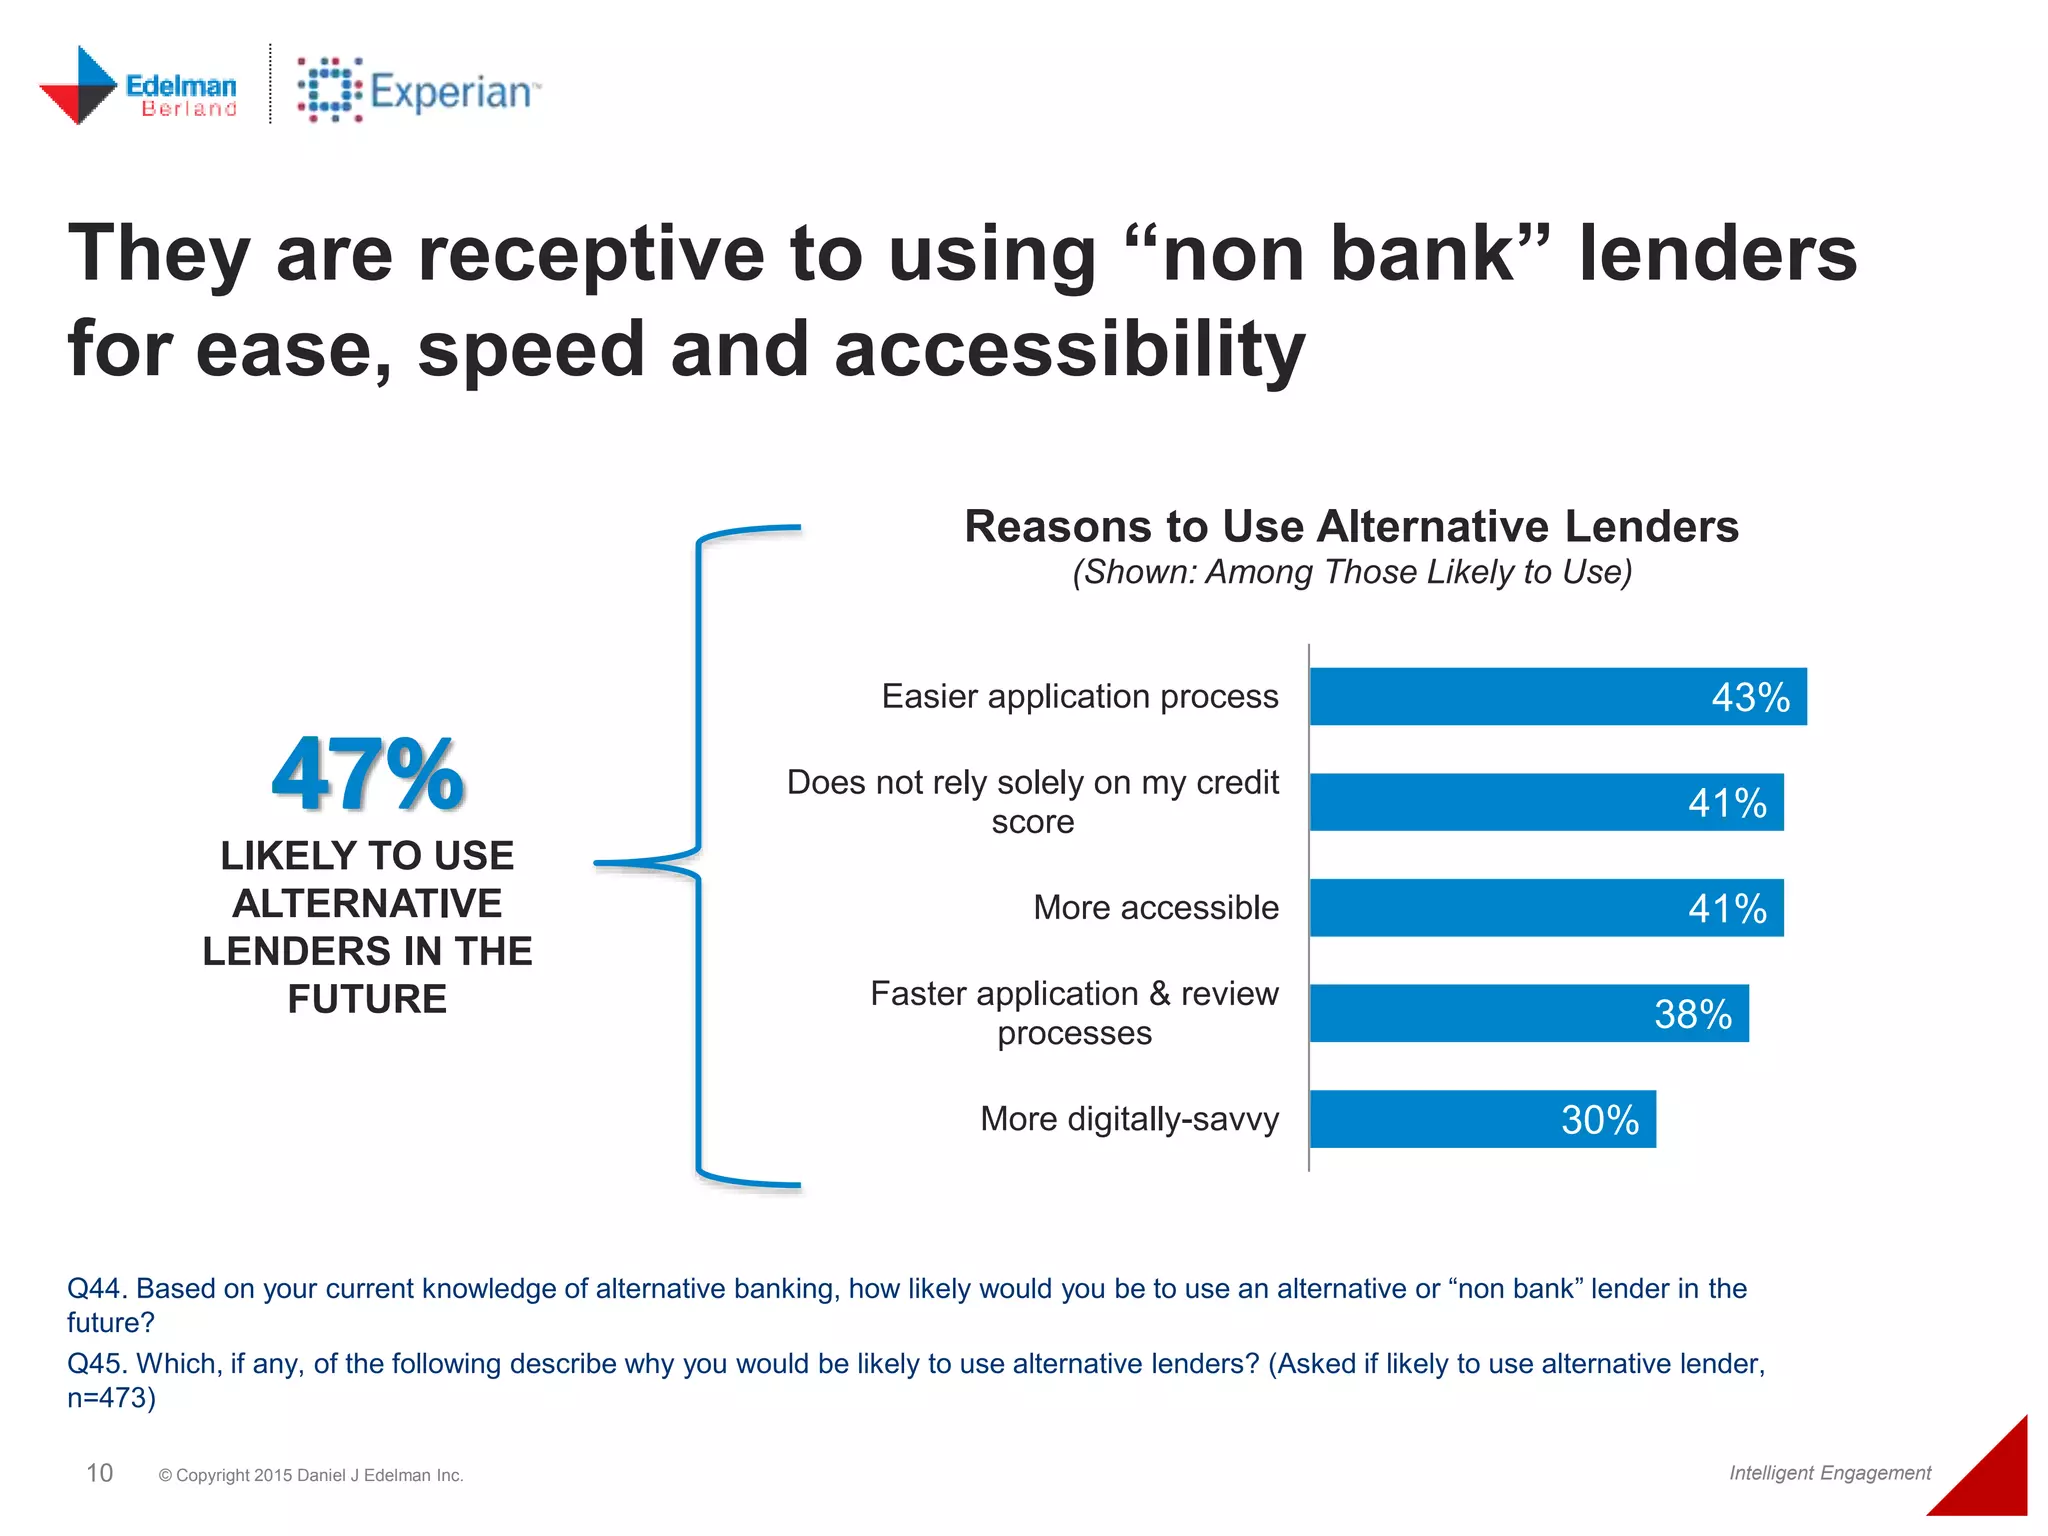
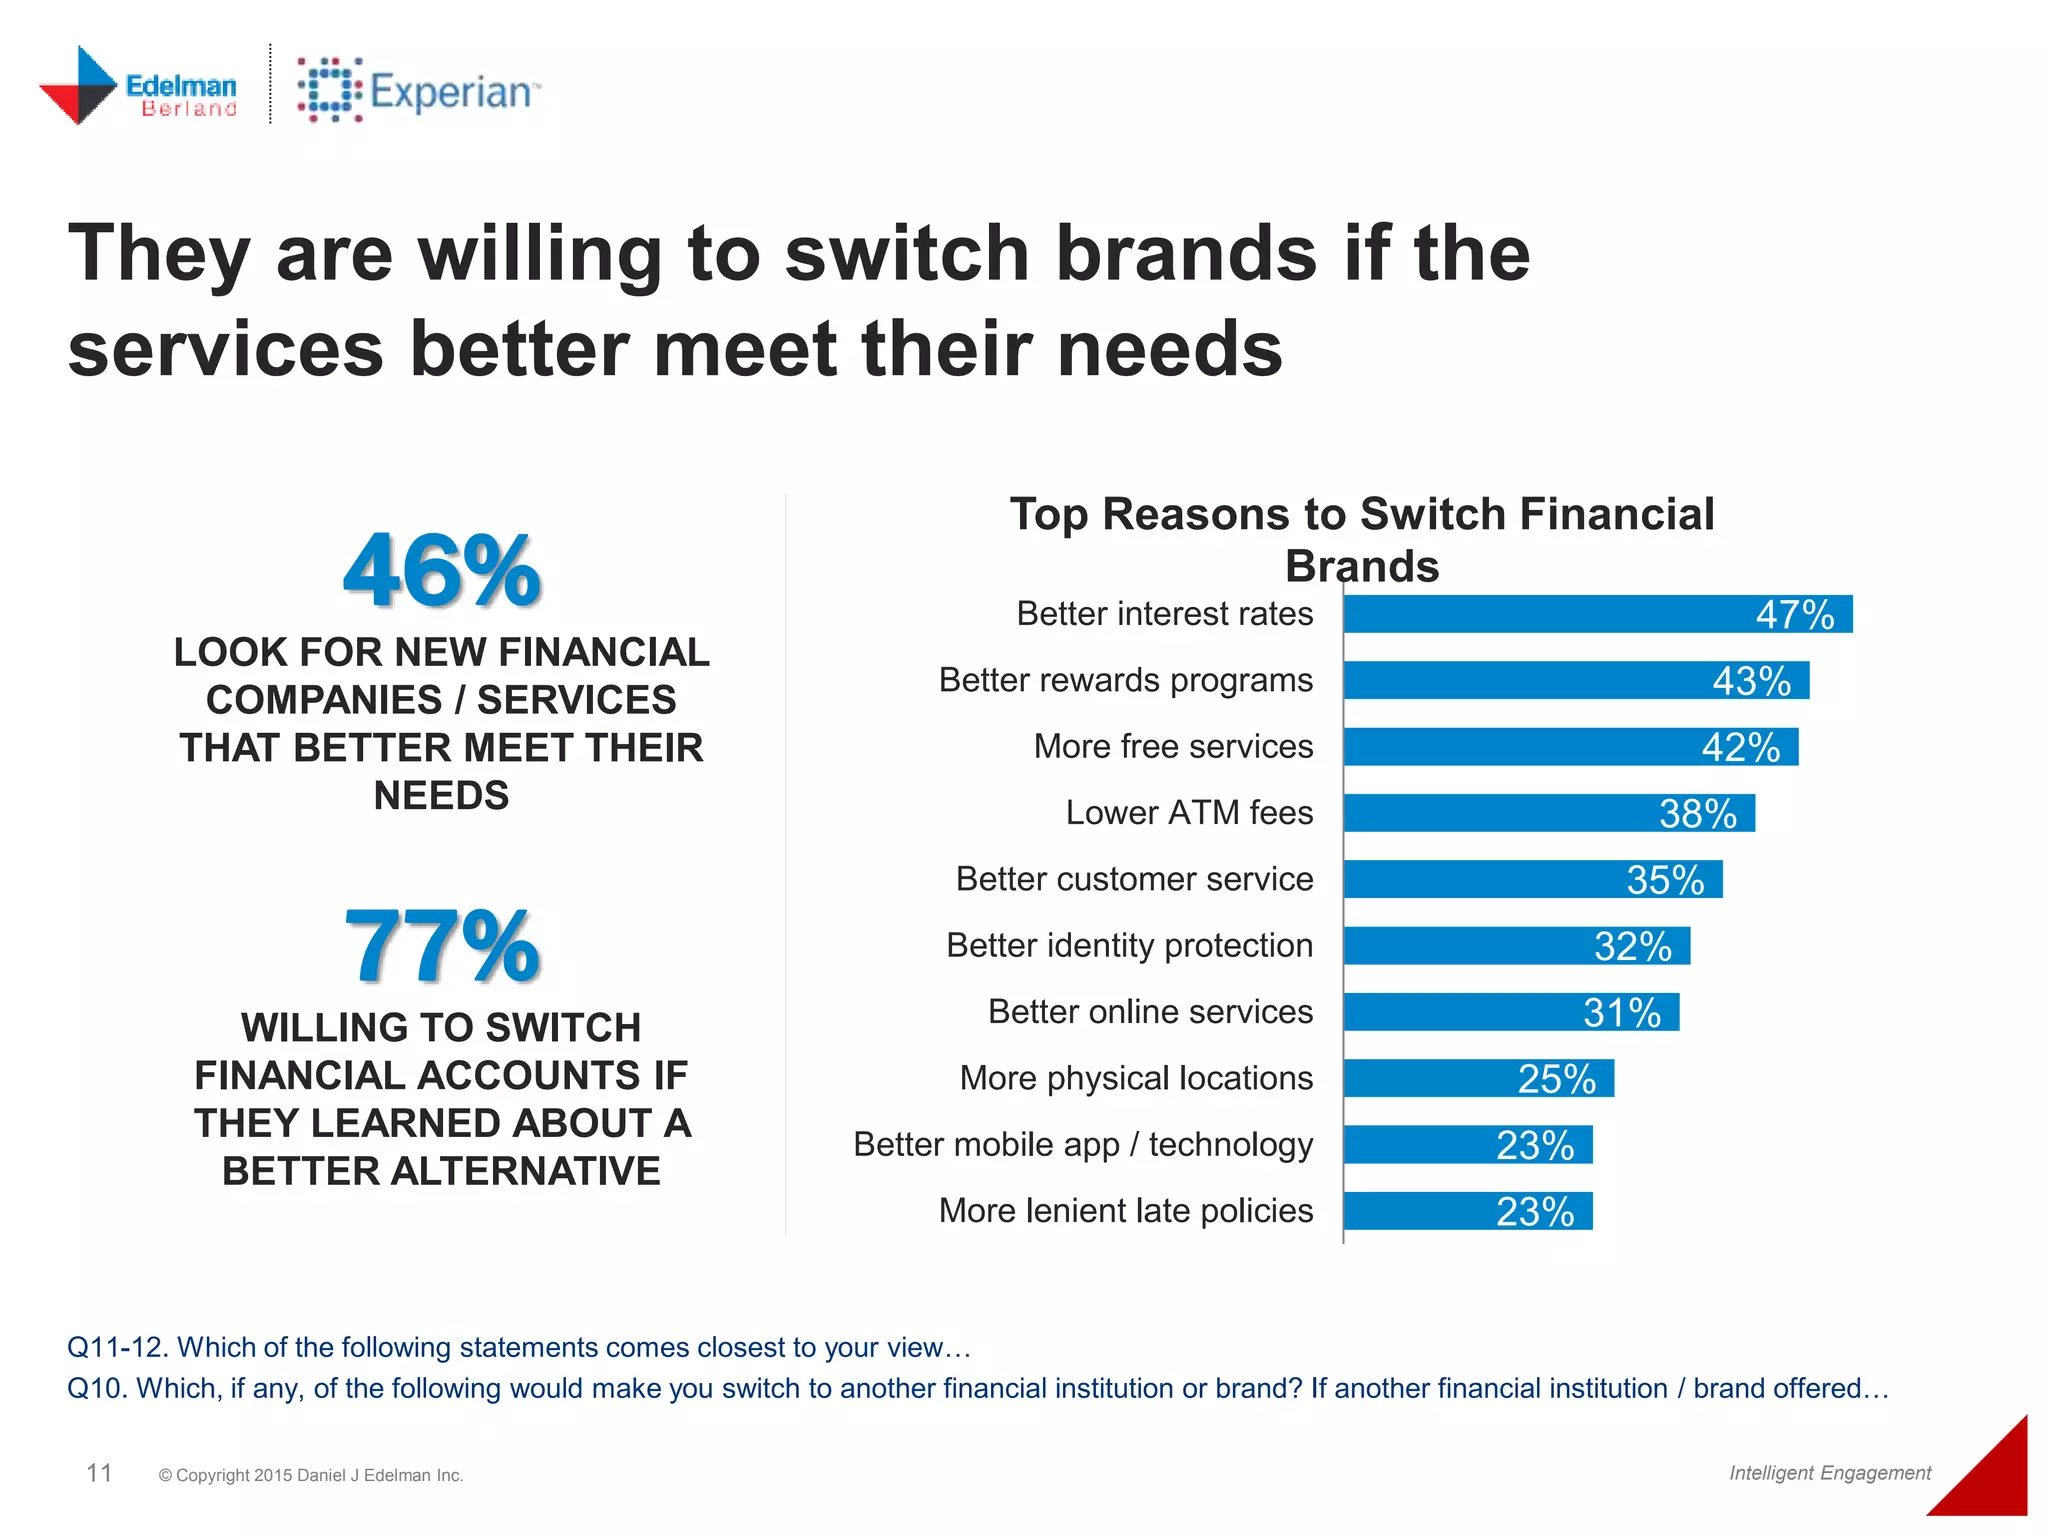

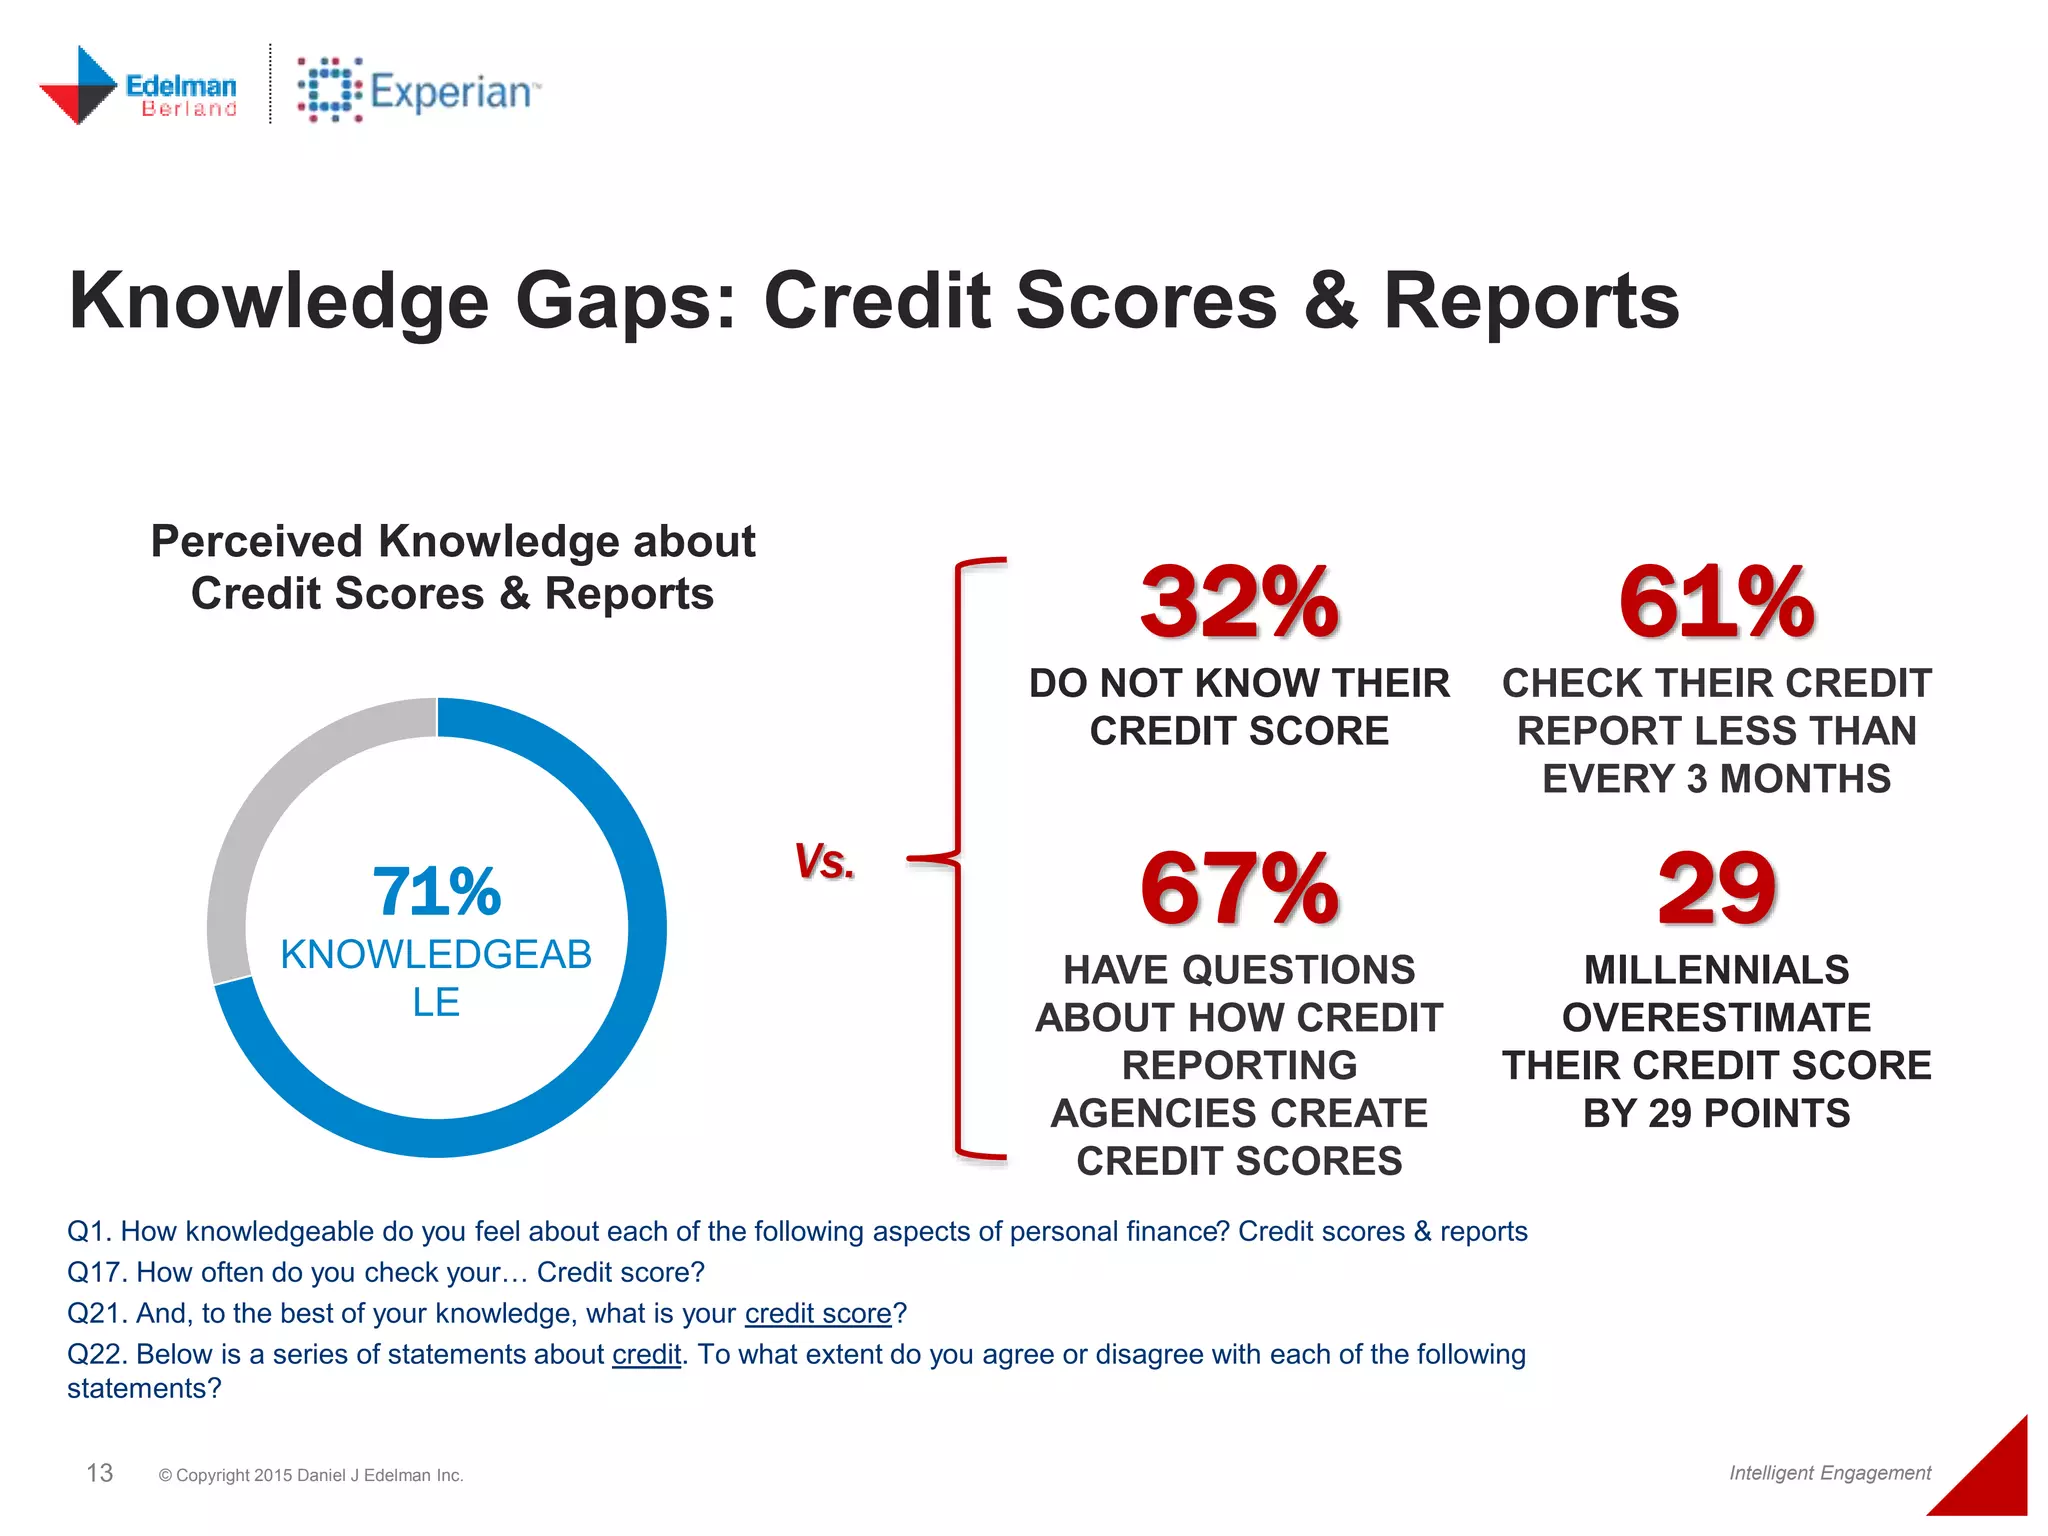
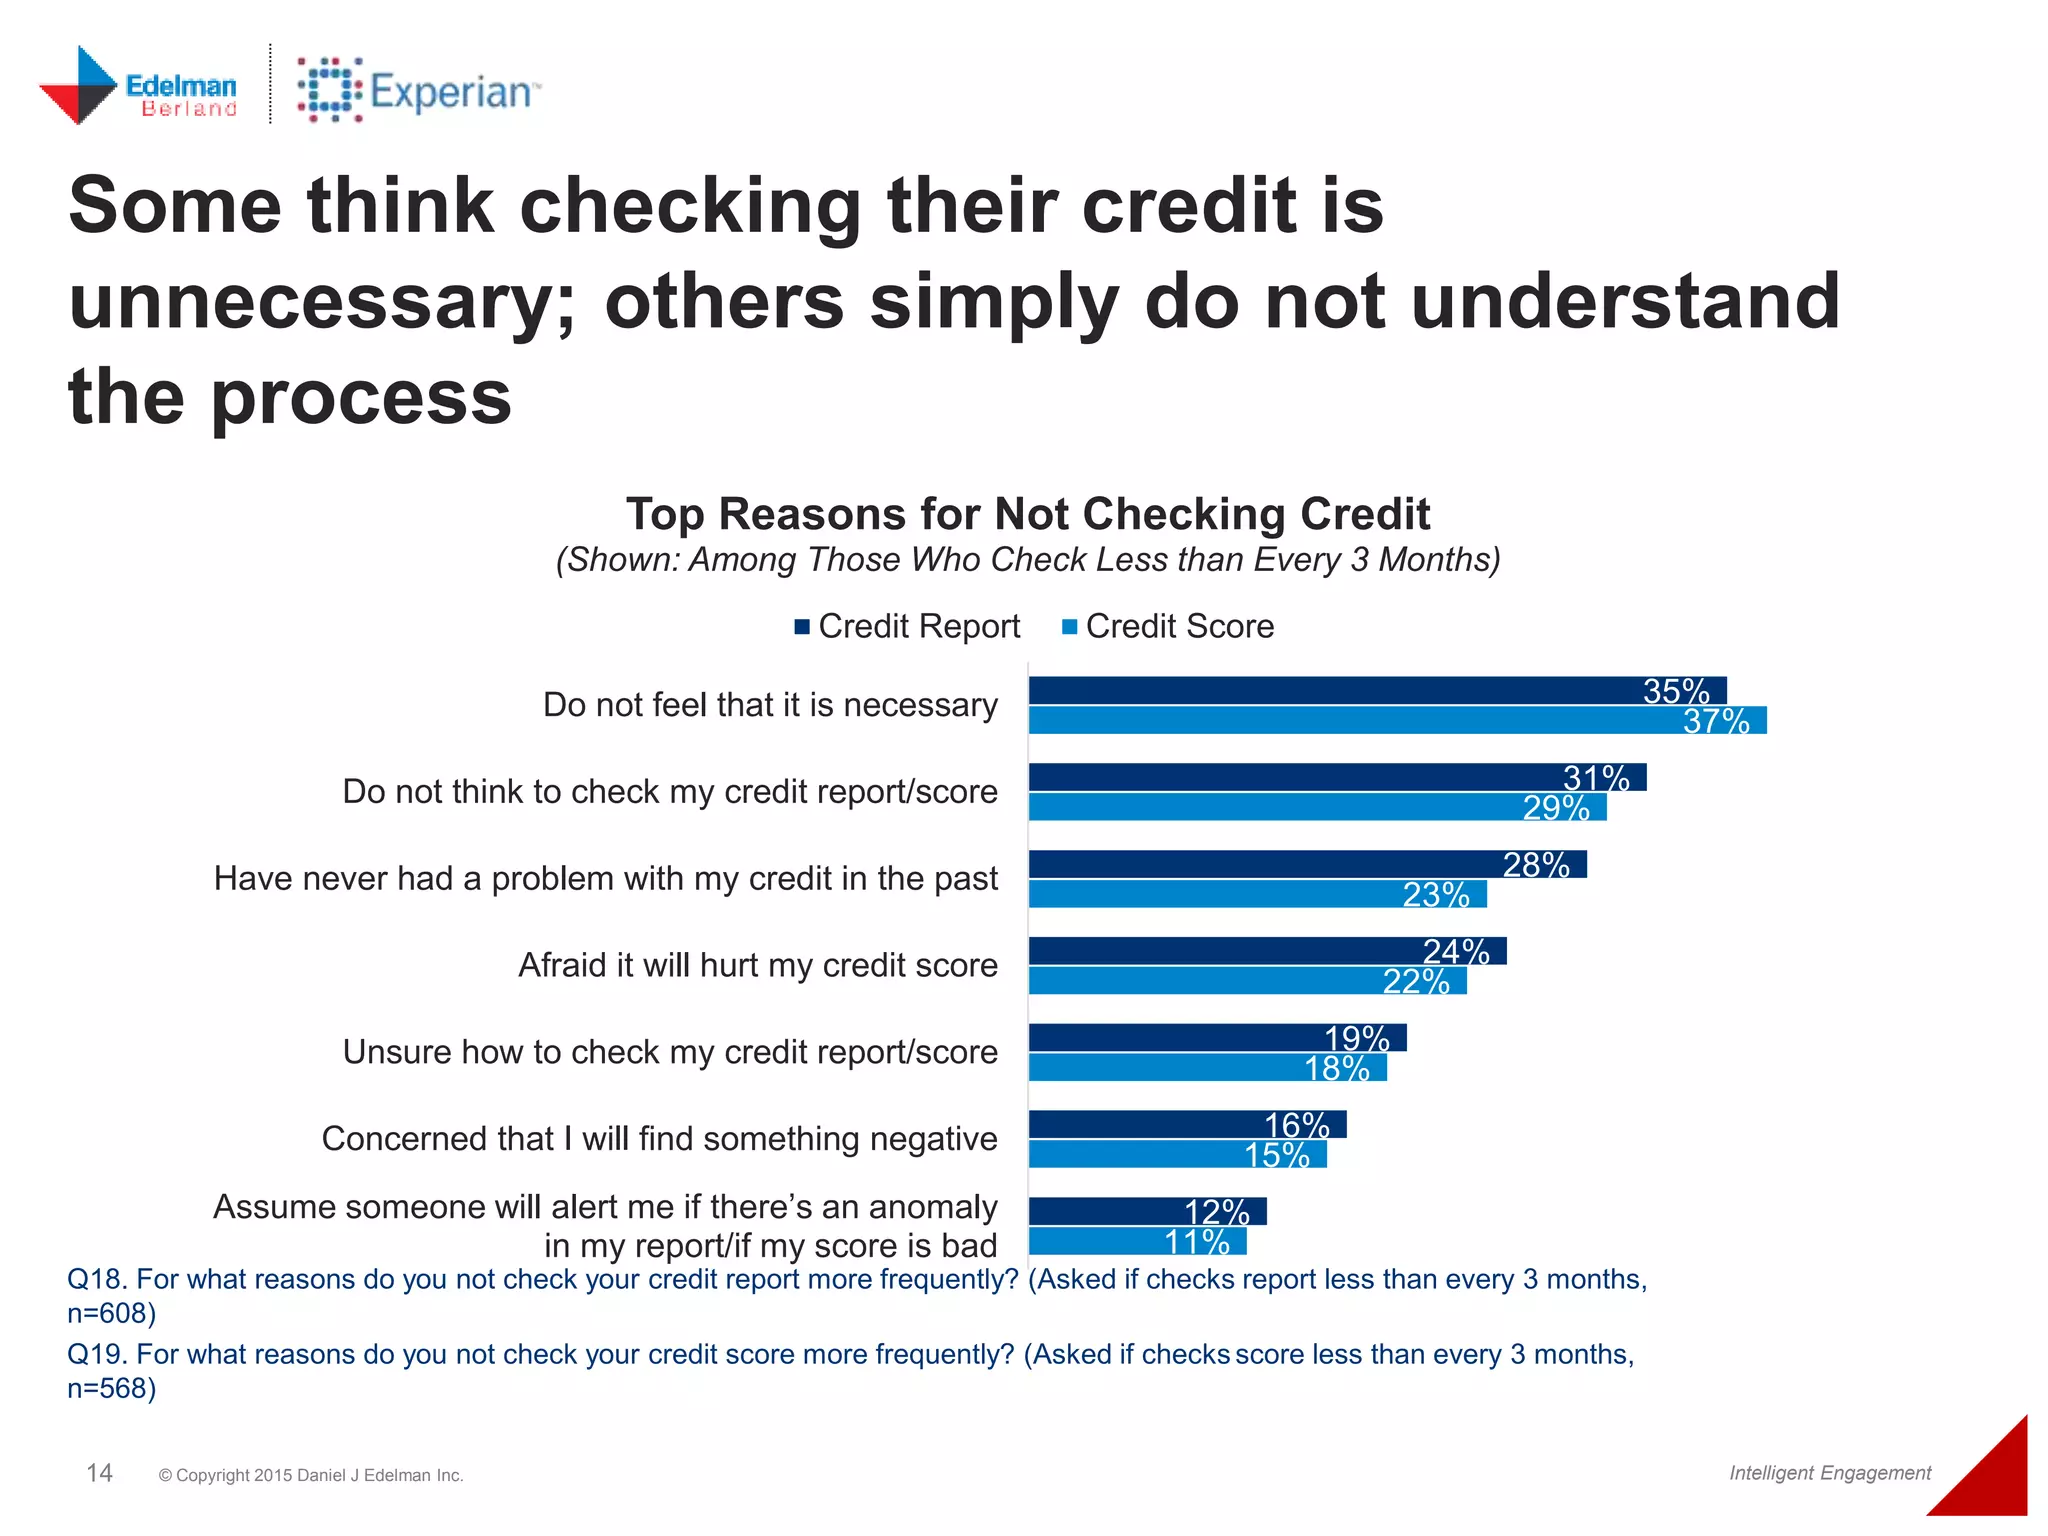


The 2015 Millennial Credit & Finance Survey reveals that millennials view themselves as more digital, experimental, and less loyal compared to older generations, and experience mixed emotions about their financial stability. While many feel knowledgeable about credit, significant gaps exist as they rarely check their scores and often overestimate their credit knowledge. Despite concerns about their financial futures, a majority remain optimistic, with many expressing willingness to switch financial services for better offerings.


