Download to read offline


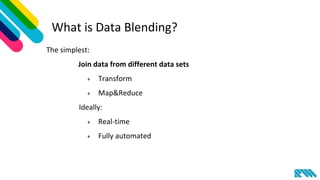
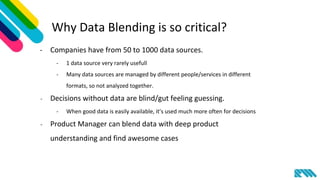
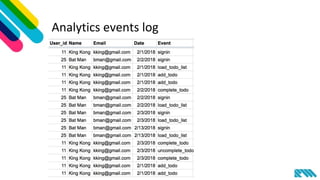
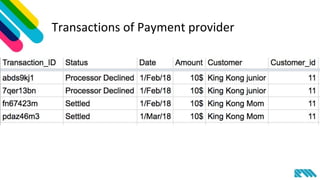
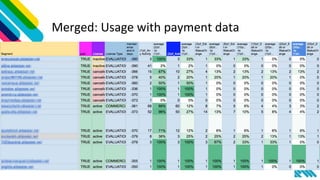

1) Data blending is the process of joining and transforming data from multiple different data sets and sources to provide a more complete picture for making critical business decisions. 2) It is important because companies have dozens to hundreds of different data sources that are rarely analyzed together, leaving decisions to be made without a full picture. 3) Skills needed for data blending include using tools like Google Sheets to perform joins, groups, and transforms on data from databases and other sources to produce merged data sets for analysis.