This document discusses the importance of data preparation for business intelligence and analytics. It notes that analysts currently spend 80% of their time preparing data manually in Excel before analyzing it. This process is error-prone and time-consuming. Alternatively, companies can build expensive data warehouses which often take months and have outdated data by the time they are complete. The document promotes a new approach of using self-serve data preparation tools that allow analysts to quickly and easily blend data from multiple sources for visualization and insightful analysis.
Streaming and Visual Data Discovery for the Internet of ThingsDatawatchCorporation
Sensor devices and their associated data streams are rapidly becoming a big source of differentiation for organizations that can effectively harness this information to drive new insights and take action. The breakthrough is enabled by new solutions for applying visual data discovery to streaming data in motion. This session will focus on industrial analytics and how best to apply new technologies that drive synergies between IT and OT.
Metadata Mastery: A Big Step for BI ModernizationEric Kavanagh
Modernizing data management is on everyone’s mind today. Making the shift from data management practices of the BI era to modern data management is essential but it is also challenging. Whether you’re updating the back end by migrating your data warehouses to the cloud or advancing the front end with a shift from legacy BI tools to self-service analysis and visualization, it is critical to know the data that you have and to understand data lineage. Data inventory, data glossary, and data lineage are all metadata dependent. But legacy BI metadata is typically proprietary, non-integrated, and collected inconsistently by a variety of disparate tools. The metadata muddle is a serious inhibitor to modernization efforts. Metadata consolidation and centralization are the keys to overcoming this barrier. What if all this were automated?
Join us to learn:
- How a smart and innovative new technology resolves metadata disparity
- How metadata management automation accelerates modernization efforts
- How metadata management automation reduces errors and improves quality of results from data management modernization projects
- How metadata management automation and data cataloging work together to help you move rapidly to the next generation of BI and analytics
DMTI Spatial Location Hub Analytics: big data, analytics, visualizationDMTI Spatial
This changes everything. When it comes to data analytics, accuracy and data quality is crucial. Location Hub Analytics ® is the only self-service analytics engine that leverages Canada’s most robust, accurate and up-to-date location-based data for precise, compelling, unbiased results.
CLEANSE
Location Hub Analytics automatically validates, standardizes, and geocodes your address database. Each record is assigned a Unique Address Identifier (UAID®)
ENRICH
Location Hub Analytics enriches your data with Canadian demographics information for further analysis and greater customer intelligence.
ANALYZE
Location Hub Analytics quickly processes and analyzes your data, objectively revealing meaningful patterns and trends
INFILL
Location Hub Analytics helps you generate new prospect lists by infilling the addresses within a specific territory that are not in your current database.
VISUALIZE
Unlike other analytics engines, Location Hub Analytics allows you to visualize and interact with your results on a map for better data profiling
SHARE
Quickly and easily share your customized report with key stakeholders
Organizations want to use all the data available to them for analytics. But they’ve been thwarted by data silos and top-down, mostly manual approaches to unifying data for analytics. A new approach, based on machine learning combined with human expert sourcing, dramatically speeds analytics’ time-to-value. It automates data unification end-to end: from finding and connecting diverse data to interactive consumption by virtually anyone using any analytic tool.
Augmented analytics will push the analytics adoptionPolestarsolutions
The world of data analytics is no longer restricted to data scientists, IT, and analysts. Augmented analytics combines the best aspects of ML and human curiosity to assist users get quicker insights, consider data from unique angles, increase productivity and assist users of all skill levels to make smarter decisions based on AI analytics.
Organizations today are both blessed and cursed by data. But to get insights, you need to unlock the data you have. If you are like most analysts, you are spending hours and hours struggling with “dirty data,” data that needs to be joined together, and data that is in the wrong shape for visualization. And each time the data changes, you have to redo your work. You’re stuck in the “gunk” of preparing data, and you never get out of it to do what you really need to be doing, which is analyzing and visualizing your data and realizing new, deeper insights! Learn more about alteryx tableau integration by checking out the presentation.
Usually, DataOps means applying DevOps principles to existing data analytics projects. We accidentally reversed it, taking a DevOps initiative and catalyzing adoption of data-driven practices across our company.
What started as a practical initiative to bring better reliability and visibility to our software product had the unexpected effect of catalyzing a transformation that helped our organization become more data-driven across the company. What we learned in the process was how and why DevOps principles can naturally expand the role of a traditional operations team and bring wider culture change to the organization.
Tamr | MDM and the Data Unification ImperativeTamr_Inc
A successful digital information strategy depends on being able to find, connect and consume diverse data sources repeatably and at scale. But top-down, deterministic data unification approaches (such as ETL, ELT and MDM) weren’t designed to scale to the variety of hundreds, thousands or tens of thousands of data silos. A new bottom-up, probabilistic approach to data unification complements MDM by providing the agility and scalability to exploit data variety.
Stop manually entering static data into Excel from your ERP. Spreadsheet Server connects to over 40 ERP systems delivering live ERP data into Excel. The distribution manager component of Spreadsheet Server even distributes the right reports, to the right people, at the right time.
Eliminate re-keying errors and having to manually export from your ERP to Excel. Save hours on ERP reporting by leveraging the dynamic spreadsheet methodology of Spreadsheet Server by Global Software, Inc.
6 levels of big data analytics applicationspanoratio
6 levels of big data analytics applications: what you can expect from descriptive, investigative, advanced, adaptive, predictive, prescriptive analytics applications.
Stop manually entering static data into Excel from your ERP. Spreadsheet Server connects to over 40 ERP systems delivering live ERP data into Excel. The distribution manager component of Spreadsheet Server even distributes the right reports, to the right people, at the right time.
Eliminate re-keying errors and having to manually export from your ERP to Excel. Save hours on ERP reporting by leveraging the dynamic spreadsheet methodology of Spreadsheet Server by Global Software, Inc.
To be successful as a data science team, we need to continuously deliver data-driven insights and data products that generate business value. Identifying the best opportunities and building solutions that actually get used in production requires very close collaboration with business users and subject matter experts. What can we learn from agile software development methodologies, and how can we apply them to data science projects?
Excel-based SAP Reporting: Maximum potential, maximum efficiencyGlobal Software, Inc.
When it comes to capturing finance, operational and budgeting data for reporting, live-excel based Spreadsheet Server and Enterprise Budgeting are the ideal solutions. Take a look at this presentation to learn how Spreadsheet Server for use with SAP empowers the user to create and update their own reports without manual re-keying of data or IT intervention.
A spreadsheet is a great tool for certain jobs. But you may use spreadsheets for tasks that are beyond their capabilities, causing problems that range from small annoyances to costly business errors.
Learn about the limitations of spreadsheets, and find out how easy it is to carry out your analytical tasks with IBM SPSS Statistics.
Big data business analytics | Introduction to Business AnalyticsShilpaKrishna6
Business analytics is the iterative, methodical and exploration of an organisations data with an emphasis on statistical analysis. Successful business analytics depends on data quality, skilled analysts who understand the Technologies and the business and an organisational commitment to using data to gain insight that informed business decisions.
This is about Facebook Ads. The slides include what is FB Ads, what is Facebook Local, what is the differences between Boost, promote, and regular ads. Briefly look at creating an ad and what makes a good ad.
Presentation - Marketing Analysis of Casio ( G-Shock)Min Soe Paing
We created this presentation at 2015 for our business management class. Presentation is about marketing analysis of Casio Company's famous product "G-Shock". Most of the information and data are reference from Google. I'm just 18 years old when I participant in this presentation.
We are happy to read the feed back on this.
Thanks you so much, guys!
Welcome feedback and idea - minsoepaiz.new@gmail.com
Business Intelligence (BI): Your Home Care Agency Guide to Reporting & InsightsAlayaCare
This 15-page document will inspire and guide you through WHAT business intelligence (BI) is, and WHY data analytics should be top of mind for your home care agency. Furthermore, this guide will help you answer HOW you know it’s time to consider looking into a BI tool, while providing you with a few tips and tricks to get started.
Turning Big Data Analytics To Knowledge PowerPoint Presentation SlidesSlideTeam
This complete deck covers various topics and highlights important concepts. It has PPT slides which cater to your business needs. This complete deck presentation emphasizes Turning Big Data Analytics To Knowledge PowerPoint Presentation Slides and has templates with professional background images and relevant content. This deck consists of total of twenty two slides. Our designers have created customizable templates, keeping your convenience in mind. You can edit the colour, text and font size with ease. Not just this, you can also add or delete the content if needed. Get access to this fully editable complete presentation by clicking the download button below. http://bit.ly/2HHUsqf
Data Con LA 2022 - Why Data Quality vigilance requires an End-to-End, Automat...Data Con LA
Curtis ODell, Global Director Data Integrity at Tricentis
Join me to learn about a new end-to-end data testing approach designed for modern data pipelines that fills dangerous gaps left by traditional data management tools—one designed to handle structured and unstructured data from any source. You'll hear how you can use unique automation technology to reach up to 90 percent test coverage rates and deliver trustworthy analytical and operational data at scale. Several real world use cases from major banks/finance, insurance, health analytics, and Snowflake examples will be presented.
Key Learning Objective
1. Data journeys are complex and you have to ensure integrity of the data end to end across this journey from source to end reporting for compliance
2. Data Management tools do not test data, they profile and monitor at best, and leave serious gaps in your data testing coverage
3. Automation with integration to DevOps and DataOps' CI/CD processes are key to solving this.
4. How this approach has impact in your vertical
How to Optimize Sales Analytics Using 10x the Data at 1/10th the CostAtScale
Being able to analyze sales at the most granular level with up-to-date data, provides a competitive advantage for unlocking additional revenue -- especially for e-commerce and retail companies heading into the holiday season.
Now companies are in the middle of a renovation that forces them to be analytics-driven to
continue being competitive. Data analysis provides a complete insight about their business. It
also gives noteworthy advantages over their competitors. Analytics-driven insights compel
businesses to take action on service innovation, enhance client experience, detect irregularities in
process and provide extra time for product or service marketing. To work on analytics driven
activities, companies require to gather, analyse and store information from all possible sources.
Companies should bring appropriate tools and workflows in practice to analyse data rapidly and
unceasingly. They should obtain insight from data analysis result and make changes in their
business process and practice on the basis of gained result. It would help to be more agile than
their previous process and function.
Boulder HubSpot User Group: Top 5 Use Cases for Operations HubDustin Brackett
Join us as HubSpot Senior Product Marketing Manager of Operations Hub and Commerce, Jack Coopersmith, demystifies the power of Operations Hub with actionable insights, tips, and practical use cases that you can implement right away including data quality, programmable automation, data sets, and much more.
This session is for any HubSpot admins, operations managers, or anyone interested in getting more out of their HubSpot CRM and data.
Denodo DataFest 2016: Comparing and Contrasting Data Virtualization With Data...Denodo
Watch the full session: Denodo DataFest 2016 sessions: https://goo.gl/Bvmvc9
Data prep and data blending are terms that have come to prominence over the last year or two. On the surface, they appear to offer functionality similar to data virtualization…but there are important differences!
In this session, you will learn:
• How data virtualization complements or contrasts technologies such as data prep and data blending
• Pros and cons of functionality provided by data prep, data catalog and data blending tools
• When and how to use these different technologies to be most effective
This session is part of the Denodo DataFest 2016 event. You can also watch more Denodo DataFest sessions on demand here: https://goo.gl/VXb6M6
Denodo DataFest 2016: Comparing and Contrasting Data Virtualization With Data...
progress_DBBI-infographic_01-01
1. EXCEL FILES
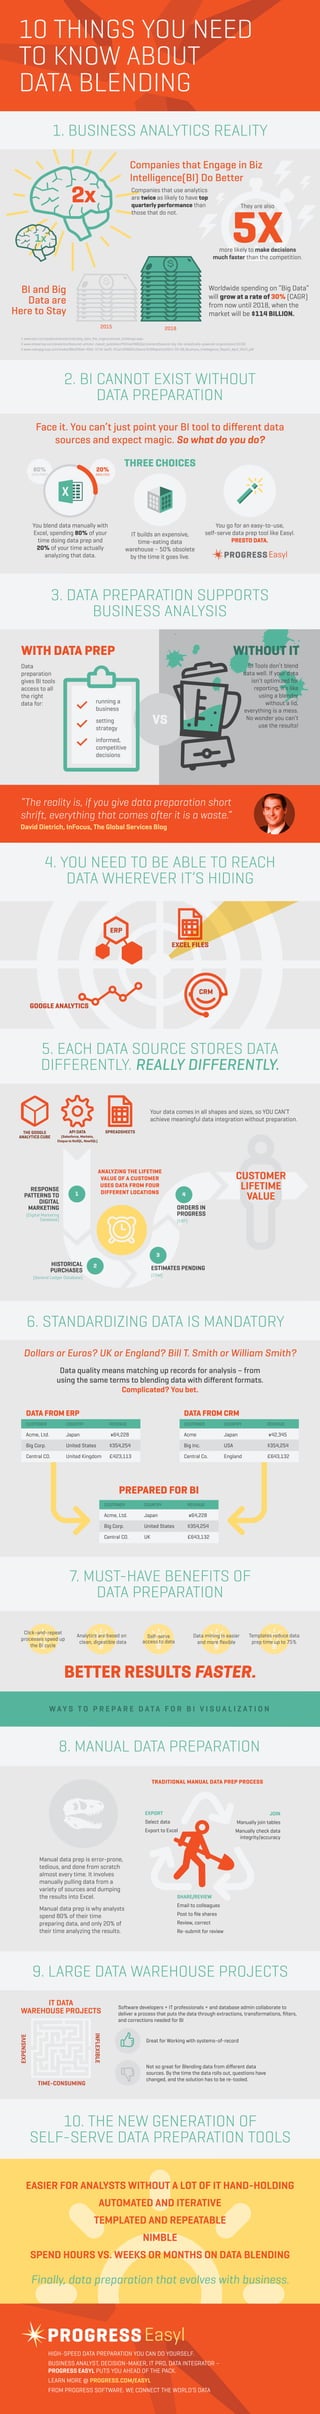
10 THINGS YOU NEED
TO KNOW ABOUT
DATA BLENDING
1. BUSINESS ANALYTICS REALITY
2. BI CANNOT EXIST WITHOUT
DATA PREPARATION
3. DATA PREPARATION SUPPORTS
BUSINESS ANALYSIS
4. YOU NEED TO BE ABLE TO REACH
DATA WHEREVER IT’S HIDING
5. EACH DATA SOURCE STORES DATA
DIFFERENTLY. REALLY DIFFERENTLY.
6. STANDARDIZING DATA IS MANDATORY
7. MUST-HAVE BENEFITS OF
DATA PREPARATION
8. MANUAL DATA PREPARATION
W A Y S T O P R E P A R E D ATA F O R B I V I S U A L I Z AT I O N
9. LARGE DATA WAREHOUSE PROJECTS
10. THE NEW GENERATION OF
SELF-SERVE DATA PREPARATION TOOLS
1 www.bain.com/publications/articles/big_data_the_organizational_challenge.aspx
2 www.atkearney.com/analytics/featured-article/-/asset_publisher/FNSUwH9BGQyt/content/beyond-big-the-analytically-powered-organization/10192
3 www.redcapgroup.com/media/98e342dd-420c-4716-be25-f21a14f46691/Sector%20Reports/2014-04-09_Business_Intellegence_Report_April_2014_pdf
Face it. You can’t just point your BI tool to different data
sources and expect magic. So what do you do?
You blend data manually with
Excel, spending 80% of your
time doing data prep and
20% of your time actually
analyzing that data.
IT builds an expensive,
time-eating data
warehouse – 50% obsolete
by the time it goes live.
You go for an easy-to-use,
self-serve data prep tool like Easyl.
PRESTO DATA.
WITH DATA PREP
Data
preparation
gives BI tools
access to all
the right
data for:
Your data comes in all shapes and sizes, so YOU CAN’T
achieve meaningful data integration without preparation.
Dollars or Euros? UK or England? Bill T. Smith or William Smith?
Data quality means matching up records for analysis – from
using the same terms to blending data with different formats.
Complicated? You bet.
EXPORT
Select data
Export to Excel
JOIN
Manually join tables
Manually check data
integrity/accuracy
SHARE/REVIEW
Email to colleagues
Post to file shares
Review, correct
Re-submit for review
Manual data prep is error-prone,
tedious, and done from scratch
almost every time. It involves
manually pulling data from a
variety of sources and dumping
the results into Excel.
Manual data prep is why analysts
spend 80% of their time
preparing data, and only 20% of
their time analyzing the results.
Software developers + IT professionals + and database admin collaborate to
deliver a process that puts the data through extractions, transformations, filters,
and corrections needed for BI
Great for Working with systems-of-record
Not so great for Blending data from different data
sources. By the time the data rolls out, questions have
changed, and the solution has to be re-tooled.
EASIER FOR ANALYSTS WITHOUT A LOT OF IT HAND-HOLDING
AUTOMATED AND ITERATIVE
TEMPLATED AND REPEATABLE
NIMBLE
SPEND HOURS VS. WEEKS OR MONTHS ON DATA BLENDING
Finally, data preparation that evolves with business.
FOOTER
2015 2018
2x
1x
Companies that Engage in Biz
Intelligence(BI) Do Better
Companies that use analytics
are twice as likely to have top
quarterly performance than
those that do not.
BI and Big
Data are
Here to Stay
Worldwide spending on “Big Data”
will grow at a rate of 30% (CAGR)
from now until 2018, when the
market will be $114 BILLION.
5Xmore likely to make decisions
much faster than the competition.
They are also
THREE CHOICES80%
DATA PREP
20%
ANALYSIS
Easyl
running a
business
setting
strategy
informed,
competitive
decisions
“The reality is, if you give data preparation short
shrift, everything that comes after it is a waste.”
David Dietrich, InFocus, The Global Services Blog
VS
WITHOUT IT
BI Tools don’t blend
data well. If your data
isn’t optimized for
reporting, it’s like
using a blender
without a lid,
everything is a mess.
No wonder you can’t
use the results!
CRM
ERP
GOOGLE ANALYTICS
BETTER RESULTS FASTER.
Click-and-repeat
processes speed up
the BI cycle
Analytics are based on
clean, digestible data
Templates reduce data
prep time up to 75%
Self-serve
access to data
Data mining is easier
and more flexible
THE GOOGLE
ANALYTICS CUBE
API DATA
(Salesforce, Marketo,
Eloqua to NoSQL, NewSQL)
SPREADSHEETS
ANALYZING THE LIFETIME
VALUE OF A CUSTOMER
USES DATA FROM FOUR
DIFFERENT LOCATIONS1
RESPONSE
PATTERNS TO
DIGITAL
MARKETING
(Digital Marketing
Database)
HISTORICAL
PURCHASES
(General Ledger Database)
ESTIMATES PENDING
(CRM)
2
3
ORDERS IN
PROGRESS
(ERP)
4
CUSTOMER
LIFETIME
VALUE
DATA FROM ERP
CUSTOMER COUNTRY REVENUE
Acme, Ltd. Japan ¥64,228
Big Corp. United States $354,254
Central CO. United Kingdom £423,113
DATA FROM CRM
CUSTOMER COUNTRY REVENUE
Acme Japan ¥42,345
Big Inc. USA $354,254
Central Co. England £643,132
CUSTOMER COUNTRY REVENUE
Acme, Ltd. Japan ¥64,228
Big Corp. United States $354,254
Central CO. UK £643,132
PREPARED FOR BI
TRADITIONAL MANUAL DATA PREP PROCESS
INFLEXIBLE
IT DATA
WAREHOUSE PROJECTS
EXPENSIVE
TIME-CONSUMING
HIGH-SPEED DATA PREPARATION YOU CAN DO YOURSELF.
BUSINESS ANALYST, DECISION-MAKER, IT PRO, DATA INTEGRATOR –
PROGRESS EASYL PUTS YOU AHEAD OF THE PACK.
LEARN MORE @ PROGRESS.COM/EASYL
FROM PROGRESS SOFTWARE. WE CONNECT THE WORLD’S DATA
Easyl