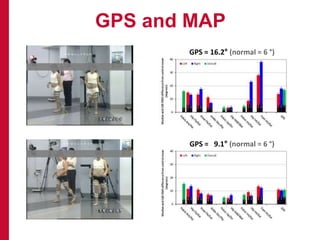
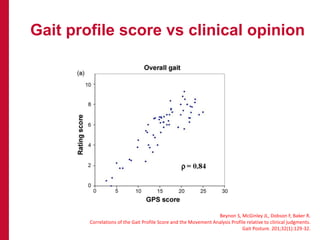
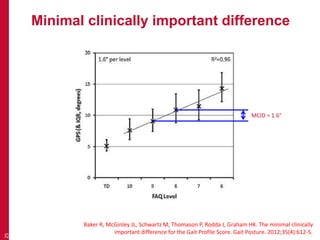
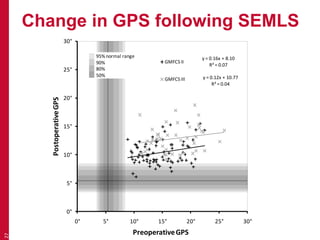
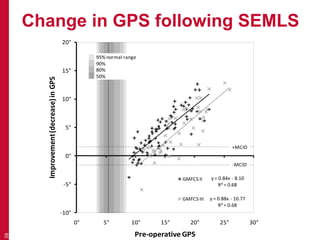
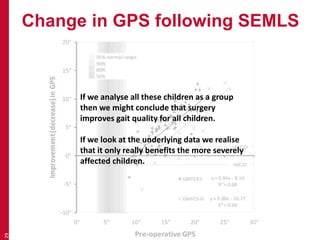
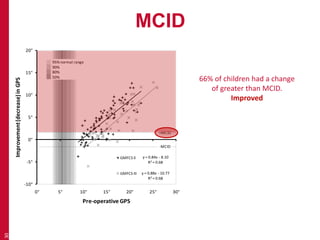
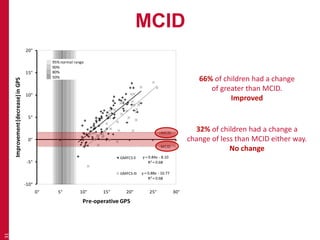
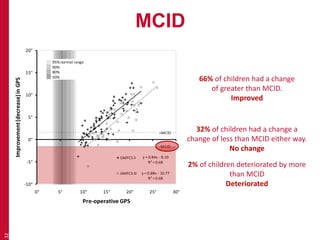
Outcome evaluation
Richard Baker
Professor of Clinical Gait Analysis
Blog: wwRichard.net
1
WHO International Classification of
Functioning, Disabilities and Handicaps
2
Temporal spatial parameters
3
Walking speed
• Best measured independently of gait
analysis.
• Walk tests as far as possible in a given
time
– 6 minute walk test (6MWT)
– 2 minute walk test (2MWT)
– 1 minute walk test (1MWT)
4
ATS statement: guidelines for the six-minute walk test.
Am J Respir Crit Care Med, 2002. 166(1): p. 111-7.
6 minute walk test
5
ATS statement: guidelines for the six-minute walk test.
Am J Respir Crit Care Med, 2002. 166(1): p. 111-7.
1 minute walk test
6
McDowell, B.C., et al., Validity of a 1 minute walk test for children with cerebral palsy.
Developmental Medicine and Child Neurology, 2005. 47(11): p. 744-8.
1 minute walk test
7
McDowell, B.C., et al., Test-retest reliability of a 1-min walk test in children with bilateral
spastic cerebral palsy (BSCP). Gait and Posture, 2009. 29(2): p. 267-9.
No equivalent data for self-selected walking speed?
(After practice walk)
Walking speed
is a consequence of
stride length
and
cadence
8
Non-dimensional normalisation
9
Hof A.
Scaling gait data to body size.
Gait Posture. 1996;4:222-3.
Should really be tested
10
Schwartz MH, Koop SE, Bourke JL, Baker R.
A nondimensional normalization scheme for oxygen utilization data.
Gait Posture. 2006; 4(1):14-22.
“Raw” “By mass” “Non-dimensional”
Non-dimensional normalisation
Results do not have units.
Not familiar (particularly to referring clinicians).
Report as % of normative reference values.
11
Gait indices
12
Gait indices
Single number to reflect the quality of gait.
• Gillette Gait Index (GGI, normalcy index)
• Gait deviation index (GDI)
• Gait profile score (GPS)
13
Gillette Gait Index
• Originally called “Normalcy” index
• Doesn’t feel right!
– Small number of parameters
– Mixes temporal-spatial and kinematics
– Black box
– No significance to values
– Forgot to take the square root!
14
GPS an GDI
The same measure scaled in two different ways.
15
An New Method for Computing the Gait Deviation Index and Motion Analysis Profile
Schwartz, Rozumalski and Baker, GCMAS 2013
𝐆𝐃𝐈 ≈ 𝟏𝟎𝟎 − 𝟏𝟎 ×
𝐥𝐧 𝑮𝑷𝑺 − 𝑨
𝑩
𝐆𝐏𝐒 ≈ 𝐞𝐱𝐩
𝐁(𝟏𝟎𝟎 − 𝐆𝐃𝐈)
𝟏𝟎
+ 𝑨
A = mean ln RMS , and B = sd ln RMS
Absolutely no point calculating both
– they tell you the same thing!
GPS and GDI
• GPS simple score (how many degrees
different from normal)
– About 6º is normal
• GDI –
– 100 = normal
– 10 points = one standard deviation
16
17
Baker, R., et al., The gait profile score and movement analysis profile.
Gait Posture 2009;30(3):265-9.
GPS and GDI
18
Baker, R., et al., The gait profile score and movement analysis profile.
Gait Posture 2009;30(3):265-9.
GPS and GDI
GPS and MAP
GPS = 16.2° (normal = 6 °)
GPS = 9.1° (normal = 6 °)
Gait profile score vs GMFCS
Baker R, McGinley JL, Schwartz MH, Beynon S, Rozumalski A, Graham HK, et al.
The gait profile score and movement analysis profile.
Gait Posture. 2009; 30(3):265-9.
Gait profile score vs FAQ
Baker R, McGinley JL, Schwartz MH, Beynon S, Rozumalski A, Graham HK, et al.
The gait profile score and movement analysis profile.
Gait Posture. 2009; 30(3):265-9.
Gait profile score vs speed
Baker et al. Gait and Posture 2009
Gait profile score vs clinical opinion
Beynon S, McGinley JL, Dobson F, Baker R.
Correlations of the Gait Profile Score and the Movement Analysis Profile relative to clinical judgments.
Gait Posture. 201;32(1):129-32.
MAP vs clinical opinion
Beynon S, McGinley JL, Dobson F, Baker R.
Correlations of the Gait Profile Score and the Movement Analysis Profile relative to clinical judgments.
Gait Posture. 201;32(1):129-32.
Minimal clinically important difference
25
Baker R, McGinley JL, Schwartz M, Thomason P, Rodda J, Graham HK. The minimal clinically
important difference for the Gait Profile Score. Gait Posture. 2012;35(4):612-5.
MCID = 1.6°
Assessing efficacy of
interventions
26
Change in GPS following SEMLS
27
y = 0.16x + 8.10
R² = 0.07
y = 0.12x + 10.77
R² = 0.04
0°
5°
10°
15°
20°
25°
30°
0° 5° 10° 15° 20° 25° 30°
PostoperativeGPS
PreoperativeGPS
GMFCS II
GMFCS III
95% normal range
90%
80%
50%
Change in GPS following SEMLS
28
y = 0.84x - 8.10
R² = 0.68
y = 0.88x - 10.77
R² = 0.68
-10°
-5°
0°
5°
10°
15°
20°
0° 5° 10° 15° 20° 25° 30°
Improvement(decrease)inGPS
Pre-operative GPS
GMFCS II
GMFCS III
95% normal range
90%
80%
50%
+MCID
-MCID
Change in GPS following SEMLS
29
If we analyse all these children as a group
then we might conclude that surgery
improves gait quality for all children.
If we look at the underlying data we realise
that it only really benefits the more severely
affected children.
MCID
30
y = 0.84x - 8.10
R² = 0.68
y = 0.88x - 10.77
R² = 0.68
-10°
-5°
0°
5°
10°
15°
20°
0° 5° 10° 15° 20° 25° 30°
Improvement(decrease)inGPS
Pre-operative GPS
GMFCS II
GMFCS III
95% normal range
90%
80%
50%
+MCID
-MCID
66% of children had a change
of greater than MCID.
Improved
MCID
31
y = 0.84x - 8.10
R² = 0.68
y = 0.88x - 10.77
R² = 0.68
-10°
-5°
0°
5°
10°
15°
20°
0° 5° 10° 15° 20° 25° 30°
Improvement(decrease)inGPS
Pre-operative GPS
GMFCS II
GMFCS III
95% normal range
90%
80%
50%
+MCID
-MCID
66% of children had a change
of greater than MCID.
Improved
32% of children had a change a
change of less than MCID either way.
No change
MCID
32
y = 0.84x - 8.10
R² = 0.68
y = 0.88x - 10.77
R² = 0.68
-10°
-5°
0°
5°
10°
15°
20°
0° 5° 10° 15° 20° 25° 30°
Improvement(decrease)inGPS
Pre-operative GPS
GMFCS II
GMFCS III
95% normal range
90%
80%
50%
+MCID
-MCID
66% of children had a change
of greater than MCID.
Improved
32% of children had a change a
change of less than MCID either way.
No change
2% of children deteriorated by more
than MCID
Deteriorated
Statistically significant
change
33
Detecting change
Statistically importance
To have 95% confidence that 2 measures
are different the change needs to be 3 times
the standard error of measurement (SEM)
• Need to know the SEM.
• Can be quite large for many clinical
measures.
34
Detecting change
Statistically importance
35
McGinley JL, Baker R, Wolfe R, Morris ME.
The reliability of three-dimensional kinematic gait measurements: a systematic review.
Gait Posture. 2009 Apr;29(3):360-9.
x3!
Detecting change
Statistically important change
36
McDowell BC, Hewitt V, Nurse A, Weston T, Baker R.
The variability of goniometric measurements in ambulatory children with spastic cerebral palsy.
Gait Posture. 2000 Oct;12(2):114-21.
x3!
Need more reliable measures
for clinical use than we do for
research
37
Thanks for listening
Richard Baker
Professor of Clinical Gait Analysis
Blog: wwRichard.net
38

Evaluating outcomes (2014)

  • 1.
    Outcome evaluation Richard Baker Professorof Clinical Gait Analysis Blog: wwRichard.net 1
  • 2.
    WHO International Classificationof Functioning, Disabilities and Handicaps 2 Temporal spatial parameters
  • 3.
  • 4.
    Walking speed • Bestmeasured independently of gait analysis. • Walk tests as far as possible in a given time – 6 minute walk test (6MWT) – 2 minute walk test (2MWT) – 1 minute walk test (1MWT) 4 ATS statement: guidelines for the six-minute walk test. Am J Respir Crit Care Med, 2002. 166(1): p. 111-7.
  • 5.
    6 minute walktest 5 ATS statement: guidelines for the six-minute walk test. Am J Respir Crit Care Med, 2002. 166(1): p. 111-7.
  • 6.
    1 minute walktest 6 McDowell, B.C., et al., Validity of a 1 minute walk test for children with cerebral palsy. Developmental Medicine and Child Neurology, 2005. 47(11): p. 744-8.
  • 7.
    1 minute walktest 7 McDowell, B.C., et al., Test-retest reliability of a 1-min walk test in children with bilateral spastic cerebral palsy (BSCP). Gait and Posture, 2009. 29(2): p. 267-9. No equivalent data for self-selected walking speed? (After practice walk)
  • 8.
    Walking speed is aconsequence of stride length and cadence 8
  • 9.
    Non-dimensional normalisation 9 Hof A. Scalinggait data to body size. Gait Posture. 1996;4:222-3.
  • 10.
    Should really betested 10 Schwartz MH, Koop SE, Bourke JL, Baker R. A nondimensional normalization scheme for oxygen utilization data. Gait Posture. 2006; 4(1):14-22. “Raw” “By mass” “Non-dimensional”
  • 11.
    Non-dimensional normalisation Results donot have units. Not familiar (particularly to referring clinicians). Report as % of normative reference values. 11
  • 12.
  • 13.
    Gait indices Single numberto reflect the quality of gait. • Gillette Gait Index (GGI, normalcy index) • Gait deviation index (GDI) • Gait profile score (GPS) 13
  • 14.
    Gillette Gait Index •Originally called “Normalcy” index • Doesn’t feel right! – Small number of parameters – Mixes temporal-spatial and kinematics – Black box – No significance to values – Forgot to take the square root! 14
  • 15.
    GPS an GDI Thesame measure scaled in two different ways. 15 An New Method for Computing the Gait Deviation Index and Motion Analysis Profile Schwartz, Rozumalski and Baker, GCMAS 2013 𝐆𝐃𝐈 ≈ 𝟏𝟎𝟎 − 𝟏𝟎 × 𝐥𝐧 𝑮𝑷𝑺 − 𝑨 𝑩 𝐆𝐏𝐒 ≈ 𝐞𝐱𝐩 𝐁(𝟏𝟎𝟎 − 𝐆𝐃𝐈) 𝟏𝟎 + 𝑨 A = mean ln RMS , and B = sd ln RMS Absolutely no point calculating both – they tell you the same thing!
  • 16.
    GPS and GDI •GPS simple score (how many degrees different from normal) – About 6º is normal • GDI – – 100 = normal – 10 points = one standard deviation 16
  • 17.
    17 Baker, R., etal., The gait profile score and movement analysis profile. Gait Posture 2009;30(3):265-9. GPS and GDI
  • 18.
    18 Baker, R., etal., The gait profile score and movement analysis profile. Gait Posture 2009;30(3):265-9. GPS and GDI
  • 19.
    GPS and MAP GPS= 16.2° (normal = 6 °) GPS = 9.1° (normal = 6 °)
  • 20.
    Gait profile scorevs GMFCS Baker R, McGinley JL, Schwartz MH, Beynon S, Rozumalski A, Graham HK, et al. The gait profile score and movement analysis profile. Gait Posture. 2009; 30(3):265-9.
  • 21.
    Gait profile scorevs FAQ Baker R, McGinley JL, Schwartz MH, Beynon S, Rozumalski A, Graham HK, et al. The gait profile score and movement analysis profile. Gait Posture. 2009; 30(3):265-9.
  • 22.
    Gait profile scorevs speed Baker et al. Gait and Posture 2009
  • 23.
    Gait profile scorevs clinical opinion Beynon S, McGinley JL, Dobson F, Baker R. Correlations of the Gait Profile Score and the Movement Analysis Profile relative to clinical judgments. Gait Posture. 201;32(1):129-32.
  • 24.
    MAP vs clinicalopinion Beynon S, McGinley JL, Dobson F, Baker R. Correlations of the Gait Profile Score and the Movement Analysis Profile relative to clinical judgments. Gait Posture. 201;32(1):129-32.
  • 25.
    Minimal clinically importantdifference 25 Baker R, McGinley JL, Schwartz M, Thomason P, Rodda J, Graham HK. The minimal clinically important difference for the Gait Profile Score. Gait Posture. 2012;35(4):612-5. MCID = 1.6°
  • 26.
  • 27.
    Change in GPSfollowing SEMLS 27 y = 0.16x + 8.10 R² = 0.07 y = 0.12x + 10.77 R² = 0.04 0° 5° 10° 15° 20° 25° 30° 0° 5° 10° 15° 20° 25° 30° PostoperativeGPS PreoperativeGPS GMFCS II GMFCS III 95% normal range 90% 80% 50%
  • 28.
    Change in GPSfollowing SEMLS 28 y = 0.84x - 8.10 R² = 0.68 y = 0.88x - 10.77 R² = 0.68 -10° -5° 0° 5° 10° 15° 20° 0° 5° 10° 15° 20° 25° 30° Improvement(decrease)inGPS Pre-operative GPS GMFCS II GMFCS III 95% normal range 90% 80% 50% +MCID -MCID
  • 29.
    Change in GPSfollowing SEMLS 29 If we analyse all these children as a group then we might conclude that surgery improves gait quality for all children. If we look at the underlying data we realise that it only really benefits the more severely affected children.
  • 30.
    MCID 30 y = 0.84x- 8.10 R² = 0.68 y = 0.88x - 10.77 R² = 0.68 -10° -5° 0° 5° 10° 15° 20° 0° 5° 10° 15° 20° 25° 30° Improvement(decrease)inGPS Pre-operative GPS GMFCS II GMFCS III 95% normal range 90% 80% 50% +MCID -MCID 66% of children had a change of greater than MCID. Improved
  • 31.
    MCID 31 y = 0.84x- 8.10 R² = 0.68 y = 0.88x - 10.77 R² = 0.68 -10° -5° 0° 5° 10° 15° 20° 0° 5° 10° 15° 20° 25° 30° Improvement(decrease)inGPS Pre-operative GPS GMFCS II GMFCS III 95% normal range 90% 80% 50% +MCID -MCID 66% of children had a change of greater than MCID. Improved 32% of children had a change a change of less than MCID either way. No change
  • 32.
    MCID 32 y = 0.84x- 8.10 R² = 0.68 y = 0.88x - 10.77 R² = 0.68 -10° -5° 0° 5° 10° 15° 20° 0° 5° 10° 15° 20° 25° 30° Improvement(decrease)inGPS Pre-operative GPS GMFCS II GMFCS III 95% normal range 90% 80% 50% +MCID -MCID 66% of children had a change of greater than MCID. Improved 32% of children had a change a change of less than MCID either way. No change 2% of children deteriorated by more than MCID Deteriorated
  • 33.
  • 34.
    Detecting change Statistically importance Tohave 95% confidence that 2 measures are different the change needs to be 3 times the standard error of measurement (SEM) • Need to know the SEM. • Can be quite large for many clinical measures. 34
  • 35.
    Detecting change Statistically importance 35 McGinleyJL, Baker R, Wolfe R, Morris ME. The reliability of three-dimensional kinematic gait measurements: a systematic review. Gait Posture. 2009 Apr;29(3):360-9. x3!
  • 36.
    Detecting change Statistically importantchange 36 McDowell BC, Hewitt V, Nurse A, Weston T, Baker R. The variability of goniometric measurements in ambulatory children with spastic cerebral palsy. Gait Posture. 2000 Oct;12(2):114-21. x3!
  • 37.
    Need more reliablemeasures for clinical use than we do for research 37
  • 38.
    Thanks for listening RichardBaker Professor of Clinical Gait Analysis Blog: wwRichard.net 38