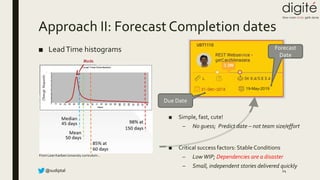
@sudiptal
ESTIMATION:
DELIVERING BUSINESS
AGILITYWITHOUT
ESTIMATION
Sudipta Lahiri
Head of Engineering and Products, Digite
1
@sudiptal
BusinessAgility
■ Ability of a business system to rapidly respond to change by adapting its initial stable
configuration (https://en.wikipedia.org/wiki/Business_agility)
2
@sudiptal
We preach some pretty “weird” stuff… to achieveAgility!
“Projects” is a bad term!
No(almost) Estimation!
Zero Budgeting!
No Managers but “servant-leaders”
Don’t allocate work... let people pull their work!
Multi-tasking is a bad thing!
Tracking utilization is a bad thing!
Testers and Developers will collaborate!
We will deliver more, faster with lesser planning, estimation...!
That’s exactly opposite to what we did all this time!
3
@sudiptal
maguzz.henislie.com
4
@sudiptal
Digite’s Business AgilityWebinar Series
■ Designed to unravel some of these “weird” ideas…
■ Covering topics of Delivery from Estimation => Planning => Forecasting =>Tracking
to
■ Covering topics of SDLC from Requirements => Build &Test => Deployment
■ Let’s start by understanding the “starting point…”
5
@sudiptal
Today’s applications are very different…
6
Deliver with SMALL, INDEPENDENT,TESTABLE work items that
have BUSINESSVALUE and allow you get MARKET FEEDBACK…
… we need to do this “rapidly”!
High degree of quality is assumed.
@sudiptal
ESTIMATION
How does estimation fit in this context?
7
@sudiptal
How were Estimates used?
Ideation /
Conceptualization
Project Planning /
Baselining
Execution /
VarianceTracking
Project
Completion
8
Estimation Basis1
2 3
@sudiptal
Great intent but…
9
1pm
1.15pm1.3pm
1.52pm
2pm
1.5pm
1.15pm
1pm 0.87pm
0.75pm
1.25pm
2.5pm
No winner in
this process!
@sudiptal
Great intent but…
10https://renierbotha.com/2010/10/07/the-art-of-it-effort-estimation/
@sudiptal
Great intent but…
11
@sudiptal
Great intent but…
12
?
Time Sheet Data
Questionable
accuracy!
@sudiptal
Net, the “intent” remains an intent!
Ideation /
Conceptualization
Project Planning /
Baselining
Execution /
VarianceTracking
Project
Completion
13
Estimation Basis1
2 3
Decades of user/customer commitments and revenue forecasting
is based on this premise of Estimation
@sudiptal
ESTIMATION: FRESH PERSPECTIVES
Let’s discuss this next…
14
@sudiptal
Perspective I: Relative vs Absolute Estimate
■ Relative estimation is accurate…
Absolute estimation is “highly” inaccurate!
15
@sudiptal
Perspective II: Understanding LT distribution
LeadTime histograms
From Lean Kanban University curriculum…
Mode
■ LT Distribution is aWeibull
Distribution with a long tail
– Mode, Median and Mean are all
different
– Mean > Median > Mode
– Using Mean as a basis for planning the
future is simply incorrect, unlike
Gaussian distributions
16
@sudiptal
Perspective III: “How sure are you?”
■ Your boss always knew this… the “gut feel”
estimate
■ The “gut feel” has a mathematical basis!
■ When asked for a estimate, always ask:
– What level of confidence?
■ It forces business to think!
■ A more aggressive estimate is associated with a
lower level confidence %
– Giving you more space if the estimate turns
out to be inaccurate
17
From Lean Kanban University curriculum…
Mode
@sudiptal
Flow efficiency measures
the percentage of total
lead time is spent
actually adding value (or
knowledge) versus
waiting
Flow efficiency % = Work Time x 100%
Lead Time
Flow efficiencies of 1-
5% are commonly
reported. > 40% is
very good!
Low Flow Efficiency does not
mean people are idle; they are
doing other things
Often, they have high WIP
because they are working on
multiple things in parallel
18
Perspective IV: Understanding Flow Efficiency
@sudiptal
Flow efficiency trend
■ SwiftKanban Flow efficiency trend chart
19
Realistically, the number =
This number/Average User WIP
@sudiptal
Low Flow Efficiency (vs) Estimation
■ If your FE = 25% and your LT = 100 days, it meansWorking time = 25 days!
■ If the cardWorkingTime = 25 days andWaitingTime = 75 days, then…
– Spending effort to get greater accuracy in Estimation and conclude thatWorking
Time “could be” 20 days or 30 days, is counter-productive
– Instead, spend time to identify how you could reduce the 75 daysWaitingTime by
50%.That is far more productive!
■ Remember, we wanted things to get done “rapidly”
20
@sudiptal
What did we cover so far…?
■ The futility of the traditional estimation models….
– Garbage in => Garbage out!
■ The new perspective on Estimation
– Relative Estimation
– LT distribution => FatTail => Planning based on mean is mathematically wrong
– Always ask the question – what confidence % do you want with the estimate?
– Understanding low Flow Efficiency systems
21
@sudiptal
WHAT ISTHE PATH
FORWARD?
Different scenarios; different approaches…
22
@sudiptal
Approach I:Velocity based tracking!
■ Simple, fast, cute!
– No guesses
– Enough to predict date, team size, effort!
■ Critical success factors: Stable System
– Full backlog (a Story Map)!
– Small, independent stories that are getting completed
and delivered quickly
– Dependencies are a disaster
– Unstable team => normalized velocity per person!
23
@sudiptal
Approach II: Forecast Completion dates
24
19-May-2019
Due Date
Forecast
Date
■ LeadTime histograms
From Lean Kanban University curriculum…
Mode
■ Simple, fast, cute!
– No guess; Predict date – not team size/effort
■ Critical success factors: Stable Conditions
– LowWIP; Dependencies are a disaster
– Small, independent stories delivered quickly
@sudiptal
Big bang initiatives
■ Large projects, large enhancements
■ Use Approach I
■ Forecast effort, duration based on
Velocity
– Associated to a confidence %
– Build a Story Map to get the full
backlog (starting point)
Continuous flow of items
■ Production Support, Maintenance
Tickets
■ Use Approach II
■ Forecast Completion Date based on
past LT distribution
– Associated to a confidence %
– Almost zero effort,
instantaneous
25
Two key scenarios
@sudiptal
Game Changer: Asking the right question
From
“When can I get it”
To
“When do you need it”
26
@sudiptal
Game Changer: Demand Shaping
■ Demand > Supply, for most of
us!
■ If Forecast Date < Due Date,
then:
– Don’t spend bandwidth
now on this; work on
another high priority item…
maximize Opportunity
potential!
27
19-May-2019
Due Date
Forecast
Date
■ If Forecast Date > Due Date,
then highlight the RISK on the
Board
@sudiptal
The “visible” anti-patterns!
■ 8hrs/Story Point!
■ Variance tracking = Baseline Story Points – Actual Story Points
28
@sudiptal
In closing…
■ Modern day applications need to be delivered with small, independent work items that can be delivered
fast and allow you to collect market feedback
– We cannot predict anymore what will work in the market
■ Estimation is at the heart of many planning and execution “ills”
– It is waste; keep it simple and do it as little and as fast as you can
■ Low Flow Efficiency systems:Value in reducing “WaitTime” than to predict (and optimize) “Work time”
■ UseVelocity to forecast big scope work that is broken into small, independent work items; use Lead Time
distributions to forecast one independent work item!
■ We have covered the why and how of Agile Requirements and Estimation
– In subsequent webinars, we cover how Planning, Forecasting and Execution have undergone a radical
change to build modern day systems… and how you can sell this to your Leadership!
29
@sudiptal
■ Reach me at:
– @sudiptal
– slahiri@digite.com
– lahiri.sudipta@gmail.com
THANK
YOU!
30
“Absorb what is useful, discard
what is useless and add what is
specifically your own”
Bruce Lee

Estimation - Delivering Business Agility without Estimation

  • 1.
  • 2.
    @sudiptal BusinessAgility ■ Ability ofa business system to rapidly respond to change by adapting its initial stable configuration (https://en.wikipedia.org/wiki/Business_agility) 2
  • 3.
    @sudiptal We preach somepretty “weird” stuff… to achieveAgility! “Projects” is a bad term! No(almost) Estimation! Zero Budgeting! No Managers but “servant-leaders” Don’t allocate work... let people pull their work! Multi-tasking is a bad thing! Tracking utilization is a bad thing! Testers and Developers will collaborate! We will deliver more, faster with lesser planning, estimation...! That’s exactly opposite to what we did all this time! 3
  • 4.
  • 5.
    @sudiptal Digite’s Business AgilityWebinarSeries ■ Designed to unravel some of these “weird” ideas… ■ Covering topics of Delivery from Estimation => Planning => Forecasting =>Tracking to ■ Covering topics of SDLC from Requirements => Build &Test => Deployment ■ Let’s start by understanding the “starting point…” 5
  • 6.
    @sudiptal Today’s applications arevery different… 6 Deliver with SMALL, INDEPENDENT,TESTABLE work items that have BUSINESSVALUE and allow you get MARKET FEEDBACK… … we need to do this “rapidly”! High degree of quality is assumed.
  • 7.
  • 8.
    @sudiptal How were Estimatesused? Ideation / Conceptualization Project Planning / Baselining Execution / VarianceTracking Project Completion 8 Estimation Basis1 2 3
  • 9.
    @sudiptal Great intent but… 9 1pm 1.15pm1.3pm 1.52pm 2pm 1.5pm 1.15pm 1pm0.87pm 0.75pm 1.25pm 2.5pm No winner in this process!
  • 10.
  • 11.
  • 12.
    @sudiptal Great intent but… 12 ? TimeSheet Data Questionable accuracy!
  • 13.
    @sudiptal Net, the “intent”remains an intent! Ideation / Conceptualization Project Planning / Baselining Execution / VarianceTracking Project Completion 13 Estimation Basis1 2 3 Decades of user/customer commitments and revenue forecasting is based on this premise of Estimation
  • 14.
  • 15.
    @sudiptal Perspective I: Relativevs Absolute Estimate ■ Relative estimation is accurate… Absolute estimation is “highly” inaccurate! 15
  • 16.
    @sudiptal Perspective II: UnderstandingLT distribution LeadTime histograms From Lean Kanban University curriculum… Mode ■ LT Distribution is aWeibull Distribution with a long tail – Mode, Median and Mean are all different – Mean > Median > Mode – Using Mean as a basis for planning the future is simply incorrect, unlike Gaussian distributions 16
  • 17.
    @sudiptal Perspective III: “Howsure are you?” ■ Your boss always knew this… the “gut feel” estimate ■ The “gut feel” has a mathematical basis! ■ When asked for a estimate, always ask: – What level of confidence? ■ It forces business to think! ■ A more aggressive estimate is associated with a lower level confidence % – Giving you more space if the estimate turns out to be inaccurate 17 From Lean Kanban University curriculum… Mode
  • 18.
    @sudiptal Flow efficiency measures thepercentage of total lead time is spent actually adding value (or knowledge) versus waiting Flow efficiency % = Work Time x 100% Lead Time Flow efficiencies of 1- 5% are commonly reported. > 40% is very good! Low Flow Efficiency does not mean people are idle; they are doing other things Often, they have high WIP because they are working on multiple things in parallel 18 Perspective IV: Understanding Flow Efficiency
  • 19.
    @sudiptal Flow efficiency trend ■SwiftKanban Flow efficiency trend chart 19 Realistically, the number = This number/Average User WIP
  • 20.
    @sudiptal Low Flow Efficiency(vs) Estimation ■ If your FE = 25% and your LT = 100 days, it meansWorking time = 25 days! ■ If the cardWorkingTime = 25 days andWaitingTime = 75 days, then… – Spending effort to get greater accuracy in Estimation and conclude thatWorking Time “could be” 20 days or 30 days, is counter-productive – Instead, spend time to identify how you could reduce the 75 daysWaitingTime by 50%.That is far more productive! ■ Remember, we wanted things to get done “rapidly” 20
  • 21.
    @sudiptal What did wecover so far…? ■ The futility of the traditional estimation models…. – Garbage in => Garbage out! ■ The new perspective on Estimation – Relative Estimation – LT distribution => FatTail => Planning based on mean is mathematically wrong – Always ask the question – what confidence % do you want with the estimate? – Understanding low Flow Efficiency systems 21
  • 22.
    @sudiptal WHAT ISTHE PATH FORWARD? Differentscenarios; different approaches… 22
  • 23.
    @sudiptal Approach I:Velocity basedtracking! ■ Simple, fast, cute! – No guesses – Enough to predict date, team size, effort! ■ Critical success factors: Stable System – Full backlog (a Story Map)! – Small, independent stories that are getting completed and delivered quickly – Dependencies are a disaster – Unstable team => normalized velocity per person! 23
  • 24.
    @sudiptal Approach II: ForecastCompletion dates 24 19-May-2019 Due Date Forecast Date ■ LeadTime histograms From Lean Kanban University curriculum… Mode ■ Simple, fast, cute! – No guess; Predict date – not team size/effort ■ Critical success factors: Stable Conditions – LowWIP; Dependencies are a disaster – Small, independent stories delivered quickly
  • 25.
    @sudiptal Big bang initiatives ■Large projects, large enhancements ■ Use Approach I ■ Forecast effort, duration based on Velocity – Associated to a confidence % – Build a Story Map to get the full backlog (starting point) Continuous flow of items ■ Production Support, Maintenance Tickets ■ Use Approach II ■ Forecast Completion Date based on past LT distribution – Associated to a confidence % – Almost zero effort, instantaneous 25 Two key scenarios
  • 26.
    @sudiptal Game Changer: Askingthe right question From “When can I get it” To “When do you need it” 26
  • 27.
    @sudiptal Game Changer: DemandShaping ■ Demand > Supply, for most of us! ■ If Forecast Date < Due Date, then: – Don’t spend bandwidth now on this; work on another high priority item… maximize Opportunity potential! 27 19-May-2019 Due Date Forecast Date ■ If Forecast Date > Due Date, then highlight the RISK on the Board
  • 28.
    @sudiptal The “visible” anti-patterns! ■8hrs/Story Point! ■ Variance tracking = Baseline Story Points – Actual Story Points 28
  • 29.
    @sudiptal In closing… ■ Modernday applications need to be delivered with small, independent work items that can be delivered fast and allow you to collect market feedback – We cannot predict anymore what will work in the market ■ Estimation is at the heart of many planning and execution “ills” – It is waste; keep it simple and do it as little and as fast as you can ■ Low Flow Efficiency systems:Value in reducing “WaitTime” than to predict (and optimize) “Work time” ■ UseVelocity to forecast big scope work that is broken into small, independent work items; use Lead Time distributions to forecast one independent work item! ■ We have covered the why and how of Agile Requirements and Estimation – In subsequent webinars, we cover how Planning, Forecasting and Execution have undergone a radical change to build modern day systems… and how you can sell this to your Leadership! 29
  • 30.
    @sudiptal ■ Reach meat: – @sudiptal – slahiri@digite.com – lahiri.sudipta@gmail.com THANK YOU! 30 “Absorb what is useful, discard what is useless and add what is specifically your own” Bruce Lee

Editor's Notes

  • #4 How many CEOs would get their job if this is what they told their respective Boards?
  • #12 PV =BCWS (this was always an estimate) EV = BCWP (this was always an estimate) AC = ACWP (can be accurate)