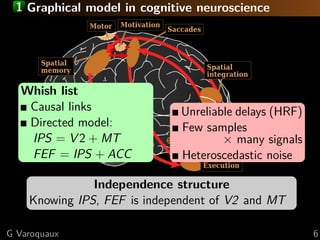
Download as PDF, PPTX
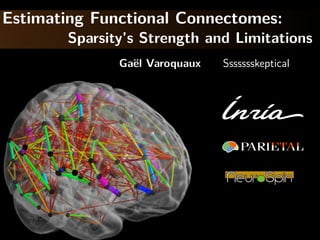

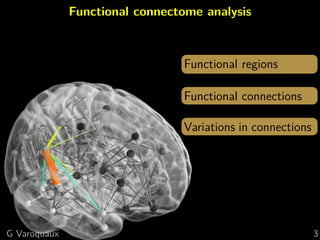
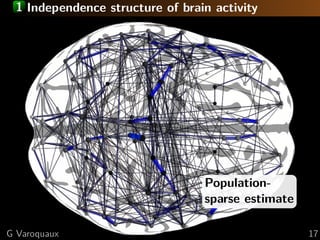
![1 Estimating connectomes
Functional connectome
Graph of interactions between regions
[Varoquaux and Craddock 2013]
G Varoquaux 5](https://image.slidesharecdn.com/slides-170625183331/85/Estimating-Functional-Connectomes-Sparsity-s-Strength-and-Limitations-7-320.jpg)
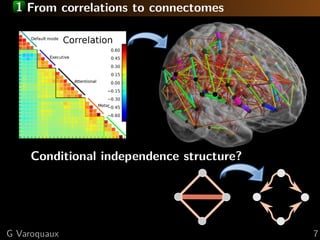
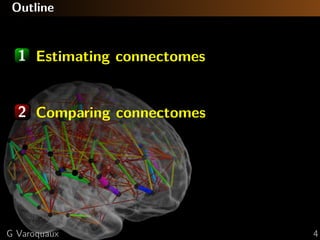
![1 Sparse inverse covariance: penalization
[Friedman... 2008, Varoquaux... 2010b, Smith... 2011]
Maximum a posteriori:
Fit models with a penalty
Sparsity ⇒ Lasso-like problem: 1 penalization
K = argmin
K 0
L( ˆΣ|K) + λ 1(K)
Data fit,
Likelihood
Penalization,
x2
x1
G Varoquaux 11](https://image.slidesharecdn.com/slides-170625183331/85/Estimating-Functional-Connectomes-Sparsity-s-Strength-and-Limitations-17-320.jpg)
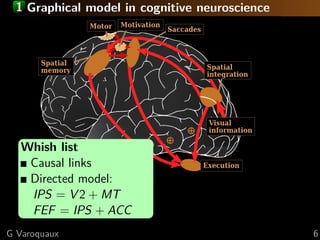
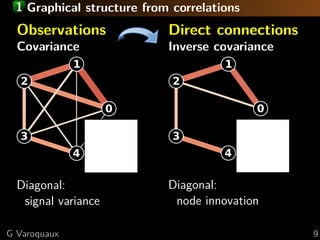
![1 Sparse inverse covariance: penalization
[Varoquaux... 2010b]
ˆΣ−1 Sparse
inverse
Likelihood of new data (cross-validation)
Subject data, Σ−1
-57.1
Subject data, sparse inverse 43.0
G Varoquaux 12](https://image.slidesharecdn.com/slides-170625183331/85/Estimating-Functional-Connectomes-Sparsity-s-Strength-and-Limitations-18-320.jpg)
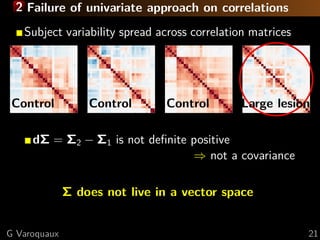
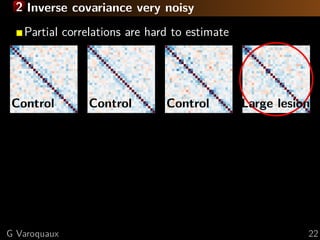
![1 Limitations of sparsity Sssssskeptical
Theoretical limitation to sparse recovery
Number of samples for s edges, p nodes:
n = O (s + p) log p [Lam and Fan 2009]
High-degree nodes fail [Ravikumar... 2011]
Empirically
Optimal graph
almost dense
2.5 3.0 3.5 4.0
−log10λ
Test-datalikelihood
Sparsity
[Varoquaux... 2012]
Very sparse graphs
don’t fit the data
G Varoquaux 13](https://image.slidesharecdn.com/slides-170625183331/85/Estimating-Functional-Connectomes-Sparsity-s-Strength-and-Limitations-19-320.jpg)
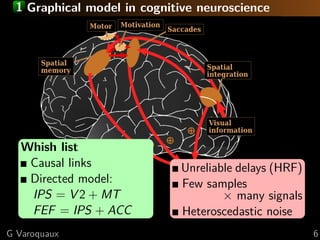
![1 Multi-subject to overcome subject data scarsity
[Varoquaux... 2010b]
ˆΣ−1 Sparse
inverse
Sparse group
concat
Likelihood of new data (cross-validation)
Subject data, Σ−1
-57.1
Subject data, sparse inverse 43.0
Group concat data, Σ−1
40.6
Group concat data, sparse inverse 41.8
Inter-subject variability
G Varoquaux 14](https://image.slidesharecdn.com/slides-170625183331/85/Estimating-Functional-Connectomes-Sparsity-s-Strength-and-Limitations-20-320.jpg)
![1 Multi-subject sparsity
[Varoquaux... 2010b]
Common independence structure but different
connection values
{Ks
} = argmin
{Ks 0} s
L( ˆΣs
|Ks
) + λ 21({Ks
})
Multi-subject data fit,
Likelihood
Group-lasso penalization
G Varoquaux 15](https://image.slidesharecdn.com/slides-170625183331/85/Estimating-Functional-Connectomes-Sparsity-s-Strength-and-Limitations-21-320.jpg)
![1 Multi-subject sparsity
[Varoquaux... 2010b]
Common independence structure but different
connection values
{Ks
} = argmin
{Ks 0} s
L( ˆΣs
|Ks
) + λ 21({Ks
})
Multi-subject data fit,
Likelihood
1 on the connections of
the 2 on the subjects
G Varoquaux 15](https://image.slidesharecdn.com/slides-170625183331/85/Estimating-Functional-Connectomes-Sparsity-s-Strength-and-Limitations-22-320.jpg)
![1 Multi-subject sparse graphs perform better
[Varoquaux... 2010b]
ˆΣ−1 Sparse
inverse
Population
prior
Likelihood of new data (cross-validation) sparsity
Subject data, Σ−1
-57.1
Subject data, sparse inverse 43.0 60% full
Group concat data, Σ−1
40.6
Group concat data, sparse inverse 41.8 80% full
Group sparse model 45.6 20% full
G Varoquaux 16](https://image.slidesharecdn.com/slides-170625183331/85/Estimating-Functional-Connectomes-Sparsity-s-Strength-and-Limitations-23-320.jpg)
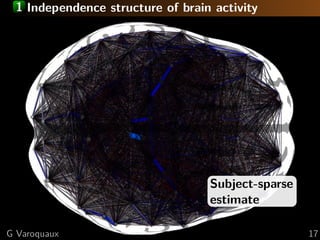
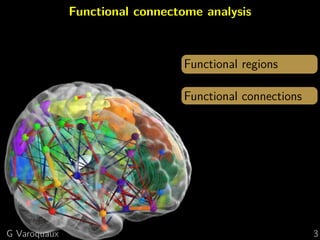
![1 Large scale organization: communities
Graph communities
[Eguiluz... 2005]
Non-sparse
Neural communities
G Varoquaux 18](https://image.slidesharecdn.com/slides-170625183331/85/Estimating-Functional-Connectomes-Sparsity-s-Strength-and-Limitations-26-320.jpg)
![1 Large scale organization: communities
Graph communities
[Eguiluz... 2005]
Group-sparse
Neural communities
= large known functional networks
[Varoquaux... 2010b]
G Varoquaux 18](https://image.slidesharecdn.com/slides-170625183331/85/Estimating-Functional-Connectomes-Sparsity-s-Strength-and-Limitations-27-320.jpg)
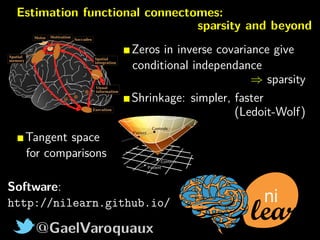
![1 Giving up on sparsity?
Sparsity is finicky
Sensitive hyper-parameter
Slow and unreliable convergence
Unstable set of selected edges
Shrinkage
Softly push partial correlations to zero
ΣShrunk = (1 − λ)ΣMLE + λId
Ledoit-Wolf oracle to set λ
[Ledoit and Wolf 2004]
G Varoquaux 19](https://image.slidesharecdn.com/slides-170625183331/85/Estimating-Functional-Connectomes-Sparsity-s-Strength-and-Limitations-28-320.jpg)
![2 Theory: error geometry
Disentangle parameters (edge-level connectivities)
Connectivity matrices form a manifold
⇒ project to tangent space
θ¹
θ²
( )θ¹I
-1
( )θ²I
-1
Estimation error of covariances
Assymptotics given by Fisher matrix [Rao 1945]
Cramer-Rao bounds
G Varoquaux 24](https://image.slidesharecdn.com/slides-170625183331/85/Estimating-Functional-Connectomes-Sparsity-s-Strength-and-Limitations-33-320.jpg)
![2 Theory: error geometry
Disentangle parameters (edge-level connectivities)
Connectivity matrices form a manifold
⇒ project to tangent space
M
anifold
[Varoquaux... 2010a]
Estimation error of covariances
Assymptotics given by Fisher matrix [Rao 1945]
Defines a metric on a manifold of models
With covariances: Lie-algebra structure [Lenglet... 2006]
G Varoquaux 24](https://image.slidesharecdn.com/slides-170625183331/85/Estimating-Functional-Connectomes-Sparsity-s-Strength-and-Limitations-34-320.jpg)
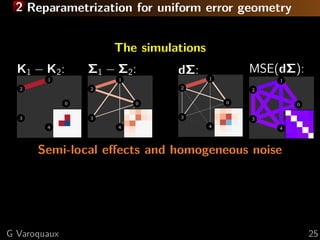
![2 Reparametrization for uniform error geometry
Disentangle parameters (edge-level connectivities)
Connectivity matrices form a manifold
⇒ project to tangent space
Controls
Patient
dΣ
M
anifold
Tangent
dΣ = Σ
− 1
/2
Ctrl ΣPatientΣ
− 1
/2
Ctrl
[Varoquaux... 2010a]
G Varoquaux 24](https://image.slidesharecdn.com/slides-170625183331/85/Estimating-Functional-Connectomes-Sparsity-s-Strength-and-Limitations-35-320.jpg)
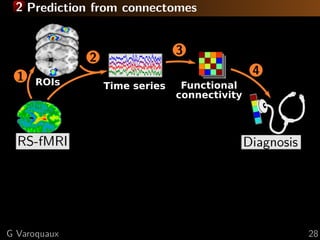
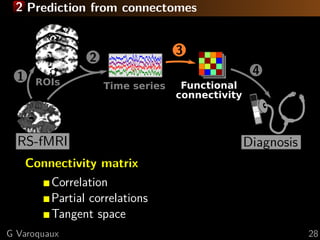
![2 Prediction from connectomes
Time series
2
RS-fMRI
41
Diagnosis
ROIs Functional
connectivity
3
Connectivity matrix
Correlation
Partial correlations
Tangent space
Prediction accuracy
Autism
[Abraham2016]
[K. Reddy, Poster 3916]
G Varoquaux 28](https://image.slidesharecdn.com/slides-170625183331/85/Estimating-Functional-Connectomes-Sparsity-s-Strength-and-Limitations-41-320.jpg)


The document discusses the estimation and analysis of functional connectomes in cognitive neuroscience, focusing on the strengths and limitations of sparsity in statistical models. Key topics include graphical models, independence structures, challenges in estimating partial correlations, and the impact of multi-subject data on connectome analysis. It emphasizes the importance of sparsity and potential issues with estimation accuracy in the context of brain connectivity modeling.


![Polymer [ बहुलक ] Chemistry Notes PDF - Irfanullah Mehar - JJ Sir Chemistry.pdf](https://cdn.slidesharecdn.com/ss_thumbnails/polymerchemistrynotespdf-irfanullahmehar-jjsirchemistry-260210172118-3f9b37f7-thumbnail.jpg?width=640&height=640&fit=bounds)


