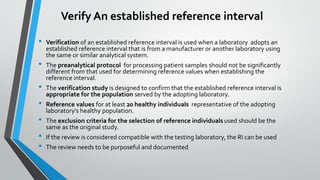
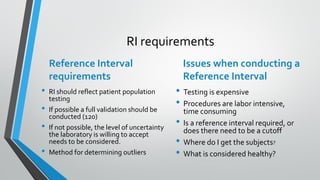
SlideShare a Scribd company logo
1 of 57
Download to read offline
Reference interval
determination in the
laboratory
Donna D. Castellone, MS, MASCP, MT(ASCP)SH
Department of Cell Biology and Pathology
Research Associate
Laboratory Consultant: Quality, Coagulation and ClinicalTrials
Disclosures
• I have nothing to disclose in relation to this presentation
• No products will be discussed in my presentation.
Objectives:
Apply Apply recommendations from guidelines for reference
range determination.
Differentiate Differentiate between verification and validation of a
reference interval.
Analyze Analyze data collection and determine the statistics to best
represent your patient population that you are testing.
Identify Identify components in laboratory testing that will impact
reference intervals
Reference Intervals
• One of the most important studies conducted in the
laboratory
• Up to 80% of medical decisions are made based on laboratory
test results
• Problematic because many laboratories lack the time,
resources, finances and in many cases the expertise to
conduct these studies
• Many reference intervals are obtained from either package
inserts or from publications
History
• Grasbek and Fellman published a paper in the 1950’s entitled ‘Normal
Values and Statistics’ as an initial study in the field of reference intervals
(RIs)
• It was determined several years later that the terminology of ‘normal
values’ was not adequate and even partially incorrect
• Reference values came into use from 1987 to 1991
• The International Federation ofClinical Chemistry (IFCC) published a
series of 6 papers, in which it was recommended that each laboratory
follow defined procedures to produce its own reference values
• EP28 by CLSI Defining, Establishing, andVerifying Reference Intervals in
the Clinical Laboratory, 3rd Edition was published 2010
Biochem Med (Zagreb). 2016 Feb 15; 26(1): 5–11.
Responsibility of the laboratory:
• Mandated for laboratories to publish reference intervals alongside patient test
results.
• Directives from laboratory regulatory authorities have stated that no matter
what size or resources that they need to justify the reference levels they adopt.
• ISO 15189:2007 the international standard that defines quality and
competency in clinical laboratories state that "reference intervals shall be
periodically reviewed" and verified every time a variation in analytical and/or
preanalytical procedure takes place.
• In the US, Clinical Laboratory ImprovementsAmendments (CLIA) from 2003
states that when FDA-approved test systems are adopted unmodified,
laboratories should "verify that the manufacturers' reference intervals are
appropriate for the laboratory’s patient population"
Current Laboratory practices: CAP
Q- probe studies:
• Surveyed 500 laboratories and noted that 78% used manufacturers published ranges
• Participating laboratories were asked to supply their adult and pediatric reference
intervals (low and high limits) for four common clinical chemistry parameters
(potassium, calcium, magnesium andTSH) and three equally common hematological
parameters (hemoglobin, platelet count and activated partial thromboplastin time).
• Asked when and how these reference intervals were arrived at, how long since they
were last reviewed and the measuring platform for each analyte.
• Survey results revealed that a range of approaches were used to arrive at selected
reference intervals.
• Only a half of the laboratories reported analyzing samples from healthy individuals for
adult reference intervals.
VALENSTEIN E. ed. Quality Management in Clinical Laboratories; Promoting patient safety through risk reduction and continuous improvement, Chicago, Ill. College of American
Pathologists. 2005;99-104.
Friedberg RC, et al. Arch Pathol Lab Med. 2007;348-357.
Current
practices
• The most frequent external source was
manufacturers' recommendations/package
inserts
• Even fewer (25 %) reported analyzing samples
in preparation of pediatric reference intervals.
The remaining laboratories adopted reference
intervals from external sources without any
internal study.
• Q probe studies of 163 laboratories revealed
only 5.5% of labs could recall the year they
revalidated their aPTT reference interval
• In another cohort of 116 laboratories, 42%
established their own RI for PT and aPTT
however only half did it for every change of
reagent lot
Current practices:
• Among those laboratories that conducted any sort of internal study, the
number of samples analyzed ranged from as few as 20 to >100.
• The results of sample analysis were used to establish reference intervals in
around a half of these laboratories.
• For the remaining laboratories, results of the internal study were used to
validate externally sourced reference intervals.
• 26 % of the participating laboratories do not have a written policy for
establishing, revising or updating reference intervals.
• Approximately two thirds of the laboratories reported that they had revalidated
their reference intervals in the year that a new analyzer was purchased
• Some laboratories reported no validation of reference intervals in the previous
10 years
• One case there had been no validation for at least 22 years.
Analysis of the data:
• 80% of laboratories: "only slight" variation in reference
interval limits.
• 20 % of laboratories, a substantial variation was evident,
• Statistical analysis of the whole data for all seven analytes
revealed that of 1271 adult reference intervals 40 (3.1 %)
contained at least one limit that was a statistical outlier.
• For some of the analytes (magnesium,TSH and APTT)
some observed variation between laboratories could be
accounted for by differences in analytical methodology,
but it certainly did not account for all of the variation.
• Inaccurate reference intervals may be being used to
interpret patient test results.
https://acutecaretesting.org/en/articles/reference-intervals-2--some-practical-considerations
What do laboratories actually do for
reference intervals?
• Strict adherence for reference ranges for the most commonly requested
analytes,
• Less stringent selection of the reference sample population (blood donors or
patients without problems likely to affect the analyte) were used for more
esoteric analytes,
• Specific literature on reference values, particularly individual publications with
data obtained using the laboratories methodology,
• General literature concerning reference values, particularly compendia from
professional bodies or Standard Operating Procedure or clinical guidelines.
• Manufacturers’ data as quoted in technical data sheets and package inserts.
Review of
Terminology:
• Observed value: value of an analyte obtained by observation or
measurement of a test subject, which should be compared with
reference values, a reference distribution, reference limit or
reference interval
• Reference distribution: the distribution of reference values
• Reference individual: a person selected on the basis of well-
defined criteria
• Reference population: a group consisting of all reference
individuals
• Reference interval: the interval between two reference limits
(these included) e.g.: 95% of apparently healthy men from 18 to 65
years
• Reference limits: a value derived from the reference distribution
and used for descriptive purposes
• Reference values: the value obtained by observation or
measurement of a defined quantity on a reference individual
The concept is as follows:
Reference
individuals
Make up a
reference
population
From whom are
selected a
reference sample
group
On whom are
determined
reference values
On which is
observed a
reference
distribution
From which are
determined
reference limits
Which then
defines a
reference interval.
Reference Limits
• The reference limits : (defining a reference range)
Associated with a well-defined reference population,
Generally consisting of healthy individuals
Used to compare an observed value (a result from the patient) to reference data
obtained from this group of well-defined subjects.
One of the keys for medical decision making which should take into account
the specificities of each patient.
Descriptive of a given health state
Medical Decision Limits
• The medical decision limits
Used by the clinician as a threshold below or above which a medical action
is recommended.
Reference limits are generally two (upper and lower limits), the number of
decision limits is variable according to the laboratory test and clinical
setting.
They are based on a clinical assessment and are set either by statistical
methods (e.g. Bayesian approach) or from epidemiological studies.
Clinical Decision Limits
• For some analytes, reference ranges are replaced by decision
limits set by national or international consensus (e.g. total
cholesterol, glycated hemoglobin)
• They are determined using receiver operator curves (ROCs)
that define the probability of disease.
• For these analytes it is unnecessary to determine reference
limits or to validate data from the literature.
• Reference values are calculated specific to health whereas
CDLs indicate sensitivity to disease
Ceriotti F, Henny J. “Are my laboratory results normal?” Considerations to be made concerning reference
intervals and decision limits eJIFCC, 2008;19. Available at: http://www.ifcc.org
• Selection of Subjects
Adults
Pediatrics
Geriatrics
Ethnicities
Gender
What is a reference interval?
Reference Intervals are defined in
relation to a healthy population to
include the values in which 95% of
apparently healthy individuals
would fall and in which 2.5 % of
results in the lower range are out
of the RI and 2.5% of values in the
upper range will be out of the RI.
Selection of subjects
• A questionnaire should be used to capture relevant information including
health status, age, gender, ethnicity and any medications- including
OTC, vitamins and supplements
• Equal amounts of male/female
• Representative of patient testing population
• A priori or a posteriori approach
• The more defined the population the better the outcomes
BiologicalVariation
• Defined as the variation seen in an individual subject when they are
measured for an analyte repeatedly over time.
• Variations can be influenced by stress, APR, circadian rhythms and
seasonal variations
• Difference is the between subject or inter- individual variation
• Studies are limited
• Most RI testing is conducted in the morning, patient blood draws occur
throughout the day- clinic samples tend to arrive later in the day
• Does this impact RI reflection on patient values.
Fraser C. Biological Variation: From Principles to Practice. AACC Press 2001.
Consequences of biological variation for
reference intervals: Creatinine
• Study looked at 13 women and 13 men.
• Results showed:
1. No individual had test results that spanned the entire reference interval and the
results from each individual occupied only a small part of the reference interval,
2. The means for most individuals lay within the reference interval and were different
from each other,
3. A few individuals had results which spanned the lower reference limit and these
individual had values which changed from “normal” to “abnormal” (as clinicians
would usually say) over time, and
4. A few individuals had results that spanned the upper reference limit and these
individuals also had values that changed from normal to abnormal over time.
https://acutecaretesting.org/en/articles/biological-variation-and-reference-normal-values
Information on RI: Biological variations
• Can aid in the evaluation of results obtained in RI
• If a large variation in results are seen for a particular test, it may be
worthwhile to understand if the results may be caused by known BV for that
analyte.
Validation of a parameter that is gender
dependent:
• A RI for hemoglobin is gender dependent
• The laboratory would need to obtain hemoglobin results on 240 reference
individuals (120 men and 120 women).
• These individuals are typically recruited from the general regional
population
• The selection is often accomplished by administering a health
questionnaire, and possibly a physical examination
Transgender men
• Cisgender male RI can be used to interpret testosterone concentrations in subjects
during transition, but specific RI should be used to evaluate estradiol in the
transmasculine population
• Most ranges are binary
• A study looked at 82 transgender adults- using the cisgender male reference
interval of >45pg/mL, 18% of this cohort would have been flagged as abnormally
high.
• A retrospective study on adults on feminizing hormones showed increases in
prolactin
• While hematology parameters for individuals on gender affirming hormone
therapy (both cisgender males and females) the HGB, HCT and RBC can be
interpreted using the sex-specific RI for their affirmed gender
CAPToday , February 2021.
Age specific ranges
• Newborn and childrens’ systems are immature in comparison to adults
and older children
• Basing pediatric results on adult ranges can cause a result to be
misclassified as abnormal
• Generate a diagnosis or treatment that may not be warranted.
Problems with these ranges:
• Obtaining blood from neonates and children problematic
• Parental consent
• Insufficient volumes for testing
• Laboratories used published data
• Manufacturers published ranges
• Ranges should be adapted from the same instrument/reagent
combinations
Pediatrics
Reference
Intervals
Coagulation
testing:
• Study of 218 healthy children stratified by age:
II, IX, XI and XII significantly decreased in the
youngest children (< 12 months)
PC and PS decreased in young childhood
Highest levels vWF in youngest children, but not
FVIII
• ARUP study- n=902 7-17 yrs old: each group n=164
PT testing 1 second longer than adults, aPTT not
significant
Also confirmed age dependent ranges in FVIII, IX
and XI and vW testing (activity and antigen)
Appel IM, et al JThromb Haemost 2012;10:2254–63.
Flanders M, et al Clinical Chemistry. 2005;51:1738-1742.
Data mining; using EMR’s
• Hard to obtain populations- geriatric and pediatric
• Use of EMR- larger amount of data- stratification for age groups
• Global reference intervals over a large regional area
• Expanded sample size
• Difficult to control pre-analytical variables.
• This approach is acceptable only if the laboratorian is able to identify
healthy individuals not affected by a disease.This method is not
recommended by the CLSI-IFCC.
Gollomp K, Arulselvan A, Tanzer M, Shibutani S, Lambert MP, Blood. 2015;126:4450
EMR ranges:
Pediatrics
(n=265)
• Patients (n=265) were excluded based on diagnosis
or medications that could impact coagulation
testing results
• Established PT= 11.6-13.8 sec
post EMR review: PT=12.9-13.9 sec
• aPTT = 22-35 sec
Post EMR review aPTT=25-35 sec
• No difference in gender was found
• Age: 2-11 yrs. PT=12.5-13.6 sec
12-23 yrs. PT=13.05-13.9 sec with no significant
difference in aPTT.
• Important to understand the CV of the individual
test- to determine if these results are significant
• Results may be statistically significant, but not
clinically significant.
Ethnic ranges do we need them?
• Serum creatinine has different distributions forAfrican-Americans and
Europeans
• Estimated glomerular filtration rate (eGFR), a widely-used test of kidney
function, is a calculation based on four variables: serum creatinine, age, sex,
and race .
• In this test, race is binary (African-American or European), and recent work
suggests that more granular categories and/or genetic ancestry could
improve eGFR scaling
What about Geriatric Ranges?
• According to the census the elderly population is increasing globally. The
US population age 65 and over grew from 2010-2020 at the fastest rate
since the end of the 1800’s, translating to a 38.6% increase in just 10 years.
• The global population of people aged 80 and older is expected to triple
between 2015 and 2050. In 2020 the number of people aged 60 years will
double from 12% to 22% by 2050
• It is projected there will be three million people worldwide aged 100 and
over by 2050.
Older Population and Aging - Census.gov
https://www.census.gov/topics/population/older-aging.html
Differences
• A study looked at coagulation results from healthy subjects aged 60 and older and
compared them to current adult reference intervals to determine any differences.
The aPTT results (90%) were below the reference ranges
• Increase of HbA1c with increasing age in non-diabetic individuals.As a
consequence age-dependent reference values for HbA1c were derived from two
large and well defined reference populations. Implementation of them into daily
practice may improve patient care and diagnosis of diabetes and reduce the risk of
misdiagnosis and subsequent overtreatment of diabetes in elderly patients.
• The ESR is increasing proportionally with age (in general by 0.22 mm/h per year
above 20 years of age), but its exact cause is not known.Therefore, the upper limit
of reference range in the eldery is 40 mm/h and 45 mm/h in males and females,
respectively.
• Therefore, it is not a healthy reference range that is required for this population;
instead, a ‘non-affected’ reference range that is characteristic for said population
(that is representative for the given subject),
Analytes with altered results in the elderly
INCREASING
• alkaline phosphatase, antinuclear
antibody, fibrinogen, FSH, LH, SHBG,
gamma glutamil transferase, gastrin, uric
acid, interleukin-6, insulin, cholesterol,
parathormone (PTH), prostate specific
antigen (PSA), rheuma factor, copper,
triglycerol, ESR
DECREASING
• aldosterone, vitamin B12,
dihydroepiandrosterone (DHEA), vitamin
D, ferritin, phosphate, HDL-cholesterol,
IGF-1, interleukin-1, calcium (total),
creatinine clearence, creatine kinase,
magnesium, growth hormone, estradiol,
free testosterone,T3, iron
EJIFCC. 2017 Dec; 28(4): 328–332.
Reference Intervals and COVID
• When performing a RI on your “healthy” population and you are using
people who have been vaccinated/ or have antibodies there may be some
issues
• COVID is an inflammatory disorder
• Due to the inflammation an elevation in certain parameters may be seen.
• Based on what we have seen: Elevated fibrinogen levels, elevated von
Willebrand levels, D-dimer levels were not elevated, slightly prolonged
aPTTs- possibly due to elevated CRP’s which can interfere with the
phospholipid in the reagent.
Number of subjects
Validation versusVerification
• Validation requires a minimum of 120 subjects
• Verification can use as little as 20 subjects to demonstrate test performance
from a previous claim.
• Statistical evaluation of a RI are based on the number of subjects used.
• Performed:
Change in reagent
Lot number
Instrument
Collection system
CLSI document H47-A2; 2008.
Statistics:
• The RI is the range between an upper and lower limit which represents a
percentage of the population tested.
• The mean and the standard deviation (SD) can be calculated. The SD is the
spread of data around the mean.
• The more dispersed the data, the higher the deviation.
Confidence interval
• Measures the level of uncertainty
• 95% CI : ranges are measured at 2.5 and 97.5 percentiles of the
distribution of results – contains the true mean of 95% of the population
• 99% CI – ensures 99% certainty
• The higher the confidence levels at the wider the CI
• Increasing the CI from 95-99% to ensure the interval contains the
population mean will increase the sample size
• Using a smaller number of RI data should be statistically evaluated to see
if they fit normal distribution or if it is skewed.
• Skewed data needs to be normalized by log transformation prior to
calculating and converting it back
Statistical methods for evaluation:
1. Parametric method: used when population is normal orGaussian, if not
a statistical transformation to normalize the data is applied
2. Non-parametric method: used when careful subject selection and
sufficient number (120) data is collected, doesn’t require laws of
probability
3. Robust method: used in a limited sample size without requiring a
Gaussian distribution- measures the position and dispersion instead of
mean and SD. Sorts the data from lowest to highest in equal parts and
looks at how far values are distributed from the center
Gaussian
Distribution
• If test results from a normal
healthy patient population fall
into a bell-shaped, Gaussian,
normal distribution, the
central 95% is usually used as
the test’s normal range.
• For many (but not all) tests,
this is how the range of tests
results for normal healthy
individuals is determined.
Some Normals are Abnormal …… andVice
Versa
• The normal range encompasses the mean plus or minus two standard deviations
or, again, about 95% of normal, healthy individuals’ test results.
• However, 5% (roughly 1 out of 20) normal healthy patients may be outside the
cutoff value.
• Roughly 2.5% of normal people can be expected to have a result below and roughly 2.5% of
normal people can be expected to have a result above the reported normal range.
• This situation is encountered with almost all tests.
• This is because the distribution of tests results from normal, healthy individuals
overlaps with the distribution of test results from sick patients with the relevant
disease.
Non-Gaussian
Distributions
• For non-Gaussian distributions
other nonparametric techniques to
establish reference range limits
• Example: set upper and lower
limits of normal to include 95%
of the population after all of the
test results have been
transformed into logarithms
taking the central 95% of the
transformed data.
Transformation of
data
• Replacement of a variable by
either the square root or the
logarithm of the variable
changes the shape of a
distribution or relationship
• Done when data is skewed to
transform the data into
symmetrical distribution
Outliers
• Method by Dixon: Looks at the difference in
the point which appears to be an outlier and
the next observation- (D)
• This is divided by difference of the lowest
observation and the highest observation (R)
• If the D/R ration is greater than 1/3, this point
may be an outliers.
• In a sample size of 20, allowed 2 outliers
• If > 2 outliers, must test an additional 20
normal
• If another 2 outliers other sources of errors
(reagents, analyzers, biological variations)
should be investigated
• A full RI may have to be conducted.
Higgins R, Olson J, CAPToday, 2015;15: 55.
Recommendations & Guidelines:
Transference
• Validation of a RI conducted by a manufacturer
• Smaller number of subjects n=20
• Compared to a larger study
• Keeping in mind the importance in using the same analytical test system
and reagents
• If a laboratory changes methods and the method comparison is compatible,
the RI can be transferred
Transference
• A laboratory can elect to “transfer” the RIs that were in use with an older method
(or from another laboratory) to a new method.
• To do this, the laboratory must first demonstrate that the 2 methods produce
comparable results.
• It is well known that analytic systems drift over time, and there is no guarantee
that the method of today is producing results that are comparable to those that
were produced at the time of the original RI study.
• This technique is the main reason why many laboratories today are using RIs that
were established decades ago and are out-of-date.
Transferring existing reference intervals
• Normal laboratory practice is to perform a method comparison study in which the same fresh patient
samples are measured by both methods. If the study shows that the two assays are completely
comparable across the measuring range (good correlation and no bias), then the reference interval can
be adopted unchanged.
• Alternatively, if the study shows good correlation but a proportional negative or positive bias between
the two methods, it may be acceptable to use the regression equation generated by the study to
"correct" the reference interval to take account of this systematic bias.
• The guidelines provide the following example of the way this is applied:
The results of a comparison study of methods x (old method) and y (new method to be adopted)
across a concentration range of 50-250 give the best-fit linear regression line:
y = 1.57x - 0.832 correlation coefficient r2 = 0.990
The established reference interval for method x is 50-150.
Since there is excellent correlation but proportional bias between the two methods, the
"corrected" reference interval for method y can be calculated thus:
For the lower limit 50
y = (1.57 × 50) - 0.832 = 77.72 (which rounds up to 78)
For the high limit 150
y = (1.57 × 150) - 0.832 = 234.82 (which rounds up to 235)
The reference interval to be adopted for the new method y is 78-235.
Using this method:
• A minimum of 40 patient samples should be tested across the reportable
range (absence of disease, and with disease)
• Advantage of the transferring protocol is that it does not require analysis of
samples from reference individuals.
• Limited application because it only applies if the reference interval in
question has been in use at that particular institution.
• Most important is making the decision about whether or not the two
methods agree sufficiently for them to share the same reference interval
• If that is hard to determine guidelines suggest that validation of the
reference interval is indicated.
Verify An established reference interval
• Verification of an established reference interval is used when a laboratory adopts an
established reference interval that is from a manufacturer or another laboratory using
the same or similar analytical system.
• The preanalytical protocol for processing patient samples should not be significantly
different from that used for determining reference values when establishing the
reference interval.
• The verification study is designed to confirm that the established reference interval is
appropriate for the population served by the adopting laboratory.
• Reference values for at least 20 healthy individuals representative of the adopting
laboratory's healthy population.
• The exclusion criteria for the selection of reference individualsused should be the
same as the original study.
• If the review is considered compatible with the testing laboratory, the RI can be used
• The review needs to be purposeful and documented
Plan, plan, plan the study
Pre-Analytical: 50-70% of errors occur here!
• Have a well written SOP that includes relevant stakeholders including
phlebotomy, time frames and where and when the study will be conducted.
• Will this be a verification or validation? How many samples will be required?
How much volume is required? Will additional volume be required for freezing?
• What is your institutional policy? Is there IRB approval? Do you have a consent
form?
• Do you have a questionnaire, will the study be a priori or a posteri?
• Who will recruit/ consent/ draw the subjects?
• Do I have sufficient representation of males/females as well as ethnic groups
that represent your testing population?
• What is exclusion criteria? Is this for only adults? Children? Geriatric?
Analytical:
• Do you have sufficient reagents to conduct the study? How many sites?
How many analyzers?
• Are the analyzers working correctly? Should there be a preventative
maintenance?
• Are the centrifuges working correctly?
• Will the study be conducted over a period of time to introduce analytical
variables that are seen in patient testing? How many samples/day?
• Will all samples be run fresh? Will some be run frozen?Who will aliquot
samples to be frozen?
Post Analytical
• What is considered an outlier?
• Who will do the statistical analysis?What type will be based on the amount
of samples? Parametric, non-parametric?
• Analyze the reference values: select a statistical method and calculate the
limits of reference and the reference interval
• Report sign off
• Update LIS and downstream systems
• Alert clinicians to range changes.
RI requirements
Reference Interval
requirements
• RI should reflect patient population
testing
• If possible a full validation should be
conducted (120)
• If not possible, the level of uncertainty
the laboratory is willing to accept
needs to be considered.
• Method for determining outliers
Issues when conducting a
Reference Interval
• Testing is expensive
• Procedures are labor intensive,
time consuming
• Is a reference interval required, or
does there need to be a cutoff
• Where do I get the subjects?
• What is considered healthy?
Conclusion
• Conducting a Reference Range Interval is a complicated
process
• Carefully planned and documented event
• The more defined your population and subject selection and
the more controlled your pre-analytical variables are the
better the outcomes
• If a RI is to be transference, should be compatible for
reagent/instrument combination and the testing population
• Ensure best possible results to provide tools for clinicians to
diagnose disorders and provide optimal treatment to patients

More Related Content

Similar to Establishing Reference Intervals in Laboratory Medicine

Presentation: Bioequivalence
Presentation: BioequivalencePresentation: Bioequivalence
Presentation: BioequivalenceTGA Australia
 
Study designs & amp; trials presentation1 2
Study designs & amp; trials presentation1 2Study designs & amp; trials presentation1 2
Study designs & amp; trials presentation1 2Praveen Ganji
 
DEVELOPING CLINICAL TRIAL PROTOCOL BY PRANAV LENDHEY.pptx
DEVELOPING CLINICAL TRIAL PROTOCOL BY PRANAV LENDHEY.pptxDEVELOPING CLINICAL TRIAL PROTOCOL BY PRANAV LENDHEY.pptx
DEVELOPING CLINICAL TRIAL PROTOCOL BY PRANAV LENDHEY.pptx36PranavLendhey
 
surgical audit
surgical auditsurgical audit
surgical auditsoori14386
 
INCLUSION AND EXCLUSION CRITERIA session ACRM.pptx
INCLUSION AND EXCLUSION CRITERIA session ACRM.pptxINCLUSION AND EXCLUSION CRITERIA session ACRM.pptx
INCLUSION AND EXCLUSION CRITERIA session ACRM.pptxACSRM
 
bio equivalence studies
bio equivalence studiesbio equivalence studies
bio equivalence studiesRamyaP53
 
Evidence based orthodontics parag
Evidence based orthodontics paragEvidence based orthodontics parag
Evidence based orthodontics paragParag Deshmukh
 
bio analytical method validation usfda guidlines
bio analytical method validation usfda guidlinesbio analytical method validation usfda guidlines
bio analytical method validation usfda guidlineschandu chatla
 
Levels of evidence, recommendations &amp; phases of
Levels of evidence, recommendations &amp; phases ofLevels of evidence, recommendations &amp; phases of
Levels of evidence, recommendations &amp; phases ofsanyal1981
 
Introductory lecture in Clinical Pathology.pptx
Introductory lecture in Clinical Pathology.pptxIntroductory lecture in Clinical Pathology.pptx
Introductory lecture in Clinical Pathology.pptxDammyDebby
 
1.qualitycontrol final
1.qualitycontrol final1.qualitycontrol final
1.qualitycontrol finalIshah Khaliq
 
Research Methodology
Research Methodology Research Methodology
Research Methodology Dr Athar Khan
 
Pre analytic and postanalytic test management
Pre analytic and postanalytic test managementPre analytic and postanalytic test management
Pre analytic and postanalytic test managementVarsha Shahane
 
Methods for Observational Comparative Effectiveness Research on Healthcare De...
Methods for Observational Comparative Effectiveness Research on Healthcare De...Methods for Observational Comparative Effectiveness Research on Healthcare De...
Methods for Observational Comparative Effectiveness Research on Healthcare De...Marion Sills
 

Similar to Establishing Reference Intervals in Laboratory Medicine (20)

Presentation: Bioequivalence
Presentation: BioequivalencePresentation: Bioequivalence
Presentation: Bioequivalence
 
Study designs & amp; trials presentation1 2
Study designs & amp; trials presentation1 2Study designs & amp; trials presentation1 2
Study designs & amp; trials presentation1 2
 
Evidence Based Medicine
Evidence Based Medicine Evidence Based Medicine
Evidence Based Medicine
 
DEVELOPING CLINICAL TRIAL PROTOCOL BY PRANAV LENDHEY.pptx
DEVELOPING CLINICAL TRIAL PROTOCOL BY PRANAV LENDHEY.pptxDEVELOPING CLINICAL TRIAL PROTOCOL BY PRANAV LENDHEY.pptx
DEVELOPING CLINICAL TRIAL PROTOCOL BY PRANAV LENDHEY.pptx
 
surgical audit
surgical auditsurgical audit
surgical audit
 
Turacoz - Clinical Study Report
Turacoz - Clinical Study ReportTuracoz - Clinical Study Report
Turacoz - Clinical Study Report
 
Systematic review
Systematic reviewSystematic review
Systematic review
 
INCLUSION AND EXCLUSION CRITERIA session ACRM.pptx
INCLUSION AND EXCLUSION CRITERIA session ACRM.pptxINCLUSION AND EXCLUSION CRITERIA session ACRM.pptx
INCLUSION AND EXCLUSION CRITERIA session ACRM.pptx
 
surgical audit
surgical auditsurgical audit
surgical audit
 
bio equivalence studies
bio equivalence studiesbio equivalence studies
bio equivalence studies
 
Evidence based orthodontics parag
Evidence based orthodontics paragEvidence based orthodontics parag
Evidence based orthodontics parag
 
bio analytical method validation usfda guidlines
bio analytical method validation usfda guidlinesbio analytical method validation usfda guidlines
bio analytical method validation usfda guidlines
 
Levels of evidence, recommendations &amp; phases of
Levels of evidence, recommendations &amp; phases ofLevels of evidence, recommendations &amp; phases of
Levels of evidence, recommendations &amp; phases of
 
Spirit 2013
Spirit 2013Spirit 2013
Spirit 2013
 
Clinical trials
Clinical trialsClinical trials
Clinical trials
 
Introductory lecture in Clinical Pathology.pptx
Introductory lecture in Clinical Pathology.pptxIntroductory lecture in Clinical Pathology.pptx
Introductory lecture in Clinical Pathology.pptx
 
1.qualitycontrol final
1.qualitycontrol final1.qualitycontrol final
1.qualitycontrol final
 
Research Methodology
Research Methodology Research Methodology
Research Methodology
 
Pre analytic and postanalytic test management
Pre analytic and postanalytic test managementPre analytic and postanalytic test management
Pre analytic and postanalytic test management
 
Methods for Observational Comparative Effectiveness Research on Healthcare De...
Methods for Observational Comparative Effectiveness Research on Healthcare De...Methods for Observational Comparative Effectiveness Research on Healthcare De...
Methods for Observational Comparative Effectiveness Research on Healthcare De...
 

Recently uploaded

PSYPACT- Practicing Over State Lines May 2024.pptx
PSYPACT- Practicing Over State Lines May 2024.pptxPSYPACT- Practicing Over State Lines May 2024.pptx
PSYPACT- Practicing Over State Lines May 2024.pptxMarlene Maheu
 
Graduate Outcomes Presentation Slides - English (v3).pptx
Graduate Outcomes Presentation Slides - English (v3).pptxGraduate Outcomes Presentation Slides - English (v3).pptx
Graduate Outcomes Presentation Slides - English (v3).pptxneillewis46
 
male presentation...pdf.................
male presentation...pdf.................male presentation...pdf.................
male presentation...pdf.................MirzaAbrarBaig5
 
Transparency, Recognition and the role of eSealing - Ildiko Mazar and Koen No...
Transparency, Recognition and the role of eSealing - Ildiko Mazar and Koen No...Transparency, Recognition and the role of eSealing - Ildiko Mazar and Koen No...
Transparency, Recognition and the role of eSealing - Ildiko Mazar and Koen No...EADTU
 
Book Review of Run For Your Life Powerpoint
Book Review of Run For Your Life PowerpointBook Review of Run For Your Life Powerpoint
Book Review of Run For Your Life Powerpoint23600690
 
DEMONSTRATION LESSON IN ENGLISH 4 MATATAG CURRICULUM
DEMONSTRATION LESSON IN ENGLISH 4 MATATAG CURRICULUMDEMONSTRATION LESSON IN ENGLISH 4 MATATAG CURRICULUM
DEMONSTRATION LESSON IN ENGLISH 4 MATATAG CURRICULUMELOISARIVERA8
 
Climbers and Creepers used in landscaping
Climbers and Creepers used in landscapingClimbers and Creepers used in landscaping
Climbers and Creepers used in landscapingDr. M. Kumaresan Hort.
 
Stl Algorithms in C++ jjjjjjjjjjjjjjjjjj
Stl Algorithms in C++ jjjjjjjjjjjjjjjjjjStl Algorithms in C++ jjjjjjjjjjjjjjjjjj
Stl Algorithms in C++ jjjjjjjjjjjjjjjjjjMohammed Sikander
 
ĐỀ THAM KHẢO KÌ THI TUYỂN SINH VÀO LỚP 10 MÔN TIẾNG ANH FORM 50 CÂU TRẮC NGHI...
ĐỀ THAM KHẢO KÌ THI TUYỂN SINH VÀO LỚP 10 MÔN TIẾNG ANH FORM 50 CÂU TRẮC NGHI...ĐỀ THAM KHẢO KÌ THI TUYỂN SINH VÀO LỚP 10 MÔN TIẾNG ANH FORM 50 CÂU TRẮC NGHI...
ĐỀ THAM KHẢO KÌ THI TUYỂN SINH VÀO LỚP 10 MÔN TIẾNG ANH FORM 50 CÂU TRẮC NGHI...Nguyen Thanh Tu Collection
 
Basic Civil Engineering notes on Transportation Engineering & Modes of Transport
Basic Civil Engineering notes on Transportation Engineering & Modes of TransportBasic Civil Engineering notes on Transportation Engineering & Modes of Transport
Basic Civil Engineering notes on Transportation Engineering & Modes of TransportDenish Jangid
 
MOOD STABLIZERS DRUGS.pptx
MOOD     STABLIZERS           DRUGS.pptxMOOD     STABLIZERS           DRUGS.pptx
MOOD STABLIZERS DRUGS.pptxPoojaSen20
 
diagnosting testing bsc 2nd sem.pptx....
diagnosting testing bsc 2nd sem.pptx....diagnosting testing bsc 2nd sem.pptx....
diagnosting testing bsc 2nd sem.pptx....Ritu480198
 
Đề tieng anh thpt 2024 danh cho cac ban hoc sinh
Đề tieng anh thpt 2024 danh cho cac ban hoc sinhĐề tieng anh thpt 2024 danh cho cac ban hoc sinh
Đề tieng anh thpt 2024 danh cho cac ban hoc sinhleson0603
 
Improved Approval Flow in Odoo 17 Studio App
Improved Approval Flow in Odoo 17 Studio AppImproved Approval Flow in Odoo 17 Studio App
Improved Approval Flow in Odoo 17 Studio AppCeline George
 
e-Sealing at EADTU by Kamakshi Rajagopal
e-Sealing at EADTU by Kamakshi Rajagopale-Sealing at EADTU by Kamakshi Rajagopal
e-Sealing at EADTU by Kamakshi RajagopalEADTU
 
An Overview of the Odoo 17 Knowledge App
An Overview of the Odoo 17 Knowledge AppAn Overview of the Odoo 17 Knowledge App
An Overview of the Odoo 17 Knowledge AppCeline George
 
Scopus Indexed Journals 2024 - ISCOPUS Publications
Scopus Indexed Journals 2024 - ISCOPUS PublicationsScopus Indexed Journals 2024 - ISCOPUS Publications
Scopus Indexed Journals 2024 - ISCOPUS PublicationsISCOPE Publication
 

Recently uploaded (20)

PSYPACT- Practicing Over State Lines May 2024.pptx
PSYPACT- Practicing Over State Lines May 2024.pptxPSYPACT- Practicing Over State Lines May 2024.pptx
PSYPACT- Practicing Over State Lines May 2024.pptx
 
Graduate Outcomes Presentation Slides - English (v3).pptx
Graduate Outcomes Presentation Slides - English (v3).pptxGraduate Outcomes Presentation Slides - English (v3).pptx
Graduate Outcomes Presentation Slides - English (v3).pptx
 
male presentation...pdf.................
male presentation...pdf.................male presentation...pdf.................
male presentation...pdf.................
 
Transparency, Recognition and the role of eSealing - Ildiko Mazar and Koen No...
Transparency, Recognition and the role of eSealing - Ildiko Mazar and Koen No...Transparency, Recognition and the role of eSealing - Ildiko Mazar and Koen No...
Transparency, Recognition and the role of eSealing - Ildiko Mazar and Koen No...
 
Book Review of Run For Your Life Powerpoint
Book Review of Run For Your Life PowerpointBook Review of Run For Your Life Powerpoint
Book Review of Run For Your Life Powerpoint
 
Mattingly "AI & Prompt Design: Named Entity Recognition"
Mattingly "AI & Prompt Design: Named Entity Recognition"Mattingly "AI & Prompt Design: Named Entity Recognition"
Mattingly "AI & Prompt Design: Named Entity Recognition"
 
Including Mental Health Support in Project Delivery, 14 May.pdf
Including Mental Health Support in Project Delivery, 14 May.pdfIncluding Mental Health Support in Project Delivery, 14 May.pdf
Including Mental Health Support in Project Delivery, 14 May.pdf
 
DEMONSTRATION LESSON IN ENGLISH 4 MATATAG CURRICULUM
DEMONSTRATION LESSON IN ENGLISH 4 MATATAG CURRICULUMDEMONSTRATION LESSON IN ENGLISH 4 MATATAG CURRICULUM
DEMONSTRATION LESSON IN ENGLISH 4 MATATAG CURRICULUM
 
Climbers and Creepers used in landscaping
Climbers and Creepers used in landscapingClimbers and Creepers used in landscaping
Climbers and Creepers used in landscaping
 
Supporting Newcomer Multilingual Learners
Supporting Newcomer  Multilingual LearnersSupporting Newcomer  Multilingual Learners
Supporting Newcomer Multilingual Learners
 
Stl Algorithms in C++ jjjjjjjjjjjjjjjjjj
Stl Algorithms in C++ jjjjjjjjjjjjjjjjjjStl Algorithms in C++ jjjjjjjjjjjjjjjjjj
Stl Algorithms in C++ jjjjjjjjjjjjjjjjjj
 
ĐỀ THAM KHẢO KÌ THI TUYỂN SINH VÀO LỚP 10 MÔN TIẾNG ANH FORM 50 CÂU TRẮC NGHI...
ĐỀ THAM KHẢO KÌ THI TUYỂN SINH VÀO LỚP 10 MÔN TIẾNG ANH FORM 50 CÂU TRẮC NGHI...ĐỀ THAM KHẢO KÌ THI TUYỂN SINH VÀO LỚP 10 MÔN TIẾNG ANH FORM 50 CÂU TRẮC NGHI...
ĐỀ THAM KHẢO KÌ THI TUYỂN SINH VÀO LỚP 10 MÔN TIẾNG ANH FORM 50 CÂU TRẮC NGHI...
 
Basic Civil Engineering notes on Transportation Engineering & Modes of Transport
Basic Civil Engineering notes on Transportation Engineering & Modes of TransportBasic Civil Engineering notes on Transportation Engineering & Modes of Transport
Basic Civil Engineering notes on Transportation Engineering & Modes of Transport
 
MOOD STABLIZERS DRUGS.pptx
MOOD     STABLIZERS           DRUGS.pptxMOOD     STABLIZERS           DRUGS.pptx
MOOD STABLIZERS DRUGS.pptx
 
diagnosting testing bsc 2nd sem.pptx....
diagnosting testing bsc 2nd sem.pptx....diagnosting testing bsc 2nd sem.pptx....
diagnosting testing bsc 2nd sem.pptx....
 
Đề tieng anh thpt 2024 danh cho cac ban hoc sinh
Đề tieng anh thpt 2024 danh cho cac ban hoc sinhĐề tieng anh thpt 2024 danh cho cac ban hoc sinh
Đề tieng anh thpt 2024 danh cho cac ban hoc sinh
 
Improved Approval Flow in Odoo 17 Studio App
Improved Approval Flow in Odoo 17 Studio AppImproved Approval Flow in Odoo 17 Studio App
Improved Approval Flow in Odoo 17 Studio App
 
e-Sealing at EADTU by Kamakshi Rajagopal
e-Sealing at EADTU by Kamakshi Rajagopale-Sealing at EADTU by Kamakshi Rajagopal
e-Sealing at EADTU by Kamakshi Rajagopal
 
An Overview of the Odoo 17 Knowledge App
An Overview of the Odoo 17 Knowledge AppAn Overview of the Odoo 17 Knowledge App
An Overview of the Odoo 17 Knowledge App
 
Scopus Indexed Journals 2024 - ISCOPUS Publications
Scopus Indexed Journals 2024 - ISCOPUS PublicationsScopus Indexed Journals 2024 - ISCOPUS Publications
Scopus Indexed Journals 2024 - ISCOPUS Publications
 

Establishing Reference Intervals in Laboratory Medicine

  • 1. Reference interval determination in the laboratory Donna D. Castellone, MS, MASCP, MT(ASCP)SH Department of Cell Biology and Pathology Research Associate Laboratory Consultant: Quality, Coagulation and ClinicalTrials
  • 2. Disclosures • I have nothing to disclose in relation to this presentation • No products will be discussed in my presentation.
  • 3. Objectives: Apply Apply recommendations from guidelines for reference range determination. Differentiate Differentiate between verification and validation of a reference interval. Analyze Analyze data collection and determine the statistics to best represent your patient population that you are testing. Identify Identify components in laboratory testing that will impact reference intervals
  • 4. Reference Intervals • One of the most important studies conducted in the laboratory • Up to 80% of medical decisions are made based on laboratory test results • Problematic because many laboratories lack the time, resources, finances and in many cases the expertise to conduct these studies • Many reference intervals are obtained from either package inserts or from publications
  • 5. History • Grasbek and Fellman published a paper in the 1950’s entitled ‘Normal Values and Statistics’ as an initial study in the field of reference intervals (RIs) • It was determined several years later that the terminology of ‘normal values’ was not adequate and even partially incorrect • Reference values came into use from 1987 to 1991 • The International Federation ofClinical Chemistry (IFCC) published a series of 6 papers, in which it was recommended that each laboratory follow defined procedures to produce its own reference values • EP28 by CLSI Defining, Establishing, andVerifying Reference Intervals in the Clinical Laboratory, 3rd Edition was published 2010 Biochem Med (Zagreb). 2016 Feb 15; 26(1): 5–11.
  • 6. Responsibility of the laboratory: • Mandated for laboratories to publish reference intervals alongside patient test results. • Directives from laboratory regulatory authorities have stated that no matter what size or resources that they need to justify the reference levels they adopt. • ISO 15189:2007 the international standard that defines quality and competency in clinical laboratories state that "reference intervals shall be periodically reviewed" and verified every time a variation in analytical and/or preanalytical procedure takes place. • In the US, Clinical Laboratory ImprovementsAmendments (CLIA) from 2003 states that when FDA-approved test systems are adopted unmodified, laboratories should "verify that the manufacturers' reference intervals are appropriate for the laboratory’s patient population"
  • 7. Current Laboratory practices: CAP Q- probe studies: • Surveyed 500 laboratories and noted that 78% used manufacturers published ranges • Participating laboratories were asked to supply their adult and pediatric reference intervals (low and high limits) for four common clinical chemistry parameters (potassium, calcium, magnesium andTSH) and three equally common hematological parameters (hemoglobin, platelet count and activated partial thromboplastin time). • Asked when and how these reference intervals were arrived at, how long since they were last reviewed and the measuring platform for each analyte. • Survey results revealed that a range of approaches were used to arrive at selected reference intervals. • Only a half of the laboratories reported analyzing samples from healthy individuals for adult reference intervals. VALENSTEIN E. ed. Quality Management in Clinical Laboratories; Promoting patient safety through risk reduction and continuous improvement, Chicago, Ill. College of American Pathologists. 2005;99-104. Friedberg RC, et al. Arch Pathol Lab Med. 2007;348-357.
  • 8. Current practices • The most frequent external source was manufacturers' recommendations/package inserts • Even fewer (25 %) reported analyzing samples in preparation of pediatric reference intervals. The remaining laboratories adopted reference intervals from external sources without any internal study. • Q probe studies of 163 laboratories revealed only 5.5% of labs could recall the year they revalidated their aPTT reference interval • In another cohort of 116 laboratories, 42% established their own RI for PT and aPTT however only half did it for every change of reagent lot
  • 9. Current practices: • Among those laboratories that conducted any sort of internal study, the number of samples analyzed ranged from as few as 20 to >100. • The results of sample analysis were used to establish reference intervals in around a half of these laboratories. • For the remaining laboratories, results of the internal study were used to validate externally sourced reference intervals. • 26 % of the participating laboratories do not have a written policy for establishing, revising or updating reference intervals. • Approximately two thirds of the laboratories reported that they had revalidated their reference intervals in the year that a new analyzer was purchased • Some laboratories reported no validation of reference intervals in the previous 10 years • One case there had been no validation for at least 22 years.
  • 10. Analysis of the data: • 80% of laboratories: "only slight" variation in reference interval limits. • 20 % of laboratories, a substantial variation was evident, • Statistical analysis of the whole data for all seven analytes revealed that of 1271 adult reference intervals 40 (3.1 %) contained at least one limit that was a statistical outlier. • For some of the analytes (magnesium,TSH and APTT) some observed variation between laboratories could be accounted for by differences in analytical methodology, but it certainly did not account for all of the variation. • Inaccurate reference intervals may be being used to interpret patient test results. https://acutecaretesting.org/en/articles/reference-intervals-2--some-practical-considerations
  • 11. What do laboratories actually do for reference intervals? • Strict adherence for reference ranges for the most commonly requested analytes, • Less stringent selection of the reference sample population (blood donors or patients without problems likely to affect the analyte) were used for more esoteric analytes, • Specific literature on reference values, particularly individual publications with data obtained using the laboratories methodology, • General literature concerning reference values, particularly compendia from professional bodies or Standard Operating Procedure or clinical guidelines. • Manufacturers’ data as quoted in technical data sheets and package inserts.
  • 12. Review of Terminology: • Observed value: value of an analyte obtained by observation or measurement of a test subject, which should be compared with reference values, a reference distribution, reference limit or reference interval • Reference distribution: the distribution of reference values • Reference individual: a person selected on the basis of well- defined criteria • Reference population: a group consisting of all reference individuals • Reference interval: the interval between two reference limits (these included) e.g.: 95% of apparently healthy men from 18 to 65 years • Reference limits: a value derived from the reference distribution and used for descriptive purposes • Reference values: the value obtained by observation or measurement of a defined quantity on a reference individual
  • 13. The concept is as follows: Reference individuals Make up a reference population From whom are selected a reference sample group On whom are determined reference values On which is observed a reference distribution From which are determined reference limits Which then defines a reference interval.
  • 14. Reference Limits • The reference limits : (defining a reference range) Associated with a well-defined reference population, Generally consisting of healthy individuals Used to compare an observed value (a result from the patient) to reference data obtained from this group of well-defined subjects. One of the keys for medical decision making which should take into account the specificities of each patient. Descriptive of a given health state
  • 15. Medical Decision Limits • The medical decision limits Used by the clinician as a threshold below or above which a medical action is recommended. Reference limits are generally two (upper and lower limits), the number of decision limits is variable according to the laboratory test and clinical setting. They are based on a clinical assessment and are set either by statistical methods (e.g. Bayesian approach) or from epidemiological studies.
  • 16. Clinical Decision Limits • For some analytes, reference ranges are replaced by decision limits set by national or international consensus (e.g. total cholesterol, glycated hemoglobin) • They are determined using receiver operator curves (ROCs) that define the probability of disease. • For these analytes it is unnecessary to determine reference limits or to validate data from the literature. • Reference values are calculated specific to health whereas CDLs indicate sensitivity to disease Ceriotti F, Henny J. “Are my laboratory results normal?” Considerations to be made concerning reference intervals and decision limits eJIFCC, 2008;19. Available at: http://www.ifcc.org
  • 17. • Selection of Subjects Adults Pediatrics Geriatrics Ethnicities Gender
  • 18. What is a reference interval? Reference Intervals are defined in relation to a healthy population to include the values in which 95% of apparently healthy individuals would fall and in which 2.5 % of results in the lower range are out of the RI and 2.5% of values in the upper range will be out of the RI.
  • 19. Selection of subjects • A questionnaire should be used to capture relevant information including health status, age, gender, ethnicity and any medications- including OTC, vitamins and supplements • Equal amounts of male/female • Representative of patient testing population • A priori or a posteriori approach • The more defined the population the better the outcomes
  • 20. BiologicalVariation • Defined as the variation seen in an individual subject when they are measured for an analyte repeatedly over time. • Variations can be influenced by stress, APR, circadian rhythms and seasonal variations • Difference is the between subject or inter- individual variation • Studies are limited • Most RI testing is conducted in the morning, patient blood draws occur throughout the day- clinic samples tend to arrive later in the day • Does this impact RI reflection on patient values. Fraser C. Biological Variation: From Principles to Practice. AACC Press 2001.
  • 21. Consequences of biological variation for reference intervals: Creatinine • Study looked at 13 women and 13 men. • Results showed: 1. No individual had test results that spanned the entire reference interval and the results from each individual occupied only a small part of the reference interval, 2. The means for most individuals lay within the reference interval and were different from each other, 3. A few individuals had results which spanned the lower reference limit and these individual had values which changed from “normal” to “abnormal” (as clinicians would usually say) over time, and 4. A few individuals had results that spanned the upper reference limit and these individuals also had values that changed from normal to abnormal over time. https://acutecaretesting.org/en/articles/biological-variation-and-reference-normal-values
  • 22. Information on RI: Biological variations • Can aid in the evaluation of results obtained in RI • If a large variation in results are seen for a particular test, it may be worthwhile to understand if the results may be caused by known BV for that analyte.
  • 23. Validation of a parameter that is gender dependent: • A RI for hemoglobin is gender dependent • The laboratory would need to obtain hemoglobin results on 240 reference individuals (120 men and 120 women). • These individuals are typically recruited from the general regional population • The selection is often accomplished by administering a health questionnaire, and possibly a physical examination
  • 24. Transgender men • Cisgender male RI can be used to interpret testosterone concentrations in subjects during transition, but specific RI should be used to evaluate estradiol in the transmasculine population • Most ranges are binary • A study looked at 82 transgender adults- using the cisgender male reference interval of >45pg/mL, 18% of this cohort would have been flagged as abnormally high. • A retrospective study on adults on feminizing hormones showed increases in prolactin • While hematology parameters for individuals on gender affirming hormone therapy (both cisgender males and females) the HGB, HCT and RBC can be interpreted using the sex-specific RI for their affirmed gender CAPToday , February 2021.
  • 25. Age specific ranges • Newborn and childrens’ systems are immature in comparison to adults and older children • Basing pediatric results on adult ranges can cause a result to be misclassified as abnormal • Generate a diagnosis or treatment that may not be warranted.
  • 26. Problems with these ranges: • Obtaining blood from neonates and children problematic • Parental consent • Insufficient volumes for testing • Laboratories used published data • Manufacturers published ranges • Ranges should be adapted from the same instrument/reagent combinations
  • 27. Pediatrics Reference Intervals Coagulation testing: • Study of 218 healthy children stratified by age: II, IX, XI and XII significantly decreased in the youngest children (< 12 months) PC and PS decreased in young childhood Highest levels vWF in youngest children, but not FVIII • ARUP study- n=902 7-17 yrs old: each group n=164 PT testing 1 second longer than adults, aPTT not significant Also confirmed age dependent ranges in FVIII, IX and XI and vW testing (activity and antigen) Appel IM, et al JThromb Haemost 2012;10:2254–63. Flanders M, et al Clinical Chemistry. 2005;51:1738-1742.
  • 28. Data mining; using EMR’s • Hard to obtain populations- geriatric and pediatric • Use of EMR- larger amount of data- stratification for age groups • Global reference intervals over a large regional area • Expanded sample size • Difficult to control pre-analytical variables. • This approach is acceptable only if the laboratorian is able to identify healthy individuals not affected by a disease.This method is not recommended by the CLSI-IFCC. Gollomp K, Arulselvan A, Tanzer M, Shibutani S, Lambert MP, Blood. 2015;126:4450
  • 29. EMR ranges: Pediatrics (n=265) • Patients (n=265) were excluded based on diagnosis or medications that could impact coagulation testing results • Established PT= 11.6-13.8 sec post EMR review: PT=12.9-13.9 sec • aPTT = 22-35 sec Post EMR review aPTT=25-35 sec • No difference in gender was found • Age: 2-11 yrs. PT=12.5-13.6 sec 12-23 yrs. PT=13.05-13.9 sec with no significant difference in aPTT. • Important to understand the CV of the individual test- to determine if these results are significant • Results may be statistically significant, but not clinically significant.
  • 30. Ethnic ranges do we need them? • Serum creatinine has different distributions forAfrican-Americans and Europeans • Estimated glomerular filtration rate (eGFR), a widely-used test of kidney function, is a calculation based on four variables: serum creatinine, age, sex, and race . • In this test, race is binary (African-American or European), and recent work suggests that more granular categories and/or genetic ancestry could improve eGFR scaling
  • 31. What about Geriatric Ranges? • According to the census the elderly population is increasing globally. The US population age 65 and over grew from 2010-2020 at the fastest rate since the end of the 1800’s, translating to a 38.6% increase in just 10 years. • The global population of people aged 80 and older is expected to triple between 2015 and 2050. In 2020 the number of people aged 60 years will double from 12% to 22% by 2050 • It is projected there will be three million people worldwide aged 100 and over by 2050. Older Population and Aging - Census.gov https://www.census.gov/topics/population/older-aging.html
  • 32. Differences • A study looked at coagulation results from healthy subjects aged 60 and older and compared them to current adult reference intervals to determine any differences. The aPTT results (90%) were below the reference ranges • Increase of HbA1c with increasing age in non-diabetic individuals.As a consequence age-dependent reference values for HbA1c were derived from two large and well defined reference populations. Implementation of them into daily practice may improve patient care and diagnosis of diabetes and reduce the risk of misdiagnosis and subsequent overtreatment of diabetes in elderly patients. • The ESR is increasing proportionally with age (in general by 0.22 mm/h per year above 20 years of age), but its exact cause is not known.Therefore, the upper limit of reference range in the eldery is 40 mm/h and 45 mm/h in males and females, respectively. • Therefore, it is not a healthy reference range that is required for this population; instead, a ‘non-affected’ reference range that is characteristic for said population (that is representative for the given subject),
  • 33. Analytes with altered results in the elderly INCREASING • alkaline phosphatase, antinuclear antibody, fibrinogen, FSH, LH, SHBG, gamma glutamil transferase, gastrin, uric acid, interleukin-6, insulin, cholesterol, parathormone (PTH), prostate specific antigen (PSA), rheuma factor, copper, triglycerol, ESR DECREASING • aldosterone, vitamin B12, dihydroepiandrosterone (DHEA), vitamin D, ferritin, phosphate, HDL-cholesterol, IGF-1, interleukin-1, calcium (total), creatinine clearence, creatine kinase, magnesium, growth hormone, estradiol, free testosterone,T3, iron EJIFCC. 2017 Dec; 28(4): 328–332.
  • 34. Reference Intervals and COVID • When performing a RI on your “healthy” population and you are using people who have been vaccinated/ or have antibodies there may be some issues • COVID is an inflammatory disorder • Due to the inflammation an elevation in certain parameters may be seen. • Based on what we have seen: Elevated fibrinogen levels, elevated von Willebrand levels, D-dimer levels were not elevated, slightly prolonged aPTTs- possibly due to elevated CRP’s which can interfere with the phospholipid in the reagent.
  • 36. Validation versusVerification • Validation requires a minimum of 120 subjects • Verification can use as little as 20 subjects to demonstrate test performance from a previous claim. • Statistical evaluation of a RI are based on the number of subjects used. • Performed: Change in reagent Lot number Instrument Collection system CLSI document H47-A2; 2008.
  • 37. Statistics: • The RI is the range between an upper and lower limit which represents a percentage of the population tested. • The mean and the standard deviation (SD) can be calculated. The SD is the spread of data around the mean. • The more dispersed the data, the higher the deviation.
  • 38. Confidence interval • Measures the level of uncertainty • 95% CI : ranges are measured at 2.5 and 97.5 percentiles of the distribution of results – contains the true mean of 95% of the population • 99% CI – ensures 99% certainty • The higher the confidence levels at the wider the CI • Increasing the CI from 95-99% to ensure the interval contains the population mean will increase the sample size • Using a smaller number of RI data should be statistically evaluated to see if they fit normal distribution or if it is skewed. • Skewed data needs to be normalized by log transformation prior to calculating and converting it back
  • 39. Statistical methods for evaluation: 1. Parametric method: used when population is normal orGaussian, if not a statistical transformation to normalize the data is applied 2. Non-parametric method: used when careful subject selection and sufficient number (120) data is collected, doesn’t require laws of probability 3. Robust method: used in a limited sample size without requiring a Gaussian distribution- measures the position and dispersion instead of mean and SD. Sorts the data from lowest to highest in equal parts and looks at how far values are distributed from the center
  • 40. Gaussian Distribution • If test results from a normal healthy patient population fall into a bell-shaped, Gaussian, normal distribution, the central 95% is usually used as the test’s normal range. • For many (but not all) tests, this is how the range of tests results for normal healthy individuals is determined.
  • 41. Some Normals are Abnormal …… andVice Versa • The normal range encompasses the mean plus or minus two standard deviations or, again, about 95% of normal, healthy individuals’ test results. • However, 5% (roughly 1 out of 20) normal healthy patients may be outside the cutoff value. • Roughly 2.5% of normal people can be expected to have a result below and roughly 2.5% of normal people can be expected to have a result above the reported normal range. • This situation is encountered with almost all tests. • This is because the distribution of tests results from normal, healthy individuals overlaps with the distribution of test results from sick patients with the relevant disease.
  • 42. Non-Gaussian Distributions • For non-Gaussian distributions other nonparametric techniques to establish reference range limits • Example: set upper and lower limits of normal to include 95% of the population after all of the test results have been transformed into logarithms taking the central 95% of the transformed data.
  • 43. Transformation of data • Replacement of a variable by either the square root or the logarithm of the variable changes the shape of a distribution or relationship • Done when data is skewed to transform the data into symmetrical distribution
  • 44. Outliers • Method by Dixon: Looks at the difference in the point which appears to be an outlier and the next observation- (D) • This is divided by difference of the lowest observation and the highest observation (R) • If the D/R ration is greater than 1/3, this point may be an outliers. • In a sample size of 20, allowed 2 outliers • If > 2 outliers, must test an additional 20 normal • If another 2 outliers other sources of errors (reagents, analyzers, biological variations) should be investigated • A full RI may have to be conducted. Higgins R, Olson J, CAPToday, 2015;15: 55.
  • 46. Transference • Validation of a RI conducted by a manufacturer • Smaller number of subjects n=20 • Compared to a larger study • Keeping in mind the importance in using the same analytical test system and reagents • If a laboratory changes methods and the method comparison is compatible, the RI can be transferred
  • 47. Transference • A laboratory can elect to “transfer” the RIs that were in use with an older method (or from another laboratory) to a new method. • To do this, the laboratory must first demonstrate that the 2 methods produce comparable results. • It is well known that analytic systems drift over time, and there is no guarantee that the method of today is producing results that are comparable to those that were produced at the time of the original RI study. • This technique is the main reason why many laboratories today are using RIs that were established decades ago and are out-of-date.
  • 48. Transferring existing reference intervals • Normal laboratory practice is to perform a method comparison study in which the same fresh patient samples are measured by both methods. If the study shows that the two assays are completely comparable across the measuring range (good correlation and no bias), then the reference interval can be adopted unchanged. • Alternatively, if the study shows good correlation but a proportional negative or positive bias between the two methods, it may be acceptable to use the regression equation generated by the study to "correct" the reference interval to take account of this systematic bias. • The guidelines provide the following example of the way this is applied: The results of a comparison study of methods x (old method) and y (new method to be adopted) across a concentration range of 50-250 give the best-fit linear regression line: y = 1.57x - 0.832 correlation coefficient r2 = 0.990 The established reference interval for method x is 50-150. Since there is excellent correlation but proportional bias between the two methods, the "corrected" reference interval for method y can be calculated thus: For the lower limit 50 y = (1.57 × 50) - 0.832 = 77.72 (which rounds up to 78) For the high limit 150 y = (1.57 × 150) - 0.832 = 234.82 (which rounds up to 235) The reference interval to be adopted for the new method y is 78-235.
  • 49. Using this method: • A minimum of 40 patient samples should be tested across the reportable range (absence of disease, and with disease) • Advantage of the transferring protocol is that it does not require analysis of samples from reference individuals. • Limited application because it only applies if the reference interval in question has been in use at that particular institution. • Most important is making the decision about whether or not the two methods agree sufficiently for them to share the same reference interval • If that is hard to determine guidelines suggest that validation of the reference interval is indicated.
  • 50. Verify An established reference interval • Verification of an established reference interval is used when a laboratory adopts an established reference interval that is from a manufacturer or another laboratory using the same or similar analytical system. • The preanalytical protocol for processing patient samples should not be significantly different from that used for determining reference values when establishing the reference interval. • The verification study is designed to confirm that the established reference interval is appropriate for the population served by the adopting laboratory. • Reference values for at least 20 healthy individuals representative of the adopting laboratory's healthy population. • The exclusion criteria for the selection of reference individualsused should be the same as the original study. • If the review is considered compatible with the testing laboratory, the RI can be used • The review needs to be purposeful and documented
  • 51.
  • 52. Plan, plan, plan the study
  • 53. Pre-Analytical: 50-70% of errors occur here! • Have a well written SOP that includes relevant stakeholders including phlebotomy, time frames and where and when the study will be conducted. • Will this be a verification or validation? How many samples will be required? How much volume is required? Will additional volume be required for freezing? • What is your institutional policy? Is there IRB approval? Do you have a consent form? • Do you have a questionnaire, will the study be a priori or a posteri? • Who will recruit/ consent/ draw the subjects? • Do I have sufficient representation of males/females as well as ethnic groups that represent your testing population? • What is exclusion criteria? Is this for only adults? Children? Geriatric?
  • 54. Analytical: • Do you have sufficient reagents to conduct the study? How many sites? How many analyzers? • Are the analyzers working correctly? Should there be a preventative maintenance? • Are the centrifuges working correctly? • Will the study be conducted over a period of time to introduce analytical variables that are seen in patient testing? How many samples/day? • Will all samples be run fresh? Will some be run frozen?Who will aliquot samples to be frozen?
  • 55. Post Analytical • What is considered an outlier? • Who will do the statistical analysis?What type will be based on the amount of samples? Parametric, non-parametric? • Analyze the reference values: select a statistical method and calculate the limits of reference and the reference interval • Report sign off • Update LIS and downstream systems • Alert clinicians to range changes.
  • 56. RI requirements Reference Interval requirements • RI should reflect patient population testing • If possible a full validation should be conducted (120) • If not possible, the level of uncertainty the laboratory is willing to accept needs to be considered. • Method for determining outliers Issues when conducting a Reference Interval • Testing is expensive • Procedures are labor intensive, time consuming • Is a reference interval required, or does there need to be a cutoff • Where do I get the subjects? • What is considered healthy?
  • 57. Conclusion • Conducting a Reference Range Interval is a complicated process • Carefully planned and documented event • The more defined your population and subject selection and the more controlled your pre-analytical variables are the better the outcomes • If a RI is to be transference, should be compatible for reagent/instrument combination and the testing population • Ensure best possible results to provide tools for clinicians to diagnose disorders and provide optimal treatment to patients