SlideShare a Scribd company logo
Hyundai Commercial
is…
Investor Presentation Hyundai Commercial
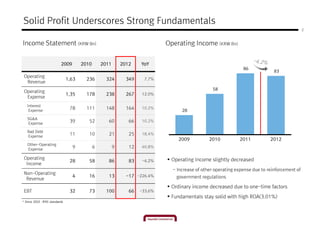
Solid Profit Underscores Strong Fundamentals
                                                                                                                                                2


Income Statement (KRW Bn)                                                     Operating Income (KRW Bn)


                           2009        2010       2011       2012    YoY
                                                                                                                 86
                                                                                                                                83
 Operating
                                1,63     236        324        349    7.7%
  Revenue
                                                                                                   58
 Operating
                                1,35     178        238        267   12.0%
  Expense
   Interest
    Expense
                                 78      111        148        164   10.2%
                                                                                    28
   SG&A
   Expense
                                 39       52         60         66   10.2%

   Bad Debt
   Expense
                                 11       10         21         25   18.4%
                                                                                   2009          2010           2011          2012
   Other-Operating
   Expense
                                  9           6          9      12   40.8%

 Operating                                                                      Operating Income slightly decreased
                                 28       58         86         83    -4.2%
  Income
                                                                                - Increase of other operating expense due to reinforcement of
 Non-Operating
                                  4       16         13        -17 -226.4%        government regulations
  Revenue
                                                                                Ordinary income decreased due to one-time factors
 EBT                             32       73        100         66   -33.6%
                                                                                Fundamentals stay solid with high ROA(3.01%)
* Since 2010 : IFRS standards
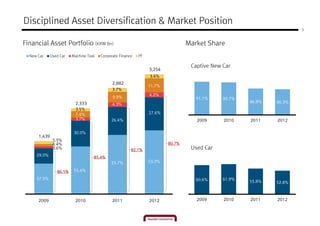
Disciplined Asset Diversification & Market Position
                                                                                                                     3


Financial Asset Portfolio (KRW Bn)                                              Market Share
  New Car    Used Car   Machine Tool   Corporate Finance   PF

                                                                                 Captive New Car
                                                                3,254
                                   8.8                          3.4%
                                   %         2,882
                                                                11.7%
                                             3.7%
                                                                4.2%
                                             9.9%                                  91.1%     90.7%
                          2,333                                                                      86.8%   86.3%
                                             4.3%
                          3.5%
                          7.4%                                  27.6%
                          3.7%              26.4%                                  2009      2010    2011    2012

                         30.0%
      1,439
              5.5%
              4.4%                                                      80.7%
              3.6%                                     82.1%                     Used Car
     29.0%
                                   85.4%
                                            55.7%               53.2%

                86.5%    55.4%

     57.5%                                                                         60.6%     61.9%
                                                                                                     55.8%   52.8%


      2009                2010               2011               2012               2009      2010    2011    2012
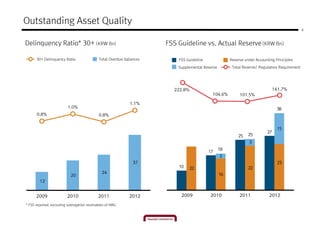
Outstanding Asset Quality
                                                                                                                                               4


Delinquency Ratio* 30+ (KRW Bn)                                       FSS Guideline vs. Actual Reserve (KRW Bn)

      30+ Delinquency Ratio                  Total Overdue balances       FSS Guideline               Reserve under Accounting Principles
                                                                          Supplemental Reserve         Total Reserve/ Regulatory Requirement


                                                                         222.8%                                                141.7%
                                                                                           104.6%          101.5%

                                                             1.1%
                         1.0%                                                                                                   38
      0.8%                                   0.8%


                                                                                                                                15
                                                                                                                          27
                                                                                                          25    25
                                                                                                                3
                                                                                                 18
                                                                                          17
                                                                                                 2
                                                               37                                                               23
                                                                          10      22                            22
                                               24                                                16
                           20
        12


      2009               2010               2011             2012          2009           2010             2011            2012

* FSS reported, excluding subrogation receivables of HMG
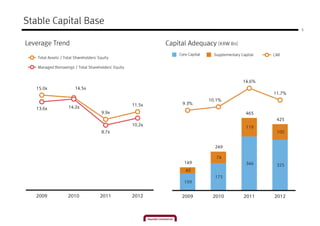
Stable Capital Base
                                                                                                                   5


Leverage Trend                                                Capital Adequacy (KRW Bn)
                                                                  Core Capital     Supplementary Capital   CAR
    Total Assets / Total Shareholders' Equity

    Managed Borrowings / Total Shareholders' Equity


                                                                                                  14.6%
   15.0x                 14.5x
                                                                                                           11.7%
                                                                                 10.1%
                                                      11.5x        9.3%
   13.6x             14.2x
                                        9.9x                                                        465
                                                                                                            425
                                                      10.2x
                                                                                                    119
                                        8.7x                                                                100


                                                                                   249

                                                                                    74
                                                                    149                             346     325
                                                                     40
                                                                                   175
                                                                    109


   2009              2010               2011          2012         2009           2010            2011     2012
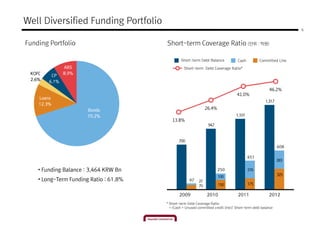
Well Diversified Funding Portfolio
                                                                                                                   6


Funding Portfolio                       Short-term Coverage Ratio (단위 : 억원)

                                                Short-term Debt Balance             Cash         Committed Line
               ABS                                Short-term Debt Coverage Ratio*
 KOFC          8.9%
         CP
 2.6%   6.1%
                                                                                                       46.2%
                                                                                   41.0%
    Loans
                                                                                                     1,317
    12.3%
                       Bonds                                     26.4%
                       70.2%                                                       1,101
                                           13.8%
                                                                  947


                                               700
                                                                                                             608

                                                                                           451
                                                                                                             283

    • Funding Balance : 3,464 KRW Bn                                     250               276
                                                                                                             325
                                                                         100
    • Long-Term Funding Ratio : 61.8%                 97    27
                                                            70           150               175

                                               2009              2010               2011               2012
                                        * Short-term Debt Coverage Ratio
                                          = (Cash + Unused committed credit line)/ Short-term debt balance
[Appendix 1] Fact Sheet - HCI

                 (Unit : KRW Bn)                  2008     2009     2010     2011     2012

 Domestic Sales of                 Sum(unit)      20,152   19,795   21,479   18,842   15,620
Commercial Vehicles          HMC/KMC M/S          54.0%    60.1%    64.2%    65.8%    62.3%
                                     Total        1,050    1,439    2,333    2,882    3,254
      Asset
                               Auto Sector        77.8%    86.4%    85.4%    82.1%    80.7%
     Portfolio
                                    Others        22.2%    13.6%    14.6%    17.9%    19.3%

                          Substandard & Below      1.2%     0.7%     0.9%     1.2%     1.5%

       Asset                         NPL           1.2%     0.6%     0.6%     1.0%     1.0%
      Quality               30+ Delinquency        2.1%     0.9%     1.0%     0.8%     1.1%

                           NPL Coverage ratio     140.8%   224.7%   172.5%   84.1%    114.8%

    Profitability           Operating Income       14.1     27.6     57.5     86.4     82.8

      Asset &            Capital Adequacy Ratio    7.8%     9.3%    10.1%    14.6%    11.7%
     Leverage              Borrowing Leverage     15.3X    15.0X    14.5X     9.9X    11.5X

                               Bond / Loan        91.1%    80.9%    78.8%    83.5%    85.0%
                                      CP           8.9%    19.1%    13.0%     4.6%     6.1%
     Funding
                                     ABS            -        -       8.1%    11.9%     8.9%
     Portfolio
                                     Total         998     1,481    2,477    3,026    3,464

                               CP Coverage        124.1%   34.2%    77.4%    322.1%   289.4%

                              Debt Maturity         -      1.37Y    1.69Y    1.79Y    1.66Y
      Debt
                                   Maturity       2013     2014     2015     2016     2017∼
     Maturity
                                    Volume        1,317    1,062     586      300      200

More Related Content

What's hot

Ernings Release 4 Q08
Ernings Release 4 Q08Ernings Release 4 Q08
Ernings Release 4 Q08Profarma
 
Profarma 4Q10
Profarma 4Q10Profarma 4Q10
Profarma 4Q10Profarma
 
Profarma 4Q10
Profarma 4Q10Profarma 4Q10
Profarma 4Q10Profarma
 
Ashok leyland ru4 qfy2010-300410
Ashok leyland ru4 qfy2010-300410Ashok leyland ru4 qfy2010-300410
Ashok leyland ru4 qfy2010-300410Angel Broking
 
Apresentação 3 q11 e 9m11 eng
Apresentação 3 q11 e 9m11 engApresentação 3 q11 e 9m11 eng
Apresentação 3 q11 e 9m11 engLocaliza
 
leggett & platt 2006_11yr_data
leggett & platt 2006_11yr_dataleggett & platt 2006_11yr_data
leggett & platt 2006_11yr_datafinance39
 
Eagle Bulk Q4 2012 earnings presentation
Eagle Bulk Q4 2012 earnings presentationEagle Bulk Q4 2012 earnings presentation
Eagle Bulk Q4 2012 earnings presentationTradeWindsnews
 
leggett & platt 2006_fin_complete
leggett & platt 2006_fin_completeleggett & platt 2006_fin_complete
leggett & platt 2006_fin_completefinance39
 
Apresentação 1 q12 eng-1
Apresentação 1 q12 eng-1Apresentação 1 q12 eng-1
Apresentação 1 q12 eng-1Localiza
 
Apresentação 1 q12 eng
Apresentação 1 q12 engApresentação 1 q12 eng
Apresentação 1 q12 engLocaliza
 
4Q10 Presentation eng
4Q10 Presentation eng4Q10 Presentation eng
4Q10 Presentation engLocaliza
 
eCosway 2011 Company Interim Report - eCosway UK and International
eCosway 2011 Company Interim Report - eCosway UK and InternationaleCosway 2011 Company Interim Report - eCosway UK and International
eCosway 2011 Company Interim Report - eCosway UK and International
eCosway UK - Franchise For Free
 

What's hot (16)

Ernings Release 4 Q08
Ernings Release 4 Q08Ernings Release 4 Q08
Ernings Release 4 Q08
 
Profarma 4Q10
Profarma 4Q10Profarma 4Q10
Profarma 4Q10
 
Profarma 4Q10
Profarma 4Q10Profarma 4Q10
Profarma 4Q10
 
Ashok leyland ru4 qfy2010-300410
Ashok leyland ru4 qfy2010-300410Ashok leyland ru4 qfy2010-300410
Ashok leyland ru4 qfy2010-300410
 
Apresentação 3 q11 e 9m11 eng
Apresentação 3 q11 e 9m11 engApresentação 3 q11 e 9m11 eng
Apresentação 3 q11 e 9m11 eng
 
leggett & platt 2006_11yr_data
leggett & platt 2006_11yr_dataleggett & platt 2006_11yr_data
leggett & platt 2006_11yr_data
 
Apimec – 1 q07 results
Apimec – 1 q07 resultsApimec – 1 q07 results
Apimec – 1 q07 results
 
Cesc
Cesc Cesc
Cesc
 
Eagle Bulk Q4 2012 earnings presentation
Eagle Bulk Q4 2012 earnings presentationEagle Bulk Q4 2012 earnings presentation
Eagle Bulk Q4 2012 earnings presentation
 
leggett & platt 2006_fin_complete
leggett & platt 2006_fin_completeleggett & platt 2006_fin_complete
leggett & platt 2006_fin_complete
 
Maruti
Maruti Maruti
Maruti
 
Apresentação 1 q12 eng-1
Apresentação 1 q12 eng-1Apresentação 1 q12 eng-1
Apresentação 1 q12 eng-1
 
Apresentação 1 q12 eng
Apresentação 1 q12 engApresentação 1 q12 eng
Apresentação 1 q12 eng
 
Apimec 4 q06 results
Apimec   4 q06 resultsApimec   4 q06 results
Apimec 4 q06 results
 
4Q10 Presentation eng
4Q10 Presentation eng4Q10 Presentation eng
4Q10 Presentation eng
 
eCosway 2011 Company Interim Report - eCosway UK and International
eCosway 2011 Company Interim Report - eCosway UK and InternationaleCosway 2011 Company Interim Report - eCosway UK and International
eCosway 2011 Company Interim Report - eCosway UK and International
 

Similar to 2012년 hci 실적_발표자료_eng

Profarma 4 q12
Profarma 4 q12Profarma 4 q12
Profarma 4 q12Profarma
 
Earnings Release 4Q07 Presentation
Earnings Release 4Q07 PresentationEarnings Release 4Q07 Presentation
Earnings Release 4Q07 PresentationProfarma
 
Profarma Apresentacao 3 Q08 20081105 Eng
Profarma Apresentacao 3 Q08 20081105 EngProfarma Apresentacao 3 Q08 20081105 Eng
Profarma Apresentacao 3 Q08 20081105 Engprofarma1
 
Apresentação 4 q11 e 2011 eng final
Apresentação 4 q11 e 2011 eng finalApresentação 4 q11 e 2011 eng final
Apresentação 4 q11 e 2011 eng finalLocaliza
 
Earnings Release 3 Q08
Earnings Release 3 Q08Earnings Release 3 Q08
Earnings Release 3 Q08Profarma
 
Earnings Release 3Q08 Presentation
Earnings Release 3Q08 PresentationEarnings Release 3Q08 Presentation
Earnings Release 3Q08 PresentationProfarma
 
Brmalls Transc 1q08 20080602 Eng
Brmalls Transc 1q08 20080602 EngBrmalls Transc 1q08 20080602 Eng
Brmalls Transc 1q08 20080602 EngBRMALLS
 
ApresentaçãO 2 Q08 Ing
ApresentaçãO 2 Q08 IngApresentaçãO 2 Q08 Ing
ApresentaçãO 2 Q08 IngBRMALLS
 
omnicom group Q4 2008 Investor Presentation
omnicom group  Q4 2008 Investor Presentationomnicom group  Q4 2008 Investor Presentation
omnicom group Q4 2008 Investor Presentationfinance22
 
Q2 2012 Financial Highlights
Q2 2012 Financial HighlightsQ2 2012 Financial Highlights
Q2 2012 Financial Highlights
Aimia's Investor Presentations
 
Profarma 4 q11
Profarma 4 q11Profarma 4 q11
Profarma 4 q11Profarma
 
4 q12 arezzo_apresentacao_call eng
4 q12 arezzo_apresentacao_call eng4 q12 arezzo_apresentacao_call eng
4 q12 arezzo_apresentacao_call engArezzori
 
Arq 94 229289
Arq 94 229289Arq 94 229289
Arq 94 229289Localiza
 
Arq 94 229289
Arq 94 229289Arq 94 229289
Arq 94 229289Localiza
 
Call 1 q12
Call 1 q12Call 1 q12
Call 1 q12BRMALLS
 
Profarma 3Q12
Profarma 3Q12Profarma 3Q12
Profarma 3Q12Profarma
 

Similar to 2012년 hci 실적_발표자료_eng (20)

Profarma 4 q12
Profarma 4 q12Profarma 4 q12
Profarma 4 q12
 
Earnings Release 4Q07 Presentation
Earnings Release 4Q07 PresentationEarnings Release 4Q07 Presentation
Earnings Release 4Q07 Presentation
 
Profarma Apresentacao 3 Q08 20081105 Eng
Profarma Apresentacao 3 Q08 20081105 EngProfarma Apresentacao 3 Q08 20081105 Eng
Profarma Apresentacao 3 Q08 20081105 Eng
 
Apimec – 4 q07 results
Apimec – 4 q07 resultsApimec – 4 q07 results
Apimec – 4 q07 results
 
Apresentação 4 q11 e 2011 eng final
Apresentação 4 q11 e 2011 eng finalApresentação 4 q11 e 2011 eng final
Apresentação 4 q11 e 2011 eng final
 
Earnings Release 3 Q08
Earnings Release 3 Q08Earnings Release 3 Q08
Earnings Release 3 Q08
 
Earnings Release 3Q08 Presentation
Earnings Release 3Q08 PresentationEarnings Release 3Q08 Presentation
Earnings Release 3Q08 Presentation
 
Brmalls Transc 1q08 20080602 Eng
Brmalls Transc 1q08 20080602 EngBrmalls Transc 1q08 20080602 Eng
Brmalls Transc 1q08 20080602 Eng
 
ApresentaçãO 2 Q08 Ing
ApresentaçãO 2 Q08 IngApresentaçãO 2 Q08 Ing
ApresentaçãO 2 Q08 Ing
 
Presentation 2Q12
Presentation 2Q12Presentation 2Q12
Presentation 2Q12
 
omnicom group Q4 2008 Investor Presentation
omnicom group  Q4 2008 Investor Presentationomnicom group  Q4 2008 Investor Presentation
omnicom group Q4 2008 Investor Presentation
 
Q2 2012 Financial Highlights
Q2 2012 Financial HighlightsQ2 2012 Financial Highlights
Q2 2012 Financial Highlights
 
Profarma 4 q11
Profarma 4 q11Profarma 4 q11
Profarma 4 q11
 
4 q12 arezzo_apresentacao_call eng
4 q12 arezzo_apresentacao_call eng4 q12 arezzo_apresentacao_call eng
4 q12 arezzo_apresentacao_call eng
 
Arq 94 229289
Arq 94 229289Arq 94 229289
Arq 94 229289
 
Arq 94 229289
Arq 94 229289Arq 94 229289
Arq 94 229289
 
Call 1 q12
Call 1 q12Call 1 q12
Call 1 q12
 
Profarma 3Q12
Profarma 3Q12Profarma 3Q12
Profarma 3Q12
 
2Q09 Earnings Release
2Q09 Earnings Release2Q09 Earnings Release
2Q09 Earnings Release
 
Webcast 4 Q11 Eng
Webcast 4 Q11 EngWebcast 4 Q11 Eng
Webcast 4 Q11 Eng
 

More from Hyundai Finance

4 q20 ir hcc
4 q20 ir hcc4 q20 ir hcc
4 q20 ir hcc
Hyundai Finance
 
20년3분기 KOR
20년3분기 KOR20년3분기 KOR
20년3분기 KOR
Hyundai Finance
 
20년 3분기_EN
20년 3분기_EN20년 3분기_EN
20년 3분기_EN
Hyundai Finance
 
Hcs q3 2020_consol_final
Hcs q3 2020_consol_finalHcs q3 2020_consol_final
Hcs q3 2020_consol_final
Hyundai Finance
 
Hyundai card con_2020_3_q
Hyundai card con_2020_3_qHyundai card con_2020_3_q
Hyundai card con_2020_3_q
Hyundai Finance
 
Hyundai card con_2020_3_q
Hyundai card con_2020_3_qHyundai card con_2020_3_q
Hyundai card con_2020_3_q
Hyundai Finance
 
3 q20 hcs_presentation_web_jp_201123.vf
3 q20 hcs_presentation_web_jp_201123.vf3 q20 hcs_presentation_web_jp_201123.vf
3 q20 hcs_presentation_web_jp_201123.vf
Hyundai Finance
 
Hcc fy2020 q3 (consol)_fin_signed
Hcc fy2020 q3 (consol)_fin_signedHcc fy2020 q3 (consol)_fin_signed
Hcc fy2020 q3 (consol)_fin_signed
Hyundai Finance
 
3 q20 hcc_presentation_web_eng_f2
3 q20 hcc_presentation_web_eng_f23 q20 hcc_presentation_web_eng_f2
3 q20 hcc_presentation_web_eng_f2
Hyundai Finance
 
3 q20 hcc_presentation_web_kor_f2
3 q20 hcc_presentation_web_kor_f23 q20 hcc_presentation_web_kor_f2
3 q20 hcc_presentation_web_kor_f2
Hyundai Finance
 
Hcs fy2020 q3 (consol)_fin_signed
Hcs fy2020 q3 (consol)_fin_signedHcs fy2020 q3 (consol)_fin_signed
Hcs fy2020 q3 (consol)_fin_signed
Hyundai Finance
 
3 q20 hcs_presentation_web_en_201118.vf
3 q20 hcs_presentation_web_en_201118.vf3 q20 hcs_presentation_web_en_201118.vf
3 q20 hcs_presentation_web_en_201118.vf
Hyundai Finance
 
3 q20 hcs_presentation_web_kor_201118.vf
3 q20 hcs_presentation_web_kor_201118.vf3 q20 hcs_presentation_web_kor_201118.vf
3 q20 hcs_presentation_web_kor_201118.vf
Hyundai Finance
 
2020 hcs cny green bond assurance report
2020 hcs cny green bond assurance report2020 hcs cny green bond assurance report
2020 hcs cny green bond assurance report
Hyundai Finance
 
Green bond framework
Green bond frameworkGreen bond framework
Green bond framework
Hyundai Finance
 
Green bond report
Green bond reportGreen bond report
Green bond report
Hyundai Finance
 
Hyundai card (con) 2020_2_q_0902
Hyundai card (con) 2020_2_q_0902Hyundai card (con) 2020_2_q_0902
Hyundai card (con) 2020_2_q_0902
Hyundai Finance
 
Hcs 2 q_2020_consol_
Hcs 2 q_2020_consol_Hcs 2 q_2020_consol_
Hcs 2 q_2020_consol_
Hyundai Finance
 
Hcc kr
Hcc krHcc kr
2020 hcs presentation_web_kor_200818.v4_jp
2020 hcs presentation_web_kor_200818.v4_jp2020 hcs presentation_web_kor_200818.v4_jp
2020 hcs presentation_web_kor_200818.v4_jp
Hyundai Finance
 

More from Hyundai Finance (20)

4 q20 ir hcc
4 q20 ir hcc4 q20 ir hcc
4 q20 ir hcc
 
20년3분기 KOR
20년3분기 KOR20년3분기 KOR
20년3분기 KOR
 
20년 3분기_EN
20년 3분기_EN20년 3분기_EN
20년 3분기_EN
 
Hcs q3 2020_consol_final
Hcs q3 2020_consol_finalHcs q3 2020_consol_final
Hcs q3 2020_consol_final
 
Hyundai card con_2020_3_q
Hyundai card con_2020_3_qHyundai card con_2020_3_q
Hyundai card con_2020_3_q
 
Hyundai card con_2020_3_q
Hyundai card con_2020_3_qHyundai card con_2020_3_q
Hyundai card con_2020_3_q
 
3 q20 hcs_presentation_web_jp_201123.vf
3 q20 hcs_presentation_web_jp_201123.vf3 q20 hcs_presentation_web_jp_201123.vf
3 q20 hcs_presentation_web_jp_201123.vf
 
Hcc fy2020 q3 (consol)_fin_signed
Hcc fy2020 q3 (consol)_fin_signedHcc fy2020 q3 (consol)_fin_signed
Hcc fy2020 q3 (consol)_fin_signed
 
3 q20 hcc_presentation_web_eng_f2
3 q20 hcc_presentation_web_eng_f23 q20 hcc_presentation_web_eng_f2
3 q20 hcc_presentation_web_eng_f2
 
3 q20 hcc_presentation_web_kor_f2
3 q20 hcc_presentation_web_kor_f23 q20 hcc_presentation_web_kor_f2
3 q20 hcc_presentation_web_kor_f2
 
Hcs fy2020 q3 (consol)_fin_signed
Hcs fy2020 q3 (consol)_fin_signedHcs fy2020 q3 (consol)_fin_signed
Hcs fy2020 q3 (consol)_fin_signed
 
3 q20 hcs_presentation_web_en_201118.vf
3 q20 hcs_presentation_web_en_201118.vf3 q20 hcs_presentation_web_en_201118.vf
3 q20 hcs_presentation_web_en_201118.vf
 
3 q20 hcs_presentation_web_kor_201118.vf
3 q20 hcs_presentation_web_kor_201118.vf3 q20 hcs_presentation_web_kor_201118.vf
3 q20 hcs_presentation_web_kor_201118.vf
 
2020 hcs cny green bond assurance report
2020 hcs cny green bond assurance report2020 hcs cny green bond assurance report
2020 hcs cny green bond assurance report
 
Green bond framework
Green bond frameworkGreen bond framework
Green bond framework
 
Green bond report
Green bond reportGreen bond report
Green bond report
 
Hyundai card (con) 2020_2_q_0902
Hyundai card (con) 2020_2_q_0902Hyundai card (con) 2020_2_q_0902
Hyundai card (con) 2020_2_q_0902
 
Hcs 2 q_2020_consol_
Hcs 2 q_2020_consol_Hcs 2 q_2020_consol_
Hcs 2 q_2020_consol_
 
Hcc kr
Hcc krHcc kr
Hcc kr
 
2020 hcs presentation_web_kor_200818.v4_jp
2020 hcs presentation_web_kor_200818.v4_jp2020 hcs presentation_web_kor_200818.v4_jp
2020 hcs presentation_web_kor_200818.v4_jp
 

2012년 hci 실적_발표자료_eng

  • 2. Solid Profit Underscores Strong Fundamentals 2 Income Statement (KRW Bn) Operating Income (KRW Bn) 2009 2010 2011 2012 YoY 86 83 Operating 1,63 236 324 349 7.7% Revenue 58 Operating 1,35 178 238 267 12.0% Expense Interest Expense 78 111 148 164 10.2% 28 SG&A Expense 39 52 60 66 10.2% Bad Debt Expense 11 10 21 25 18.4% 2009 2010 2011 2012 Other-Operating Expense 9 6 9 12 40.8% Operating Operating Income slightly decreased 28 58 86 83 -4.2% Income - Increase of other operating expense due to reinforcement of Non-Operating 4 16 13 -17 -226.4% government regulations Revenue Ordinary income decreased due to one-time factors EBT 32 73 100 66 -33.6% Fundamentals stay solid with high ROA(3.01%) * Since 2010 : IFRS standards
  • 3. Disciplined Asset Diversification & Market Position 3 Financial Asset Portfolio (KRW Bn) Market Share New Car Used Car Machine Tool Corporate Finance PF Captive New Car 3,254 8.8 3.4% % 2,882 11.7% 3.7% 4.2% 9.9% 91.1% 90.7% 2,333 86.8% 86.3% 4.3% 3.5% 7.4% 27.6% 3.7% 26.4% 2009 2010 2011 2012 30.0% 1,439 5.5% 4.4% 80.7% 3.6% 82.1% Used Car 29.0% 85.4% 55.7% 53.2% 86.5% 55.4% 57.5% 60.6% 61.9% 55.8% 52.8% 2009 2010 2011 2012 2009 2010 2011 2012
  • 4. Outstanding Asset Quality 4 Delinquency Ratio* 30+ (KRW Bn) FSS Guideline vs. Actual Reserve (KRW Bn) 30+ Delinquency Ratio Total Overdue balances FSS Guideline Reserve under Accounting Principles Supplemental Reserve Total Reserve/ Regulatory Requirement 222.8% 141.7% 104.6% 101.5% 1.1% 1.0% 38 0.8% 0.8% 15 27 25 25 3 18 17 2 37 23 10 22 22 24 16 20 12 2009 2010 2011 2012 2009 2010 2011 2012 * FSS reported, excluding subrogation receivables of HMG
  • 5. Stable Capital Base 5 Leverage Trend Capital Adequacy (KRW Bn) Core Capital Supplementary Capital CAR Total Assets / Total Shareholders' Equity Managed Borrowings / Total Shareholders' Equity 14.6% 15.0x 14.5x 11.7% 10.1% 11.5x 9.3% 13.6x 14.2x 9.9x 465 425 10.2x 119 8.7x 100 249 74 149 346 325 40 175 109 2009 2010 2011 2012 2009 2010 2011 2012
  • 6. Well Diversified Funding Portfolio 6 Funding Portfolio Short-term Coverage Ratio (단위 : 억원) Short-term Debt Balance Cash Committed Line ABS Short-term Debt Coverage Ratio* KOFC 8.9% CP 2.6% 6.1% 46.2% 41.0% Loans 1,317 12.3% Bonds 26.4% 70.2% 1,101 13.8% 947 700 608 451 283 • Funding Balance : 3,464 KRW Bn 250 276 325 100 • Long-Term Funding Ratio : 61.8% 97 27 70 150 175 2009 2010 2011 2012 * Short-term Debt Coverage Ratio = (Cash + Unused committed credit line)/ Short-term debt balance
  • 7. [Appendix 1] Fact Sheet - HCI (Unit : KRW Bn) 2008 2009 2010 2011 2012 Domestic Sales of Sum(unit) 20,152 19,795 21,479 18,842 15,620 Commercial Vehicles HMC/KMC M/S 54.0% 60.1% 64.2% 65.8% 62.3% Total 1,050 1,439 2,333 2,882 3,254 Asset Auto Sector 77.8% 86.4% 85.4% 82.1% 80.7% Portfolio Others 22.2% 13.6% 14.6% 17.9% 19.3% Substandard & Below 1.2% 0.7% 0.9% 1.2% 1.5% Asset NPL 1.2% 0.6% 0.6% 1.0% 1.0% Quality 30+ Delinquency 2.1% 0.9% 1.0% 0.8% 1.1% NPL Coverage ratio 140.8% 224.7% 172.5% 84.1% 114.8% Profitability Operating Income 14.1 27.6 57.5 86.4 82.8 Asset & Capital Adequacy Ratio 7.8% 9.3% 10.1% 14.6% 11.7% Leverage Borrowing Leverage 15.3X 15.0X 14.5X 9.9X 11.5X Bond / Loan 91.1% 80.9% 78.8% 83.5% 85.0% CP 8.9% 19.1% 13.0% 4.6% 6.1% Funding ABS - - 8.1% 11.9% 8.9% Portfolio Total 998 1,481 2,477 3,026 3,464 CP Coverage 124.1% 34.2% 77.4% 322.1% 289.4% Debt Maturity - 1.37Y 1.69Y 1.79Y 1.66Y Debt Maturity 2013 2014 2015 2016 2017∼ Maturity Volume 1,317 1,062 586 300 200