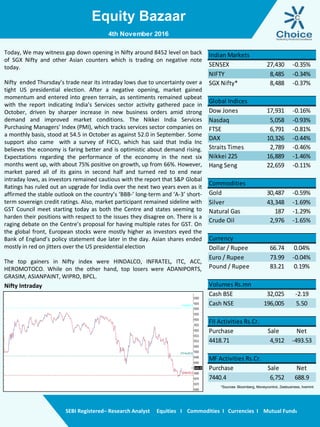
- The Nifty index opened lower on Thursday due to uncertainty in the US presidential election and weakness in Asian markets. It recovered briefly but then fell to end near the day's lows.
- Services sector activity in India increased in October driven by rising new orders, but the market declined due to S&P rating agency ruling out an upgrade for India for the next two years.
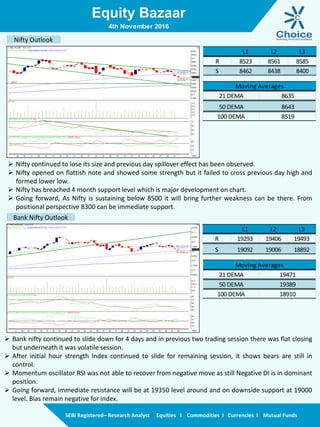
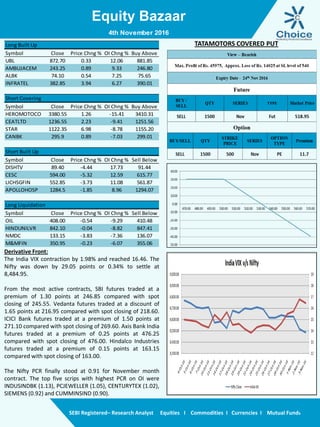
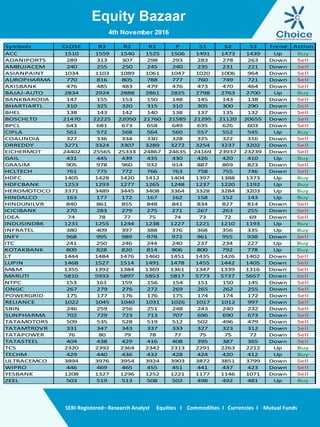
- Most Asian markets ended lower due to election jitters while European stocks were mixed ahead of a Bank of England policy decision. The report provides technical analysis and recommendations for various stocks.