In an era where environmental concerns are escalating, air quality forecasting emerges. Forecasting is a crucial tool for addressing the adverse impacts of pollution on public health and ecosystems. In urban centers like Bandar Lampung, economic activities intensify pollution levels. This condition leveraging advanced machine learning forecasting methods can significantly mitigate these effects. This study evaluates the precision of long short-term memory (LSTM) and Prophet methods in predicting air quality. This study utilizes data from January 12, 2022 to November 9, 2023. The results reveal a distinct advantage of the LSTM method over the Prophet. The LSTM method showcases superior accuracy across all evaluation metrics. Specifically, the LSTM method achieved an average root mean squared error (RMSE) of 5.38, mean absolute error (MAE) of 3.94, and mean absolute percentage error (MAPE) of 0.07. In contrast, the Prophet method recorded higher error rates, with an average RMSE of 18.48, MAE of 15.61, and MAPE of 0.25. These numbers underscore the LSTM method's robustness and reliability in forecasting air quality. The result highlights its potential as a pivotal resource for environmental monitoring and policymaking to safeguard public health and promote sustainable urban development.
![IAES International Journal of Artificial Intelligence (IJ-AI)
Vol. 14, No. 3, June 2025, pp. 2113~2122
ISSN: 2252-8938, DOI: 10.11591/ijai.v14.i3.pp2113-2122 2113
Journal homepage: http://ijai.iaescore.com
Advancing precision in air quality forecasting through machine
learning integration
Muhamad Komarudin1,2
, Sri Ratna Sulistiyanti1
, Suharso3
, Muhammad Irsyad4
, Hery Dian Septama1
,
Titin Yulianti1
, Ali Sophian5
, Michel1
1
Department of Electrical and Informatics Engineering, Faculty of Engineering, University of Lampung, Bandar Lampung, Indonesia
2
Environmental Science Graduate School, University of Lampung, Bandar Lampung, Indonesia
3
Department of Chemistry, Faculty of Mathematics and Natural Sciences, University of Lampung, Bandar Lampung, Indonesia
4
Department of Mechanical Engineering, Faculty of Engineering, University of Lampung, Bandar Lampung, Indonesia
5
Department of Mechatronics Engineering, International Islamic University Malaysia, Selangor, Malaysia
Article Info ABSTRACT
Article history:
Received Mar 21, 2024
Revised Feb 12, 2025
Accepted Mar 15, 2025
In an era where environmental concerns are escalating, air quality forecasting
emerges. Forecasting is a crucial tool for addressing the adverse impacts of
pollution on public health and ecosystems. In urban centers like Bandar
Lampung, economic activities intensify pollution levels. This condition
leveraging advanced machine learning forecasting methods can significantly
mitigate these effects. This study evaluates the precision of long short-term
memory (LSTM) and Prophet methods in predicting air quality. This study
utilizes data from January 12, 2022 to November 9, 2023. The results reveal a
distinct advantage of the LSTM method over the Prophet. The LSTM method
showcases superior accuracy across all evaluation metrics. Specifically, the
LSTM method achieved an average root mean squared error (RMSE) of 5.38,
mean absolute error (MAE) of 3.94, and mean absolute percentage error
(MAPE) of 0.07. In contrast, the Prophet method recorded higher error rates,
with an average RMSE of 18.48, MAE of 15.61, and MAPE of 0.25. These
numbers underscore the LSTM method's robustness and reliability in
forecasting air quality. The result highlights its potential as a pivotal resource
for environmental monitoring and policymaking to safeguard public health and
promote sustainable urban development.
Keywords:
Air quality
Forecasting
Machine learning
Precision
Public health
This is an open access article under the CC BY-SA license.
Corresponding Author:
Muhamad Komarudin
Environmental Science Graduate School and Department of Electrical and Informatics Engineering,
Faculty of Engineering, University of Lampung
Bandar Lampung, Indonesia
Email: m.komarudin@eng.unila.ac.id
1. INTRODUCTION
Air pollution is a major environmental issue affecting public health, ecosystems, and climate. This
issue makes it critical to implement proper monitoring and control strategies [1]. The presence of dust,
smoke, gases, and water vapor pollutants contributes to air pollution. It can lead to short-term and long-term
diseases in various body systems. This disease may impact the respiratory tract, heart, eyes, skin, and
reproductive and nervous systems [2]. Particulate matter, nitrogen dioxide, sulfur dioxide, and ground-level
ozone are the primary air pollutants responsible for various illnesses [3]. Exposure to these pollutants can
result in respiratory diseases, strokes, lung diseases, cardiovascular diseases, liver and blood diseases, and
other health issues [4]. The inhalation of particulate matter and gaseous pollutants can cause pulmonary
inflammation, chronic obstructive pulmonary disease, heart rate variability, ischemic heart disease, mental
and behavior disorders, and insulin resistance [5]. The effects of air pollution on health depend on various](https://image.slidesharecdn.com/4125561-250826093048-2c4e332a/75/Advancing-precision-in-air-quality-forecasting-through-machine-learning-integration-1-2048.jpg)
![ ISSN: 2252-8938
Int J Artif Intell, Vol. 14, No. 3, June 2025: 2113-2122
2114
factors, such as pollutant concentrations, chemical properties, age, general health, duration of exposure,
weather conditions, and distance from emission sources. Urbanization, industrialization, and globalization
have increased air pollution, particularly in developing countries [6]. Other issues include rapid urbanization,
industrialization, vehicular emissions, and deforestation. These sources emit a wide range of pollutants,
including particulate matter (PM), nitrogen dioxide (NO2), sulfur dioxide (SO2), and volatile organic
compounds (VOCs). Air pollution in urban areas is a significant concern since ambient air pollution
concentrations in many cities have reached levels that threaten people's health [7].
Urban air quality measurement is important for human health and the environment [8]. Indoor air
quality levels were also found to trigger building syndrome illness among occupant [9]–[11]. Traditional air
quality monitoring stations have spatial coverage and cost limitations. Several studies have explored
alternative methods to address this. Niepsch et al. [12] using lichens as biomonitoring tools to assess air
quality in urban areas. Several studies in low-cost particulate matter measurement devices have been
developed. This device is then deployed in urban areas to provide cost-efficient monitoring [13]–[15]. These
methods and devices can be used to monitor air quality limit values and assess the frequency of limit
exceedances [16], [17]. Others studies by [18], [19] integrating these low-cost devices with existing air
quality monitoring networks. The results can enhance understanding of air pollution sources and spatial
variability even in real time. Furthermore, the data collected by these monitoring devices can be analyzed.
Machine learning models can be used to analyze data precisely and quickly. Several studies have proven the
use of machine learning in various cases. Rogers et al. [20] using machine learning in climate variability to
provide accurate and timely weather forecasts. Another study by Suwadi et al. [21] uses machine learning to
forecast water quality.
Precise air quality forecasting has become an important strategy for managing air pollution. Air
pollution prediction models without machine learning have significant drawbacks. The complex source lists
of models like WRF-Chem and CMAQ require frequent updates. This limits their scalability, especially in
regions with limited resources. Therefore, it is hard to predict air pollution accurately across different terrains
[22], [23]. Time series data collected by air quality monitoring devices in urban environments can be
advanced through processing to yield air quality forecasts. Innovative forecasting methodologies have
emerged to ascertain air quality levels across diverse regions. This method incorporates various techniques
and computational models to enhance predictive precision [24]. Furthermore, the progress in machine
learning technologies is renowned for their ability to derive accurate predictions from complex datasets. This
method offers promising applications in air quality forecasting. Thus, it can potentially elevate the accuracy
and reliability of air quality predictions. The work in [25]–[28] uses time series data prediction methods and
machine learning to forecast air quality. The work offers promising results in air quality forecasting in
several urban cities [29], [30]. However, a comparative machine learning algorithm must be used to provide
more accurate data analysis for air quality forecasting.
This study addresses the problem of forecasting air pollution levels accuracy. Data on air pollution
from in urban city exemplifies these challenges. Bandar Lampung is a major urban city and economic hub in
Sumatra, Indonesia. Its strategic position as a gateway between the Java and Sumatra islands leads to heavy
traffic flow and industrial activity. Therefore, this condition makes air pollution levels worse in Bandar
Lampung. Traditional forecasting methods often struggle with the complexity and variability of
environmental data. The advent of artificial intelligence (AI) offers new possibilities for improving the
accuracy and reliability of air quality forecasts. Specifically, this research compares the effectiveness of two
AI-based forecasting methods: long short-term memory (LSTM) and Prophet. LSTM is known for its ability
to process time series data. It has the benefit of remembering information over long periods that is well-suited
for air quality forecasting [31]. Prophet provides a more straightforward approach that focuses on trend and
seasonality in time series data [32]. This study aims to identify the most effective model for supporting local
environmental management and public health. It also aims to evaluate the performance of these methods in
predicting air quality. The results may show the most precise model for advancing the precision of air quality
parameter forecasting.
2. MATERIAL AND METHOD
2.1. Material
This research uses air quality data for Bandar Lampung with an hourly time range from January 12, 2022
to November 9, 2023. Data was obtained from https://www.weatherbit.io/, a website that provides global and
local weather and air quality API services online global and local. The data consists of 11 columns containing
the variables AQI, CO, datetime, NO2, O3, PM10, PM2.5, SO2, timestamp_local, timestamp_utc, and ts, with
each column containing 15,153 rows of data.](https://image.slidesharecdn.com/4125561-250826093048-2c4e332a/75/Advancing-precision-in-air-quality-forecasting-through-machine-learning-integration-2-2048.jpg)
![Int J Artif Intell ISSN: 2252-8938
Advancing precision in air quality forecasting through machine learning… (Muhamad Komarudin)
2115
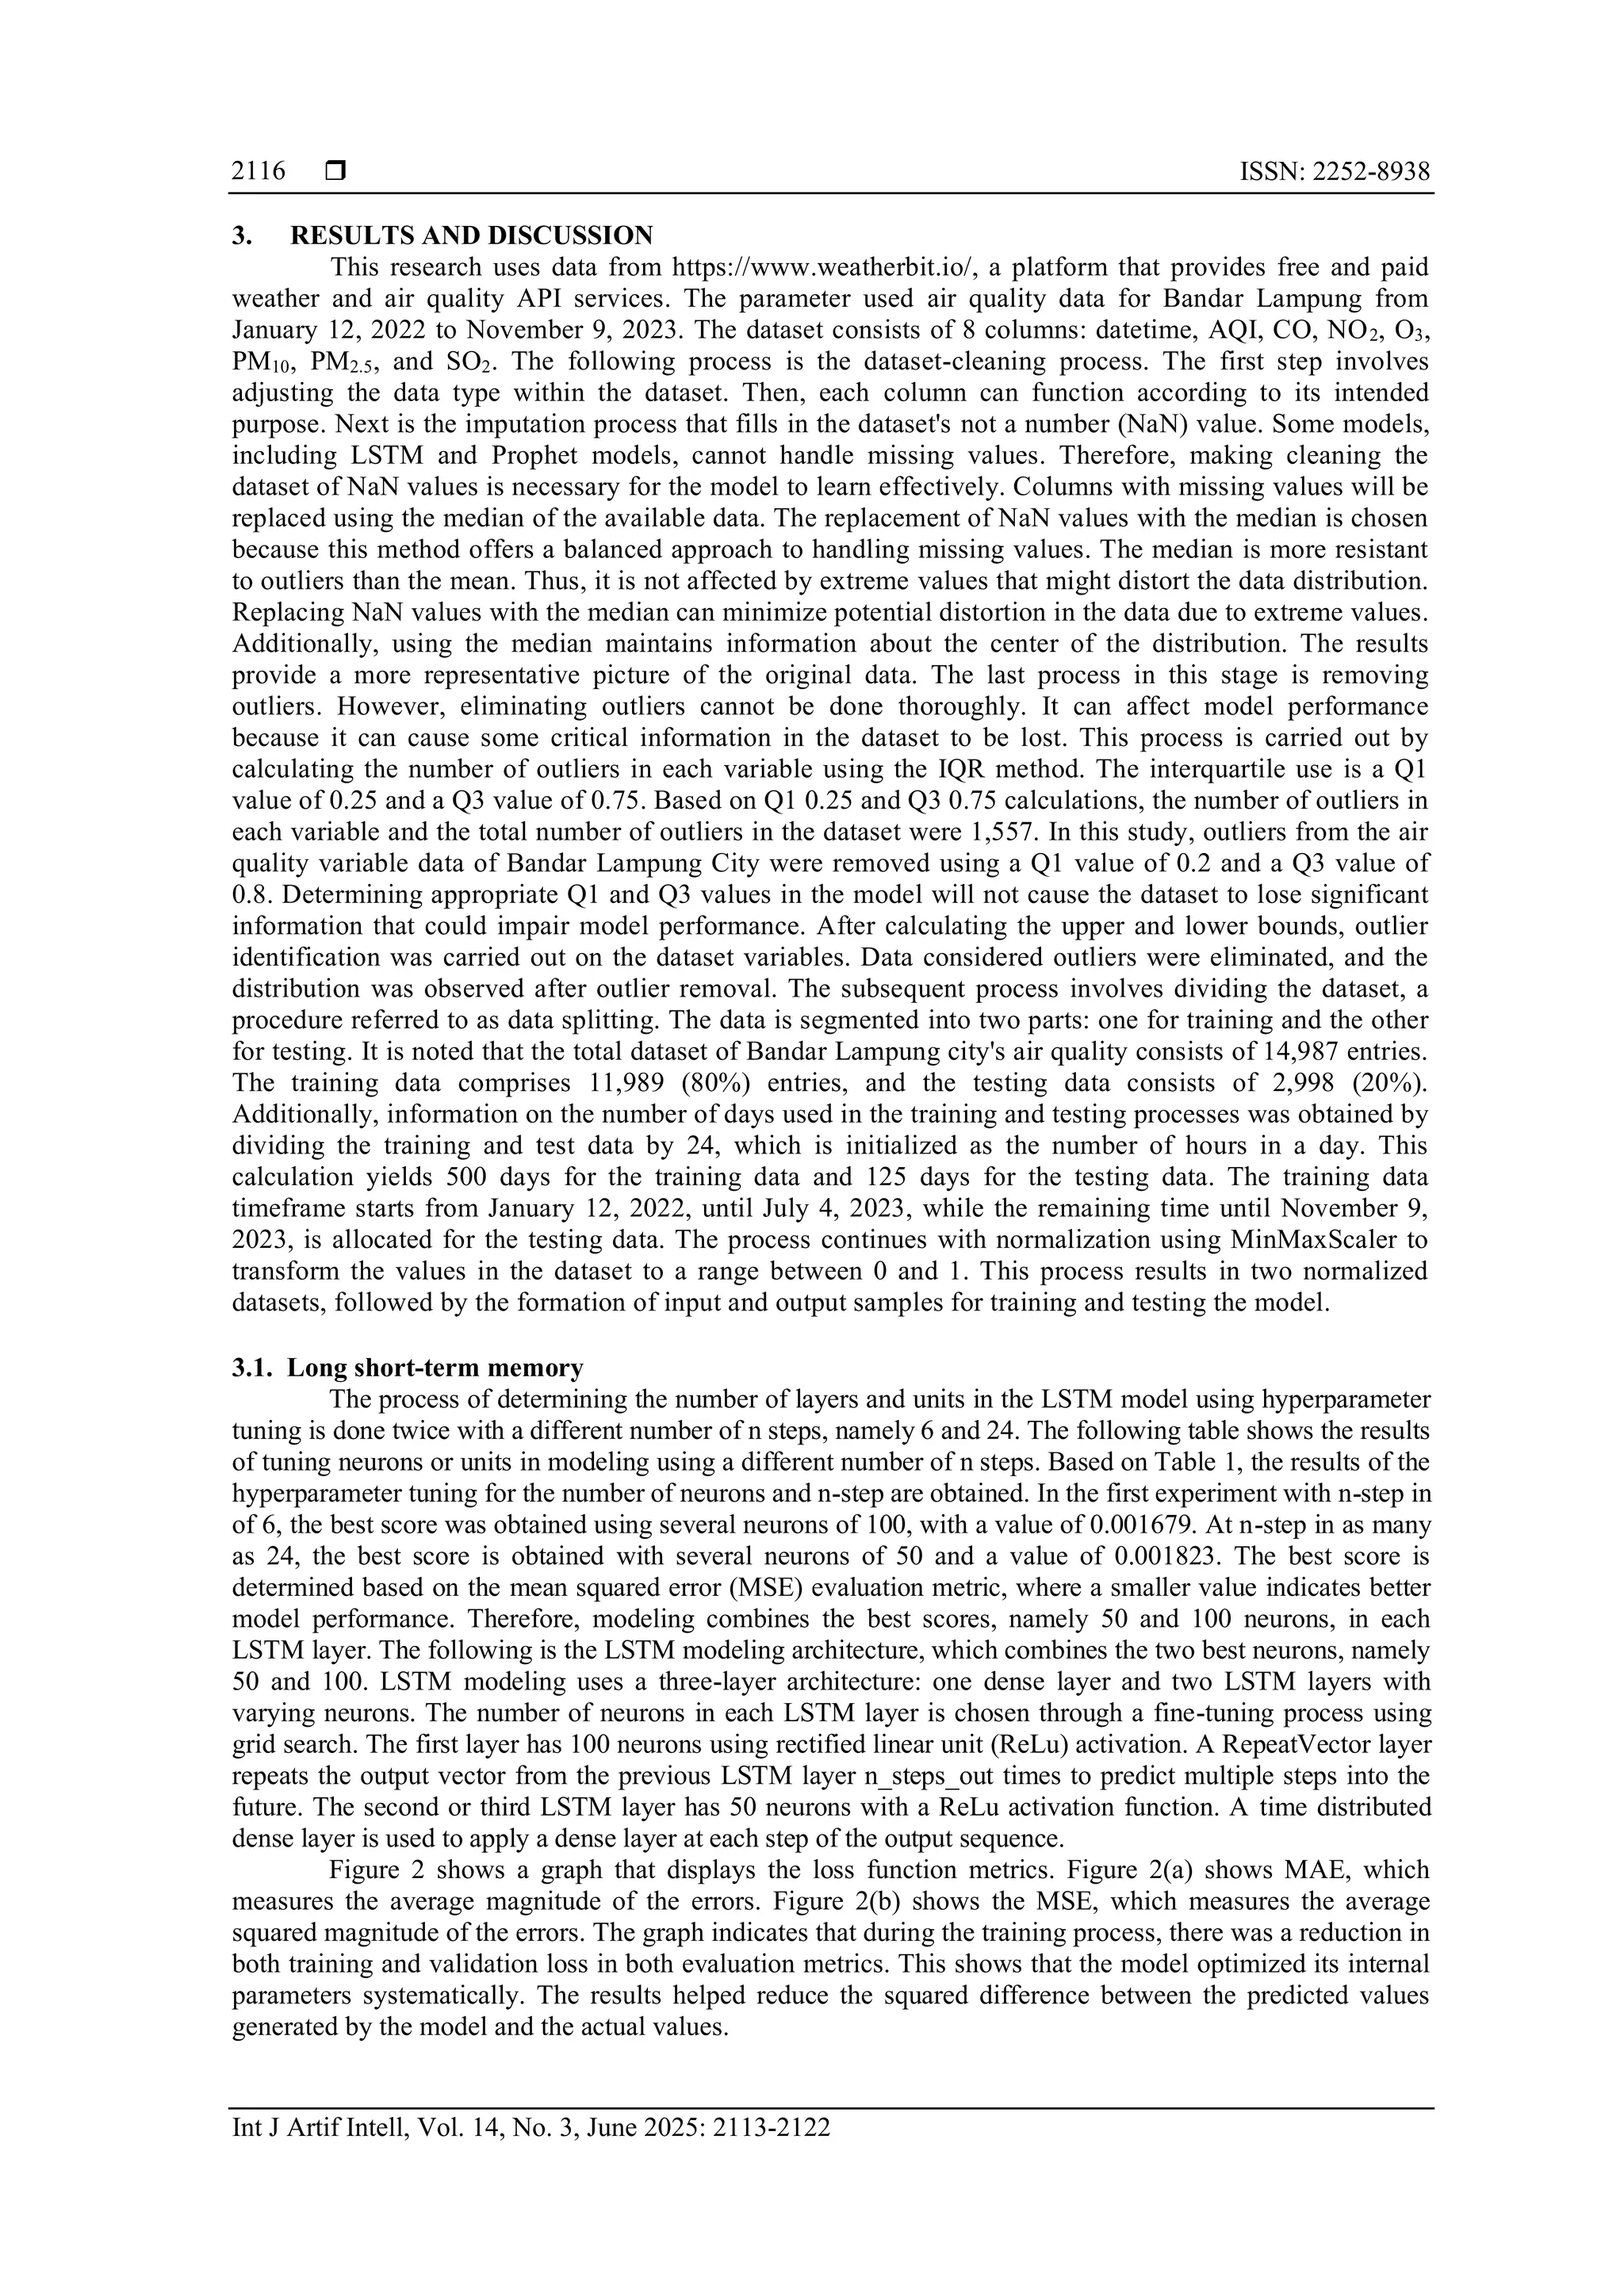
2.2. Method
The data mining process employed in this research adopts the data science framework flow, which
provides a comprehensive and structured approach to building a data science model. As depicted in Figure 1,
the workflow commences with identifying datasets and proceeds through a series of systematic steps to the
evaluation phase. The framework's structured approach ensures that the research outcomes are reliable and
valid.
Figure 1. Research method
In the business understanding stages, the objective goal is determined. Therefore, to fulfill the goal,
dataset identification and collection are carried out according to the objectives. This study uses air quality
data for Bandar Lampung City. The following process is data pre-preprocessing, where the datasets that have
been obtained are collected before entering the data cleaning stage. The data cleaning stage is done by
determining the variables that will be used by deleting unnecessary variables. This process selects the
appropriate data type for each column and fills in the empty data, known as dataset imputation. In addition,
outliers were removed using the interquartile range (IQR) statistical method. This is done so that the dataset
can be appropriately processed at the next stage.
The dataset was then split into training and testing datasets. The training dataset will be used for the
machine learning algorithm training stage. Then, the already-trained model will be tested for the evaluation
process using the testing dataset. The next stage is the modeling stage; modeling is carried out based on data
that has been explored and split in the previous stage. The model design uses a deep learning model, namely
the LSTM and the Prophet methods. The LSTM method is an artificial neural network (ANN) architecture
that can handle long-range dependency problems. LSTM is widely used to model complex relationships and
patterns over time in datasets. Apart from that, the Prophet method is used, which is a method that can be
used for time series data that may have unique properties that are difficult to accommodate by traditional
methods [33]. Both methods use Python with libraries such as TensorFlow for LSTM and Prophet for the
Prophet model. Apart from that, a tuning process was also carried out to obtain model parameters. The best
architecture for LSTM and added regressors, holiday, and seasonal effects for the Prophet model.
The interpretation stage is the final stage aimed at evaluating the results of testing the model that has
been built. Model testing results are graphical visualizations of actual and predicted data. In addition, model
evaluation metrics are used to measure errors in predictions made. The evaluation results are in the form of mean
absolute percentage error (MAPE), mean absolute error (MAE), and root mean squared error (RMSE) values, and
the best error values are obtained so that insights can be obtained that can be used in decision-making.](https://image.slidesharecdn.com/4125561-250826093048-2c4e332a/75/Advancing-precision-in-air-quality-forecasting-through-machine-learning-integration-3-2048.jpg)
![ ISSN: 2252-8938
Int J Artif Intell, Vol. 14, No. 3, June 2025: 2113-2122
2120
AUTHOR CONTRIBUTIONS STATEMENT
This journal uses the Contributor Roles Taxonomy (CRediT) to recognize individual author
contributions, reduce authorship disputes, and facilitate collaboration.
Name of Author C M So Va Fo I R D O E Vi Su P Fu
Muhamad Komarudin ✓ ✓ ✓ ✓ ✓ ✓ ✓ ✓ ✓ ✓
Sri Ratna Sulistiyanti ✓ ✓ ✓ ✓ ✓
Suharso ✓ ✓ ✓
Muhammad Irsyad ✓ ✓ ✓ ✓
Hery Dian Septama ✓ ✓ ✓ ✓ ✓ ✓
Titin Yulianti ✓ ✓ ✓ ✓ ✓
Ali Sophian ✓ ✓ ✓ ✓
Michel ✓ ✓ ✓ ✓ ✓
C : Conceptualization
M : Methodology
So : Software
Va : Validation
Fo : Formal analysis
I : Investigation
R : Resources
D : Data Curation
O : Writing - Original Draft
E : Writing - Review & Editing
Vi : Visualization
Su : Supervision
P : Project administration
Fu : Funding acquisition
CONFLICT OF INTEREST STATEMENT
Authors state no conflict of interest.
DATA AVAILABILITY
The data that support the findings of this study are available from https://www.weatherbit.io/.
Restrictions apply to the availability of these data, which were used under license for this study. Data are
available from the corresponding author with the permission of weatherbit.io.
REFERENCES
[1] E. G. Prihardanu, H. Kusnoputranto, and H. Herdiansyah, “Indoor air quality in urban residential: Current status, regulation and
future research for Indonesia,” International Journal of Public Health Science, vol. 10, no. 4, pp. 824–833, 2021, doi:
10.11591/ijphs.v10i4.20885.
[2] A. E. Önal, Air quality and health. London, United Kingdom: IntechOpen, 2022, doi: 10.5772/intechopen.98023.
[3] C. Mănescu, T. Mateoc-Sîrb, H. Vass, and N. Mateoc-Sîrb, “Studies on the effects of air pollution on human health,”
International Multidisciplinary Scientific GeoConference Surveying Geology and Mining Ecology Management, vol. 22, no. 5.1,
pp. 415–422, 2022, doi: 10.5593/sgem2022/5.1/s20.053.
[4] J. A. Douglass, “How can air quality affect health?,” Internal Medicine Journal, vol. 50, no. 11, 2020, doi: 10.1111/imj.15050.
[5] H. Chen et al., “Effects of air pollution on human health – Mechanistic evidence suggested by in vitro and in vivo modelling,”
Environmental Research, vol. 212, 2022, doi: 10.1016/j.envres.2022.113378.
[6] A. Piracha and M. T. Chaudhary, “Urban air pollution, urban heat island and human health: a review of the literature,”
Sustainability, vol. 14, no. 15, 2022, doi: 10.3390/su14159234.
[7] D. Schwela, “Air pollution and health in urban areas,” Reviews on Environmental Health, vol. 15, no. 1–2, pp. 13–42, 2000, doi:
10.1515/REVEH.2000.15.1-2.13.
[8] A. K. Srivastava, “Air pollution: facts, causes, and impacts,” in Asian Atmospheric Pollution, Elsevier, 2022, pp. 39–54, doi:
10.1016/B978-0-12-816693-2.00020-2.
[9] R. Pitarma, G. Marques, and B. R. Ferreira, “Monitoring indoor air quality for enhanced occupational health,” Journal of Medical
Systems, vol. 41, no. 2, 2017, doi: 10.1007/s10916-016-0667-2.
[10] V. Manasa et al., “Indoor air quality analysis and sustainable practices,” E3S Web of Conferences, vol. 507, Mar. 2024, doi:
10.1051/e3sconf/202450701004.
[11] V. V. Tran, D. Park, and Y. C. Lee, “Indoor air pollution, related human diseases, and recent trends in the control and improvement of indoor
air quality,” International Journal of Environmental Research and Public Health, vol. 17, no. 8, 2020, doi: 10.3390/ijerph17082927.
[12] D. Niepsch, L. J. Clarke, J. Newton, K. Tzoulas, and G. Cavan, “High spatial resolution assessment of air quality in urban centres
using lichen carbon, nitrogen and sulfur contents and stable-isotope-ratio signatures,” Environmental Science and Pollution
Research, vol. 30, no. 20, pp. 58731–58754, 2023, doi: 10.1007/s11356-023-26652-8.
[13] R. Schrödner, H. Alas, and J. Voigtländer, “Application of cost-efficient particulate matter measurement devices in an urban network
and comparison to state-of-the-art air quality monitoring,” in EGU General Assembly 2023, 2023, doi: 10.5194/egusphere-egu23-9356.
[14] J. Swolkień, M. Tomaszek, and W. Halecki, “Urban network of air quality measurement nodes,” Geomatics, Landmanagement
and Landscape, vol. 1, pp. 23–39, 2021, doi: 10.15576/gll/2021.1.23.
[15] M. Komarudin, H. D. Septama, T. Yulianti, A. Yudamson, M. Pratama, and T. P. Zuhelmi, “Air quality monitoring device for
smart health solution during covid-19 pandemic,” in 2021 International Conference on Converging Technology in Electrical and
Information Engineering (ICCTEIE), 2021, pp. 78–81, doi: 10.1109/ICCTEIE54047.2021.9650638.
[16] M. Komarudin, S. R. Sulistyanti, Suharso, M. Irsyad, H. D. Septama, and T. Yulianti, “Improving low-cost carbon dioxide sensor
accuracy for environmental air quality monitoring systems,” in 2023 International Conference on Converging Technology in
Electrical and Information Engineering (ICCTEIE), 2023, pp. 1–5, doi: 10.1109/ICCTEIE60099.2023.10366775.](https://image.slidesharecdn.com/4125561-250826093048-2c4e332a/75/Advancing-precision-in-air-quality-forecasting-through-machine-learning-integration-8-2048.jpg)
![Int J Artif Intell ISSN: 2252-8938
Advancing precision in air quality forecasting through machine learning… (Muhamad Komarudin)
2121
[17] N. N. Mafop, A. Z. Abidin, and H. Mohamad, “IoT-based monitoring system for indoor air quality using thingsboard,” in 2024 IEEE
International Conference on Applied Electronics and Engineering (ICAEE), 2024, pp. 1–6, doi: 10.1109/ICAEE62924.2024.10667562.
[18] P. Diviacco et al., “Monitoring air quality in urban areas using a vehicle sensor network (VSN) crowdsensing paradigm,” Remote
Sensing, vol. 14, no. 21, 2022, doi: 10.3390/rs14215576.
[19] J. P. Sá et al., “Selection and evaluation of commercial low-cost devices for indoor air quality monitoring in schools,” Journal of
Building Engineering, vol. 98, 2024, doi: 10.1016/j.jobe.2024.110952.
[20] J. K. B. Rogers, T. C. R. Mercado, and F. A. Galleto, “Comparison of ARIMA boost, Prophet boost, and TSLM models in
forecasting Davao City weather data,” Indonesian Journal of Electrical Engineering and Computer Science, vol. 34, no. 2, pp.
1092–1101, 2024, doi: 10.11591/ijeecs.v34.i2.pp1092-1101.
[21] N. A. Suwadi et al., “An optimized approach for predicting water quality features based on machine learning,” Wireless
Communications and Mobile Computing, vol. 2022, pp. 1–20, 2022, doi: 10.1155/2022/3397972.
[22] J. K. Deters, R. Zalakeviciute, M. Gonzalez, and Y. Rybarczyk, “Modeling PM 2.5 urban pollution using machine learning and selected
meteorological parameters,” Journal of Electrical and Computer Engineering, vol. 2017, pp. 1–14, 2017, doi: 10.1155/2017/5106045.
[23] X. Xi et al., “A comprehensive evaluation of air pollution prediction improvement by a machine learning method,” in 2015 IEEE
International Conference on Service Operations And Logistics, And Informatics, 2015, pp. 176–181, doi: 10.1109/SOLI.2015.7367615.
[24] P. H. Nguyen, N. K. Dao, and L. S. P. Nguyen, “Development of machine learning and deep learning prediction models for
PM2.5 in Ho Chi Minh City, Vietnam,” Atmosphere, vol. 15, no. 10, 2024, doi: 10.3390/atmos15101163.
[25] S. Mahajan, H. M. Liu, T. C. Tsai, and L. J. Chen, “Improving the accuracy and efficiency of PM2.5 forecast service using
cluster-based hybrid neural network model,” IEEE Access, vol. 6, pp. 19193–19204, 2018, doi: 10.1109/ACCESS.2018.2820164.
[26] X. Wang and B. Wang, “Research on prediction of environmental aerosol and PM2.5 based on artificial neural network,” Neural
Computing and Applications, vol. 31, no. 12, pp. 8217–8227, 2019, doi: 10.1007/s00521-018-3861-y.
[27] R. Li, Y. Dong, Z. Zhu, C. Li, and H. Yang, “A dynamic evaluation framework for ambient air pollution monitoring,” Applied
Mathematical Modelling, vol. 65, pp. 52–71, 2019, doi: 10.1016/j.apm.2018.07.052.
[28] M. Benhaddi and J. Ouarzazi, “Multivariate time series forecasting with dilated residual convolutional neural networks for urban air
quality prediction,” Arabian Journal for Science and Engineering, vol. 46, no. 4, pp. 3423–3442, 2021, doi: 10.1007/s13369-020-05109-x.
[29] H. Maleki, A. Sorooshian, G. Goudarzi, Z. Baboli, Y. Tahmasebi Birgani, and M. Rahmati, “Air pollution prediction by using an artificial
neural network model,” Clean Technologies and Environmental Policy, vol. 21, no. 6, 2019, doi: 10.1007/s10098-019-01709-w.
[30] M. R. Delavar et al., “A novel method for improving air pollution prediction based on machine learning approaches: A case study
applied to the capital city of Tehran,” ISPRS International Journal of Geo-Information, vol. 8, no. 2, 2019, doi: 10.3390/ijgi8020099.
[31] S. Hochreiter and J. Schmidhuber, “Long short-term memory,” Neural Computation, vol. 9, no. 8, 1997, doi: 10.1162/neco.1997.9.8.1735.
[32] S. J. Taylor and B. Letham, “Forecasting at scale,” American Statistician, vol. 72, no. 1, 2018, doi: 10.1080/00031305.2017.1380080.
[33] J. Shen, D. Valagolam, and S. McCalla, “Prophet forecasting model: A machine learning approach to predict the concentration of
air pollutants (PM2.5, PM10, O3, NO2, SO2, CO) in Seoul, South Korea,” PeerJ, vol. 8, 2020, doi: 10.7717/peerj.9961.
BIOGRAPHIES OF AUTHORS
Muhamad Komarudin received his B.Eng. from Universitas Gadjah Mada and
M.Eng. from Institut Teknologi Bandung, Indonesia, in 1993 and 1997, respectively. He is
currently a lecturer at the Department of Electrical and Informatics Engineering at the University
of Lampung. He has also been a doctoral student at the Environmental Science Graduate School,
University of Lampung, since January 2021. His research includes cyber-physical systems,
machine learning, data mining, and IT governance. He can be contacted at email:
m.komarudin@eng.unila.ac.id.
Sri Ratna Sulistiyanti received Dr. degree in electrical engineering from Gadjah
Mada University, Yogyakarta, Indonesia, with the dissertation “Spectral aspects of infrared fires
for obtain information on the thermal conditions of objects with consumer digital camera.” She
has been an Associate Professor of electrical engineering at Universitas Lampung since 1995. Her
research interests include data acquisition, instrumentation, control, and artificial intelligence. She
has also chaired several international conferences in collaboration with IEEE. She can be
contacted at email: sr_sulistiyanti@eng.unila.ac.id.
Suharso holds a Ph.D. from Curtin University of Technology Perth, Australia, in
2003. He is currently a professor in the Department of Chemistry at the University of Lampung,
Indonesia. His research areas of interest include inorganic chemistry, mechanism of crystal
growth, and green scaling inhibitors. He writes more than 60 Scopus-indexed articles with an H-
index of 15. He can be contacted at email: suharso@fmipa.unila.ac.id.](https://image.slidesharecdn.com/4125561-250826093048-2c4e332a/75/Advancing-precision-in-air-quality-forecasting-through-machine-learning-integration-9-2048.jpg)


![Coded Agents – with UiPath SDK + LangGraph [Virtual Hands-on Workshop]](https://cdn.slidesharecdn.com/ss_thumbnails/codedagentsdeck-251215155422-5497c599-thumbnail.jpg?width=640&height=640&fit=bounds)


