Download to read offline


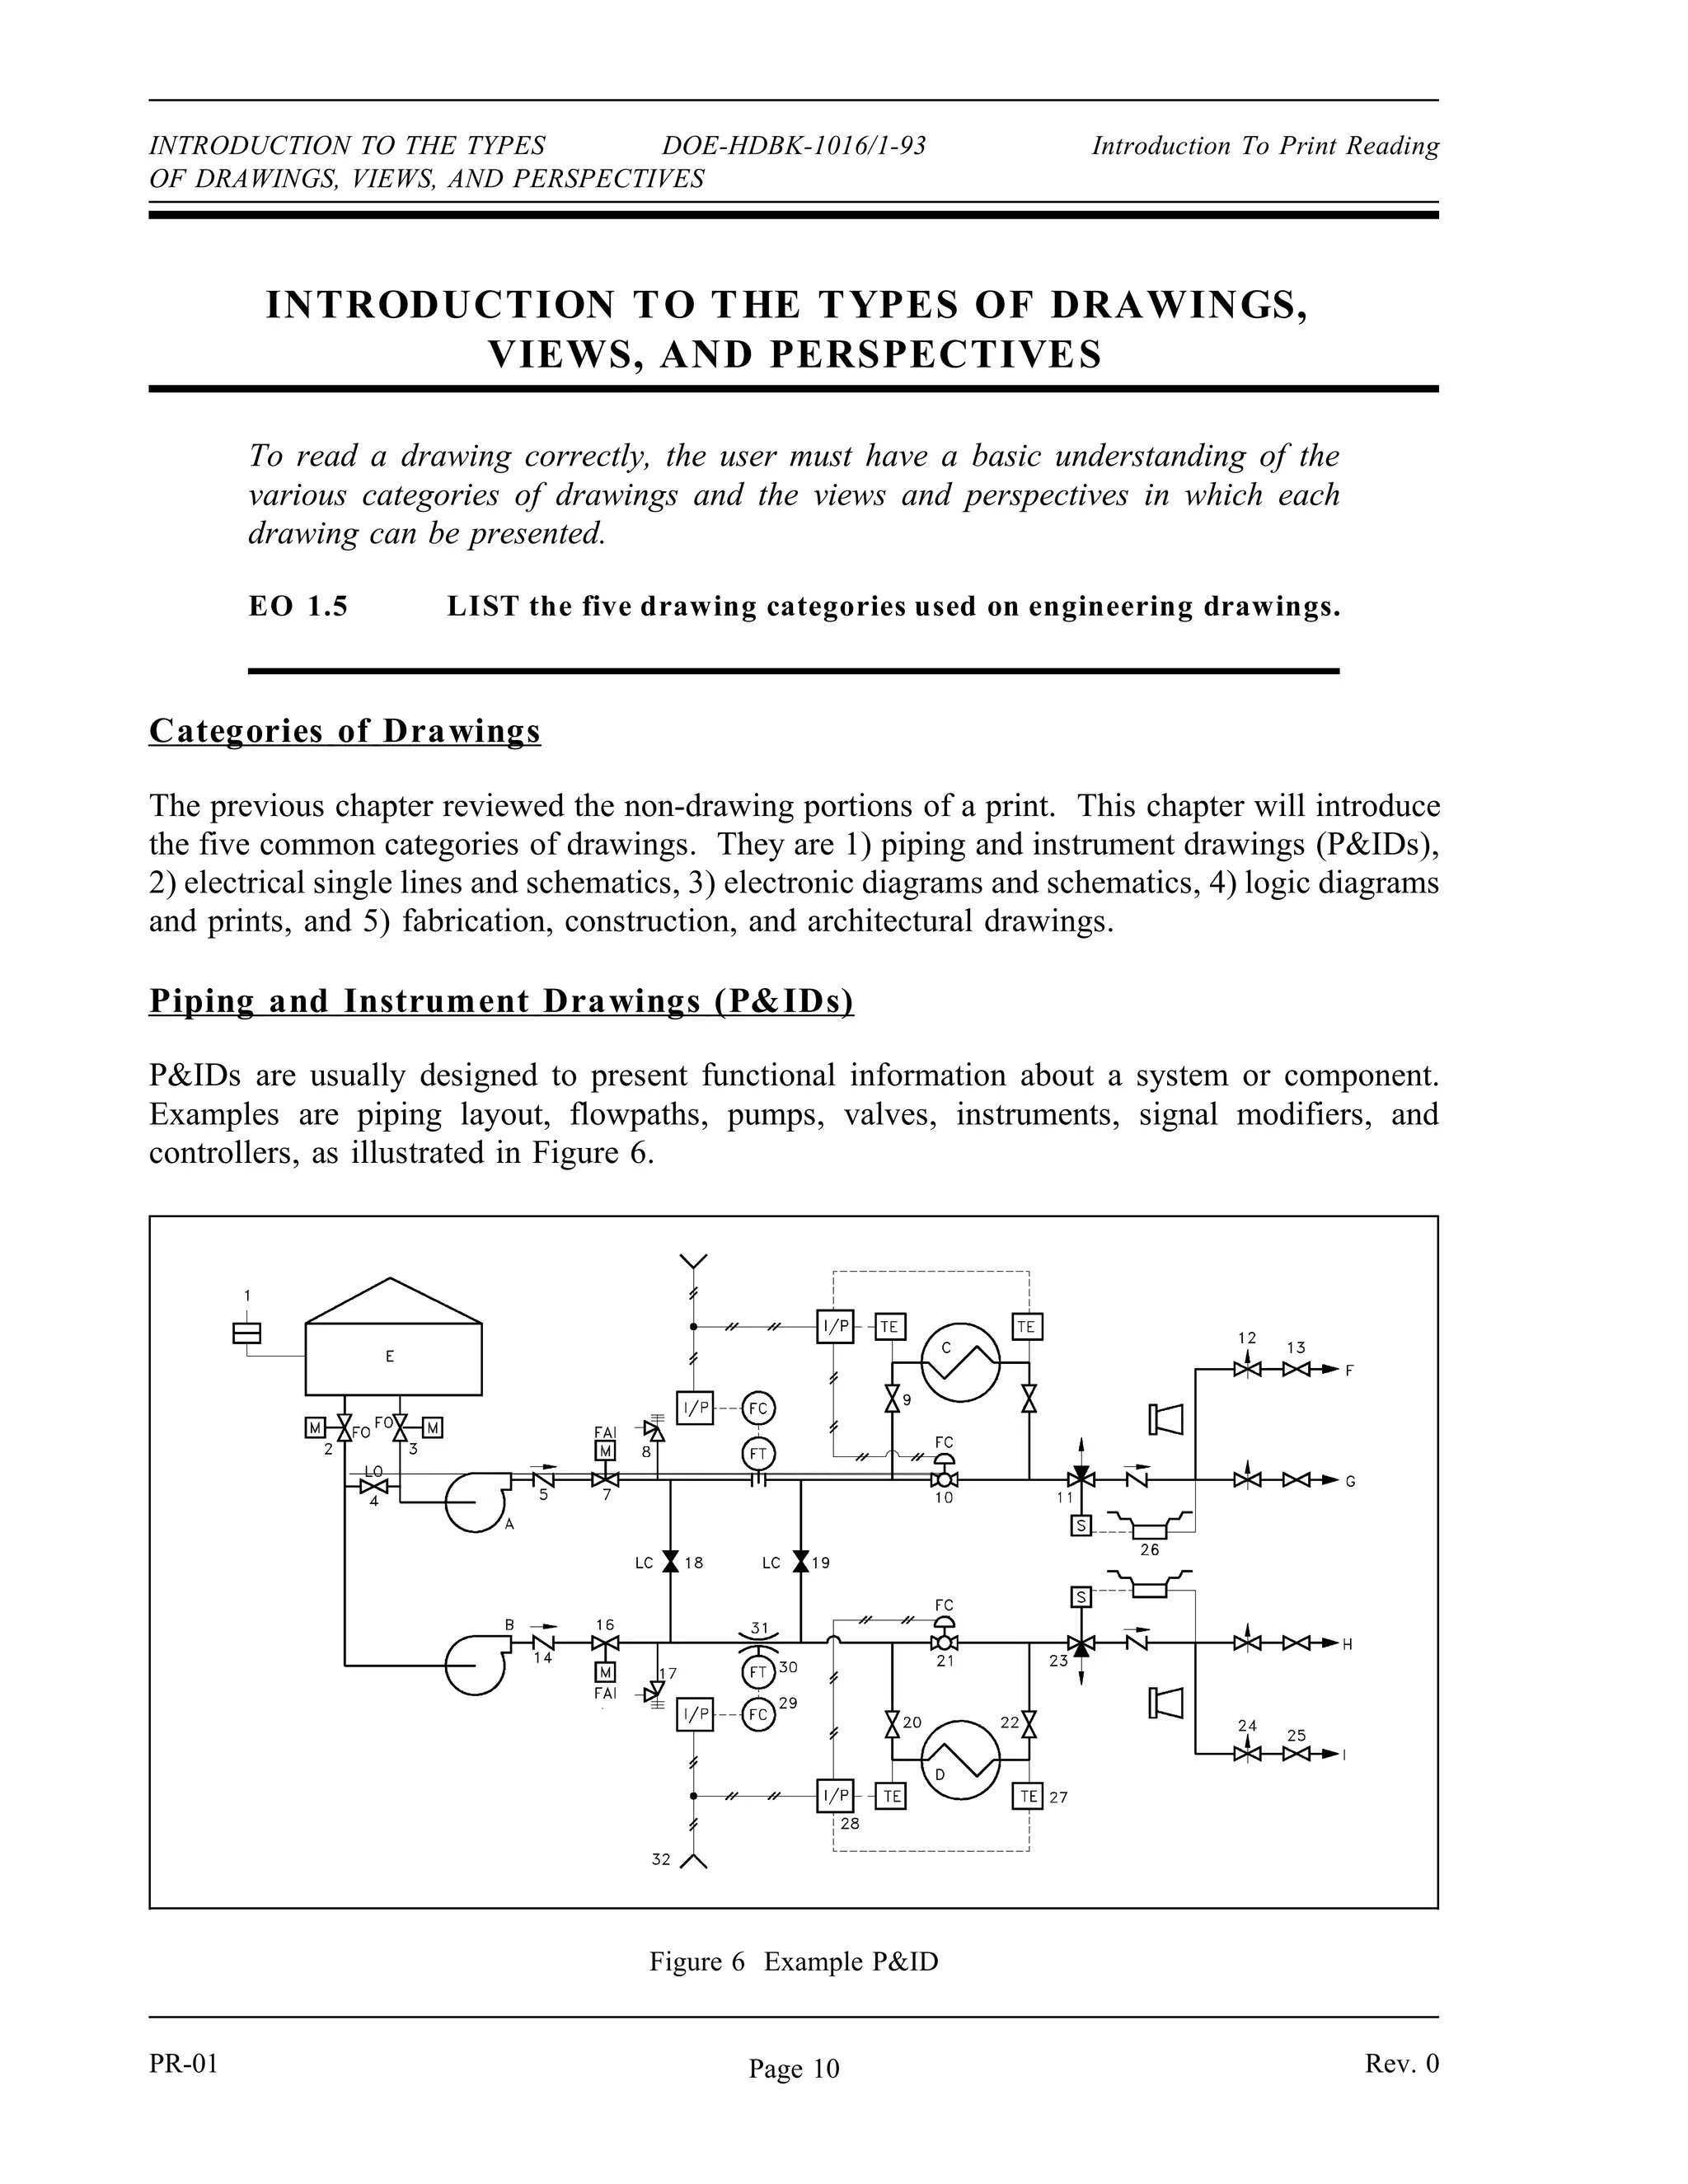


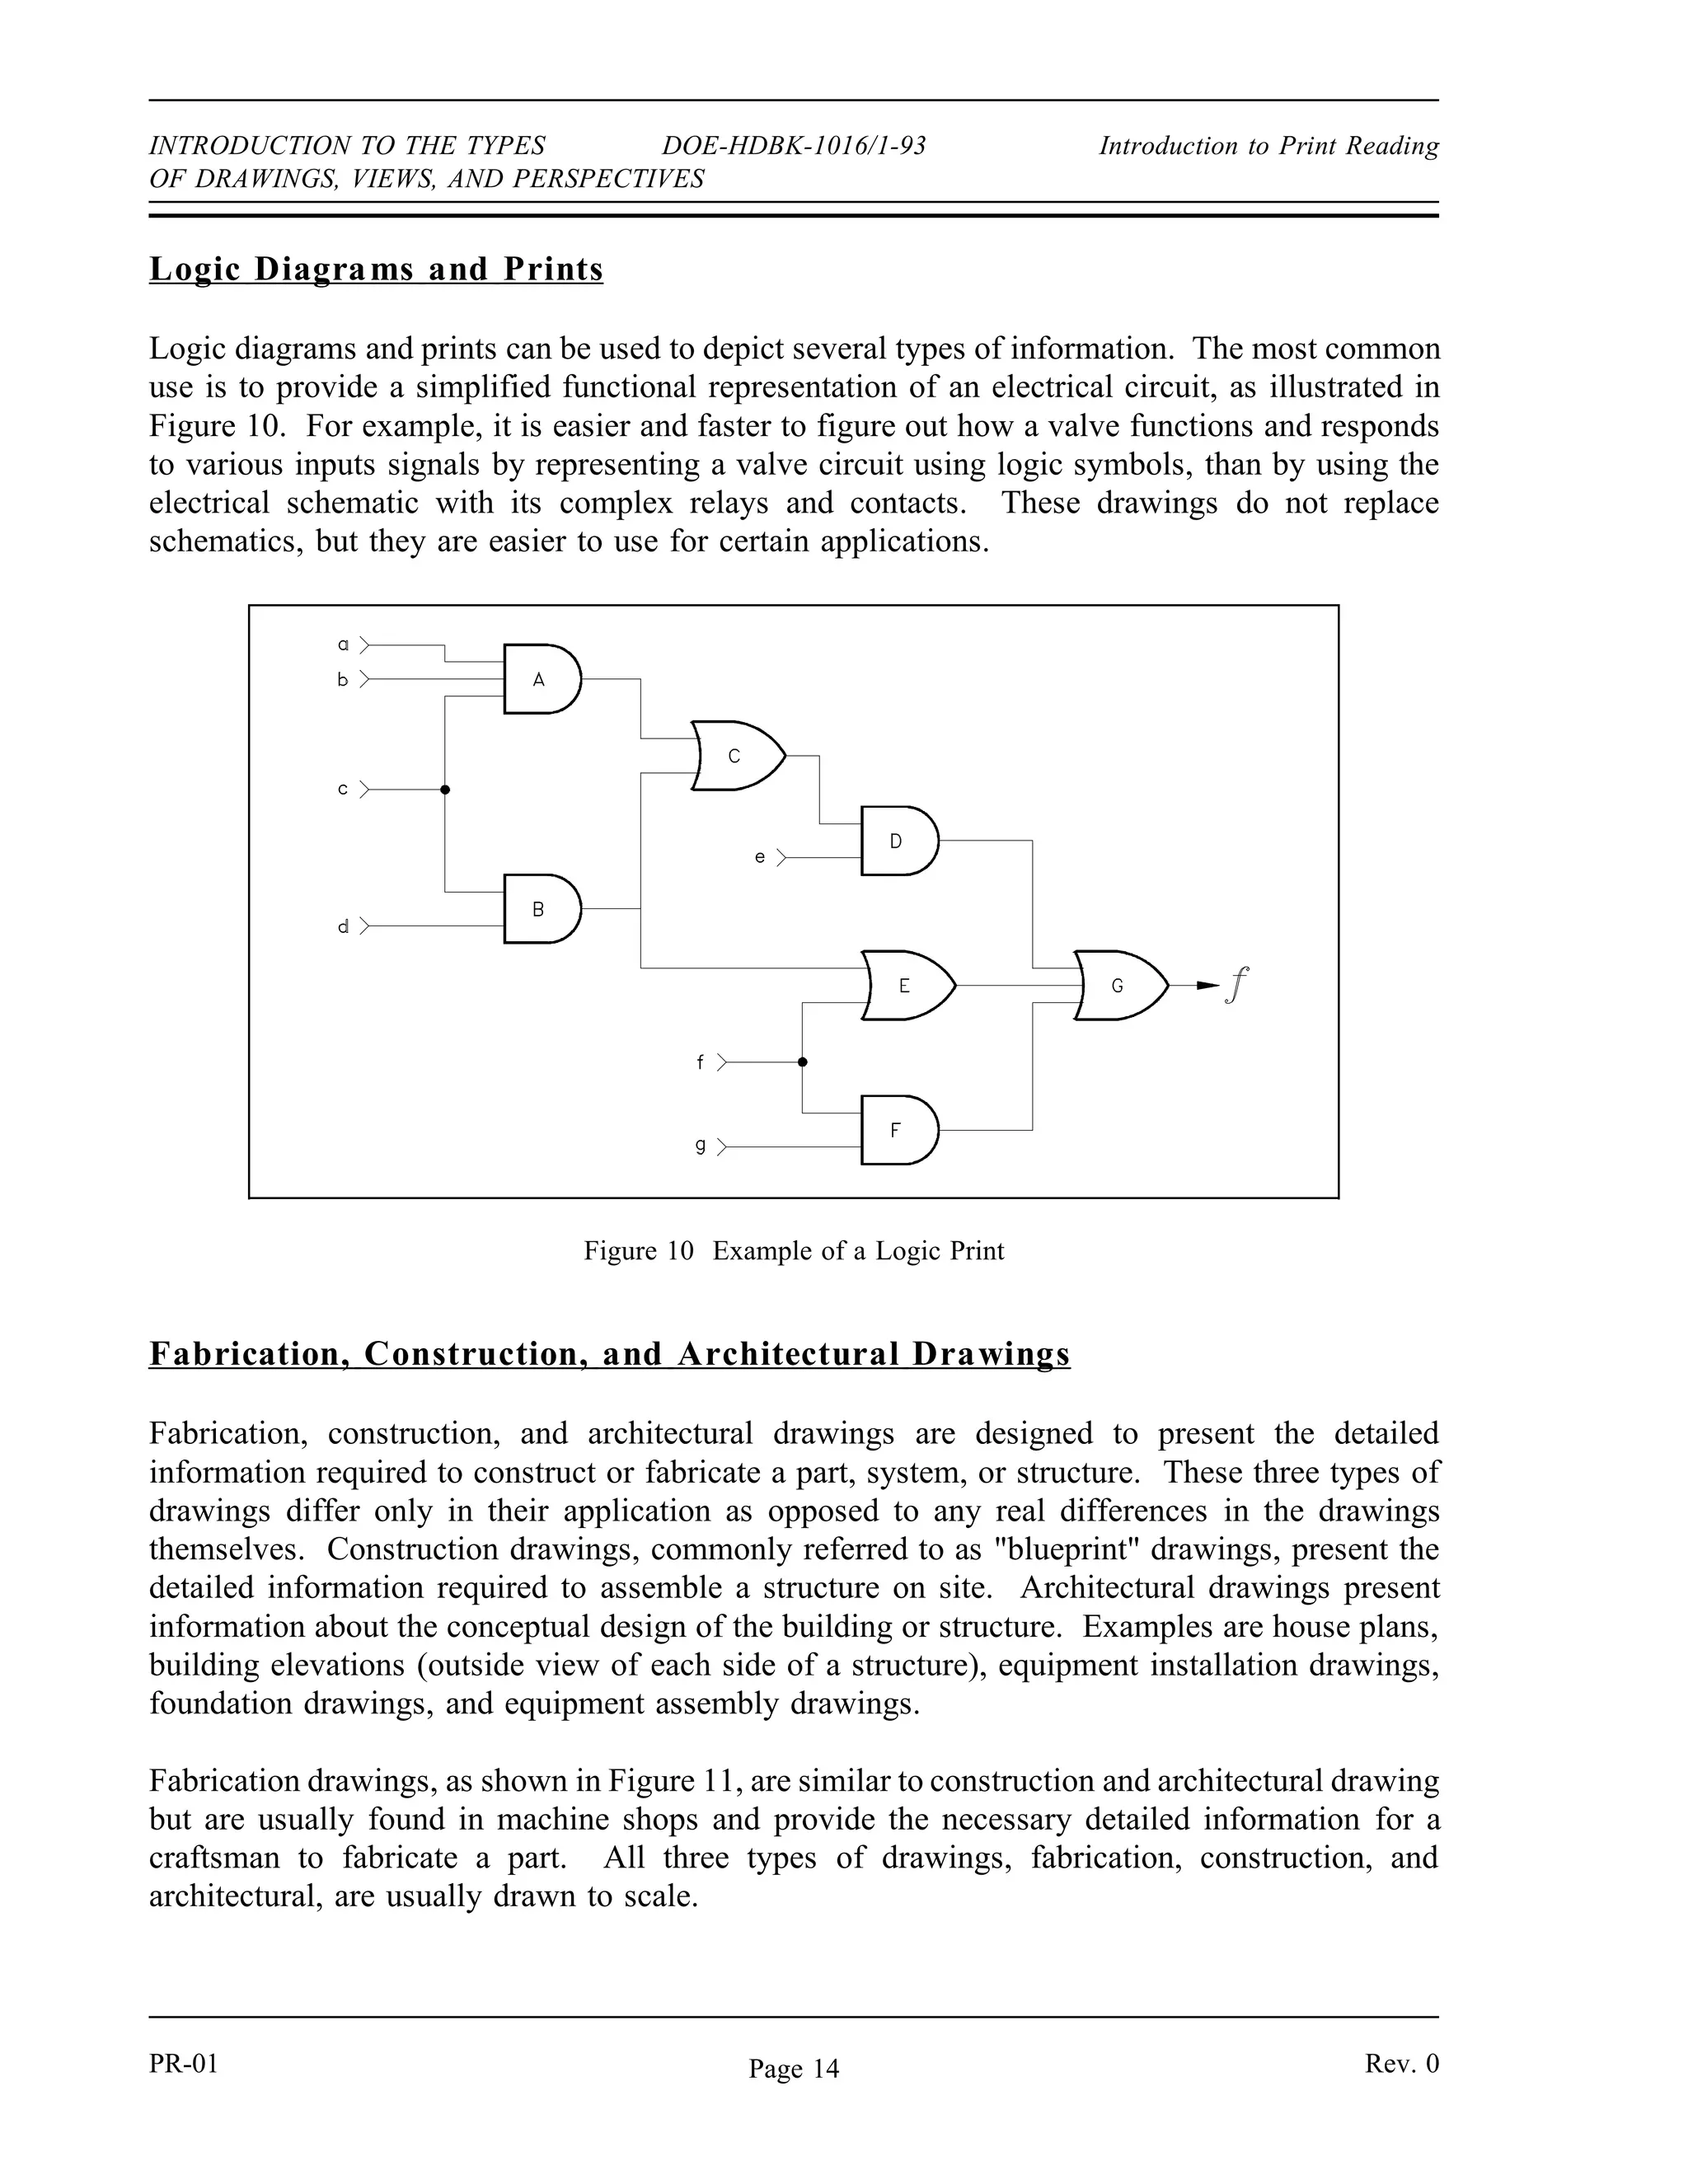
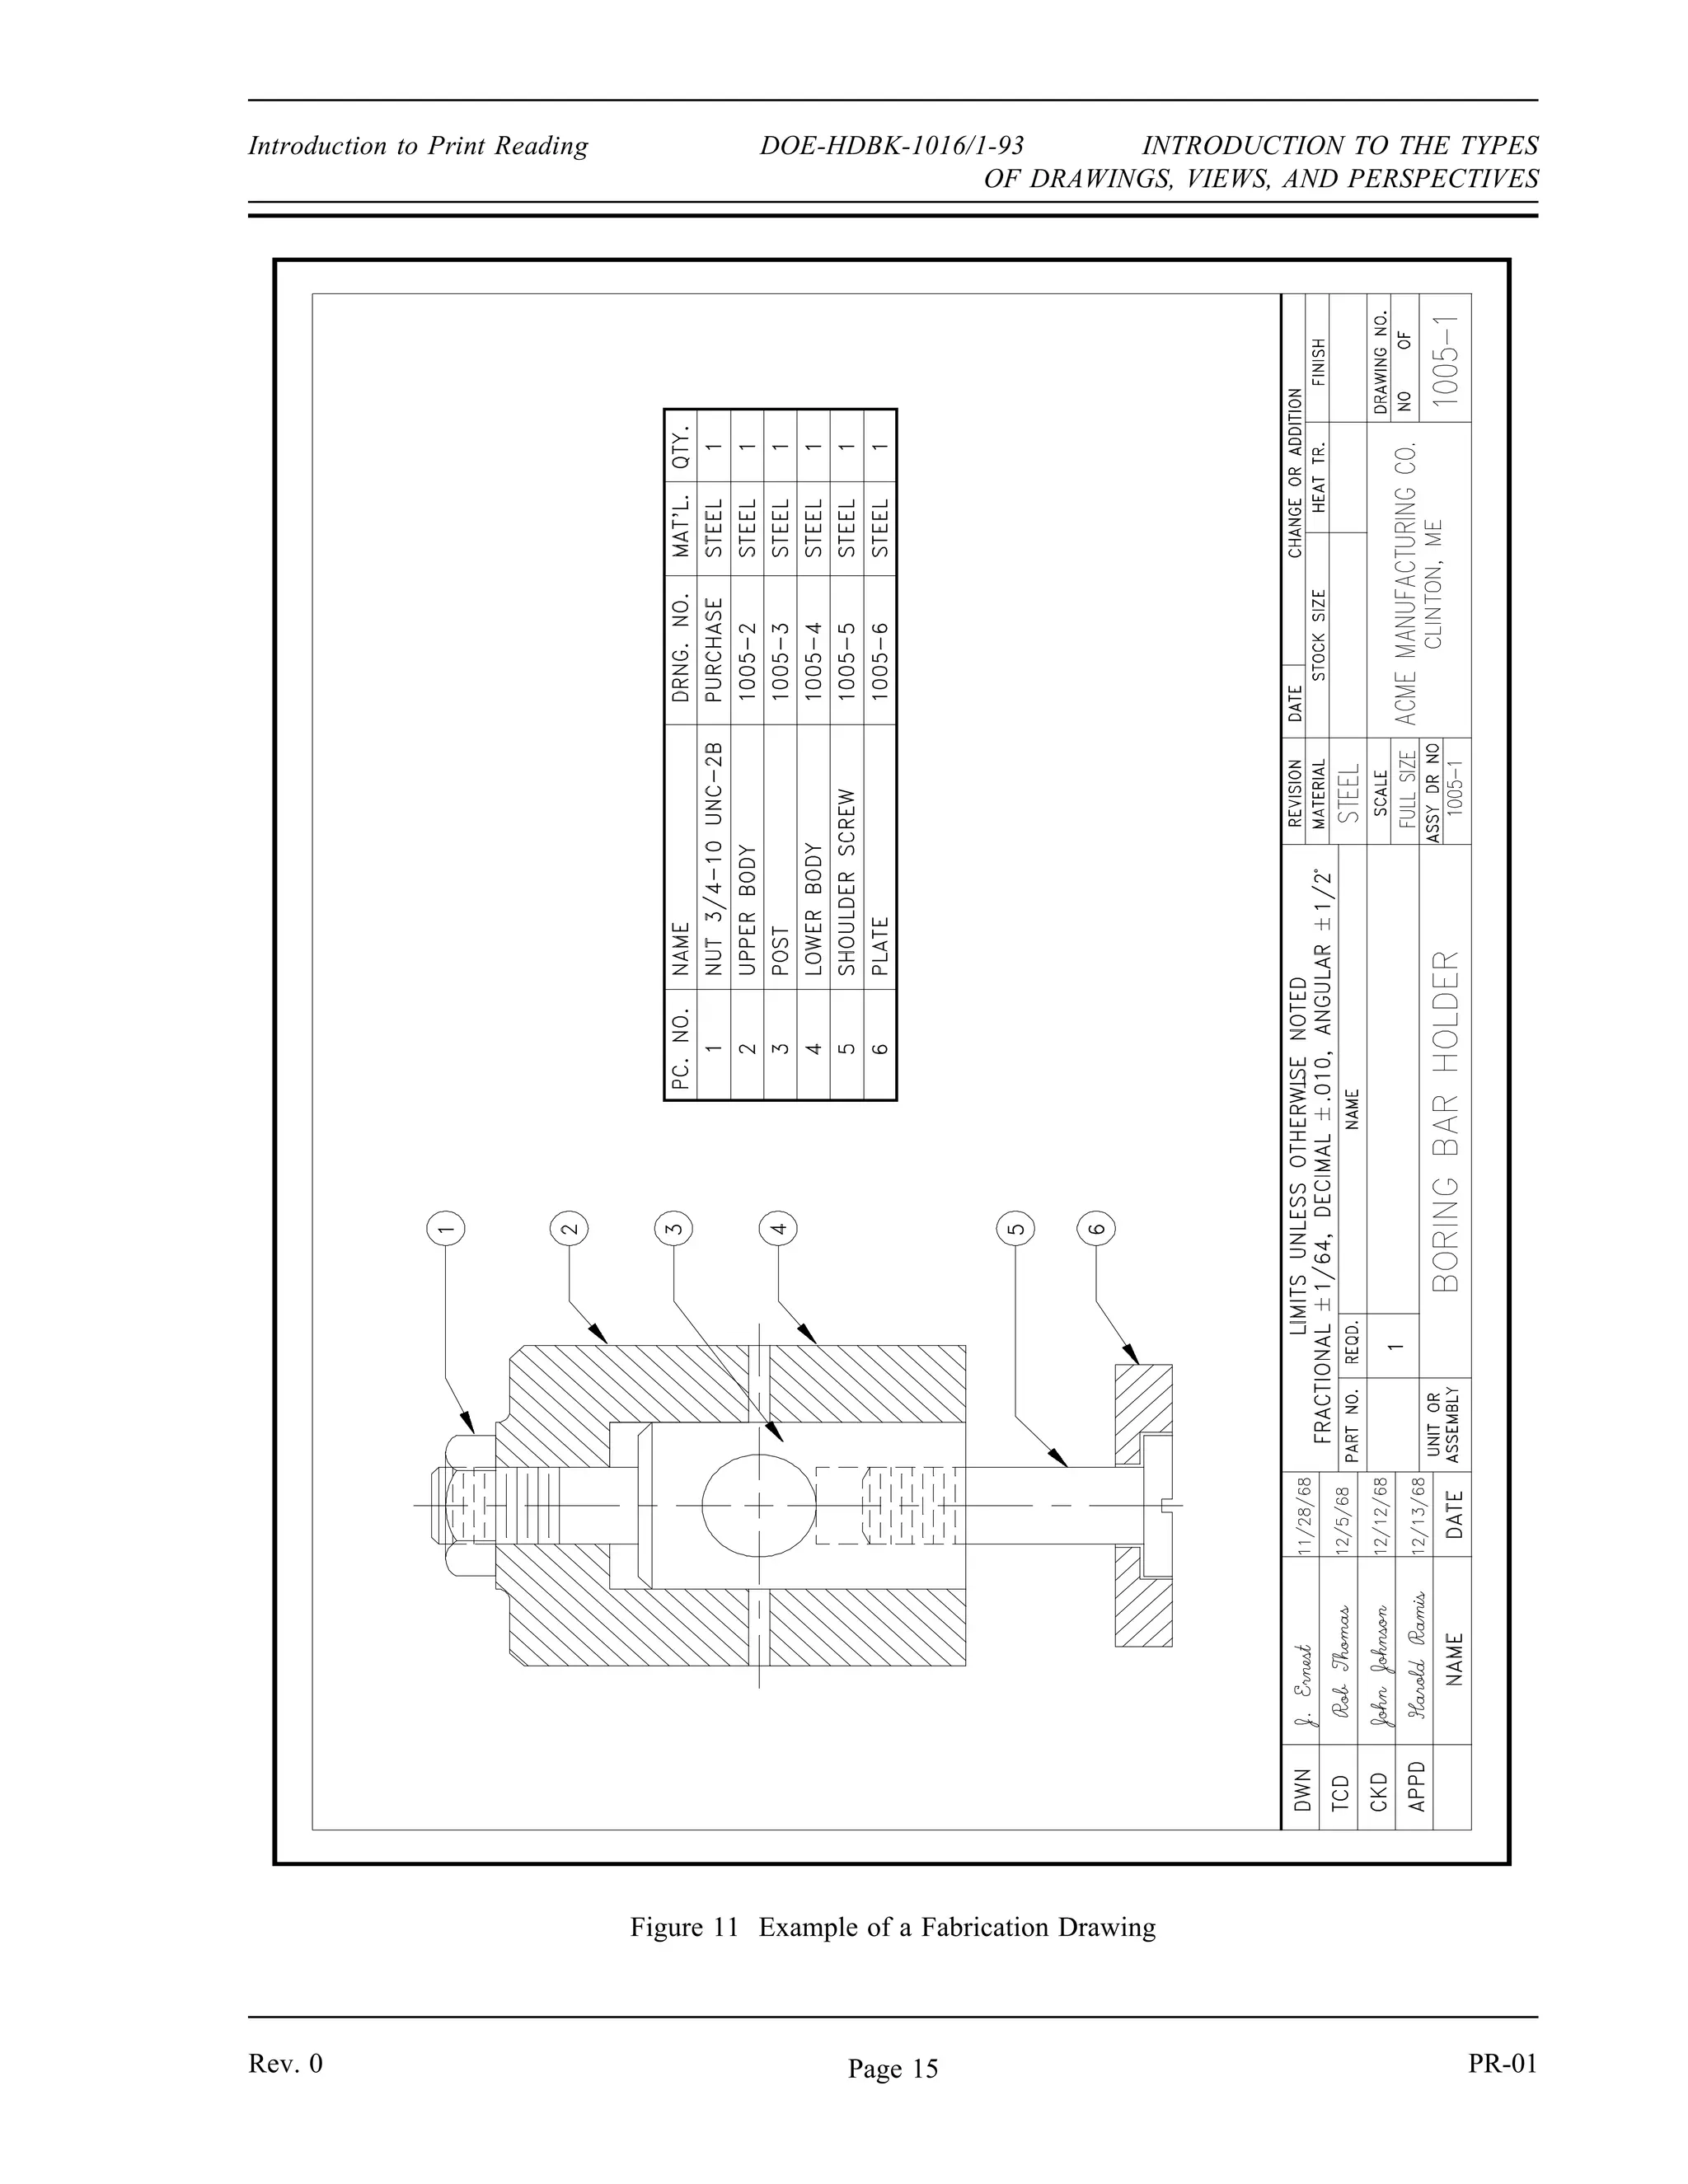
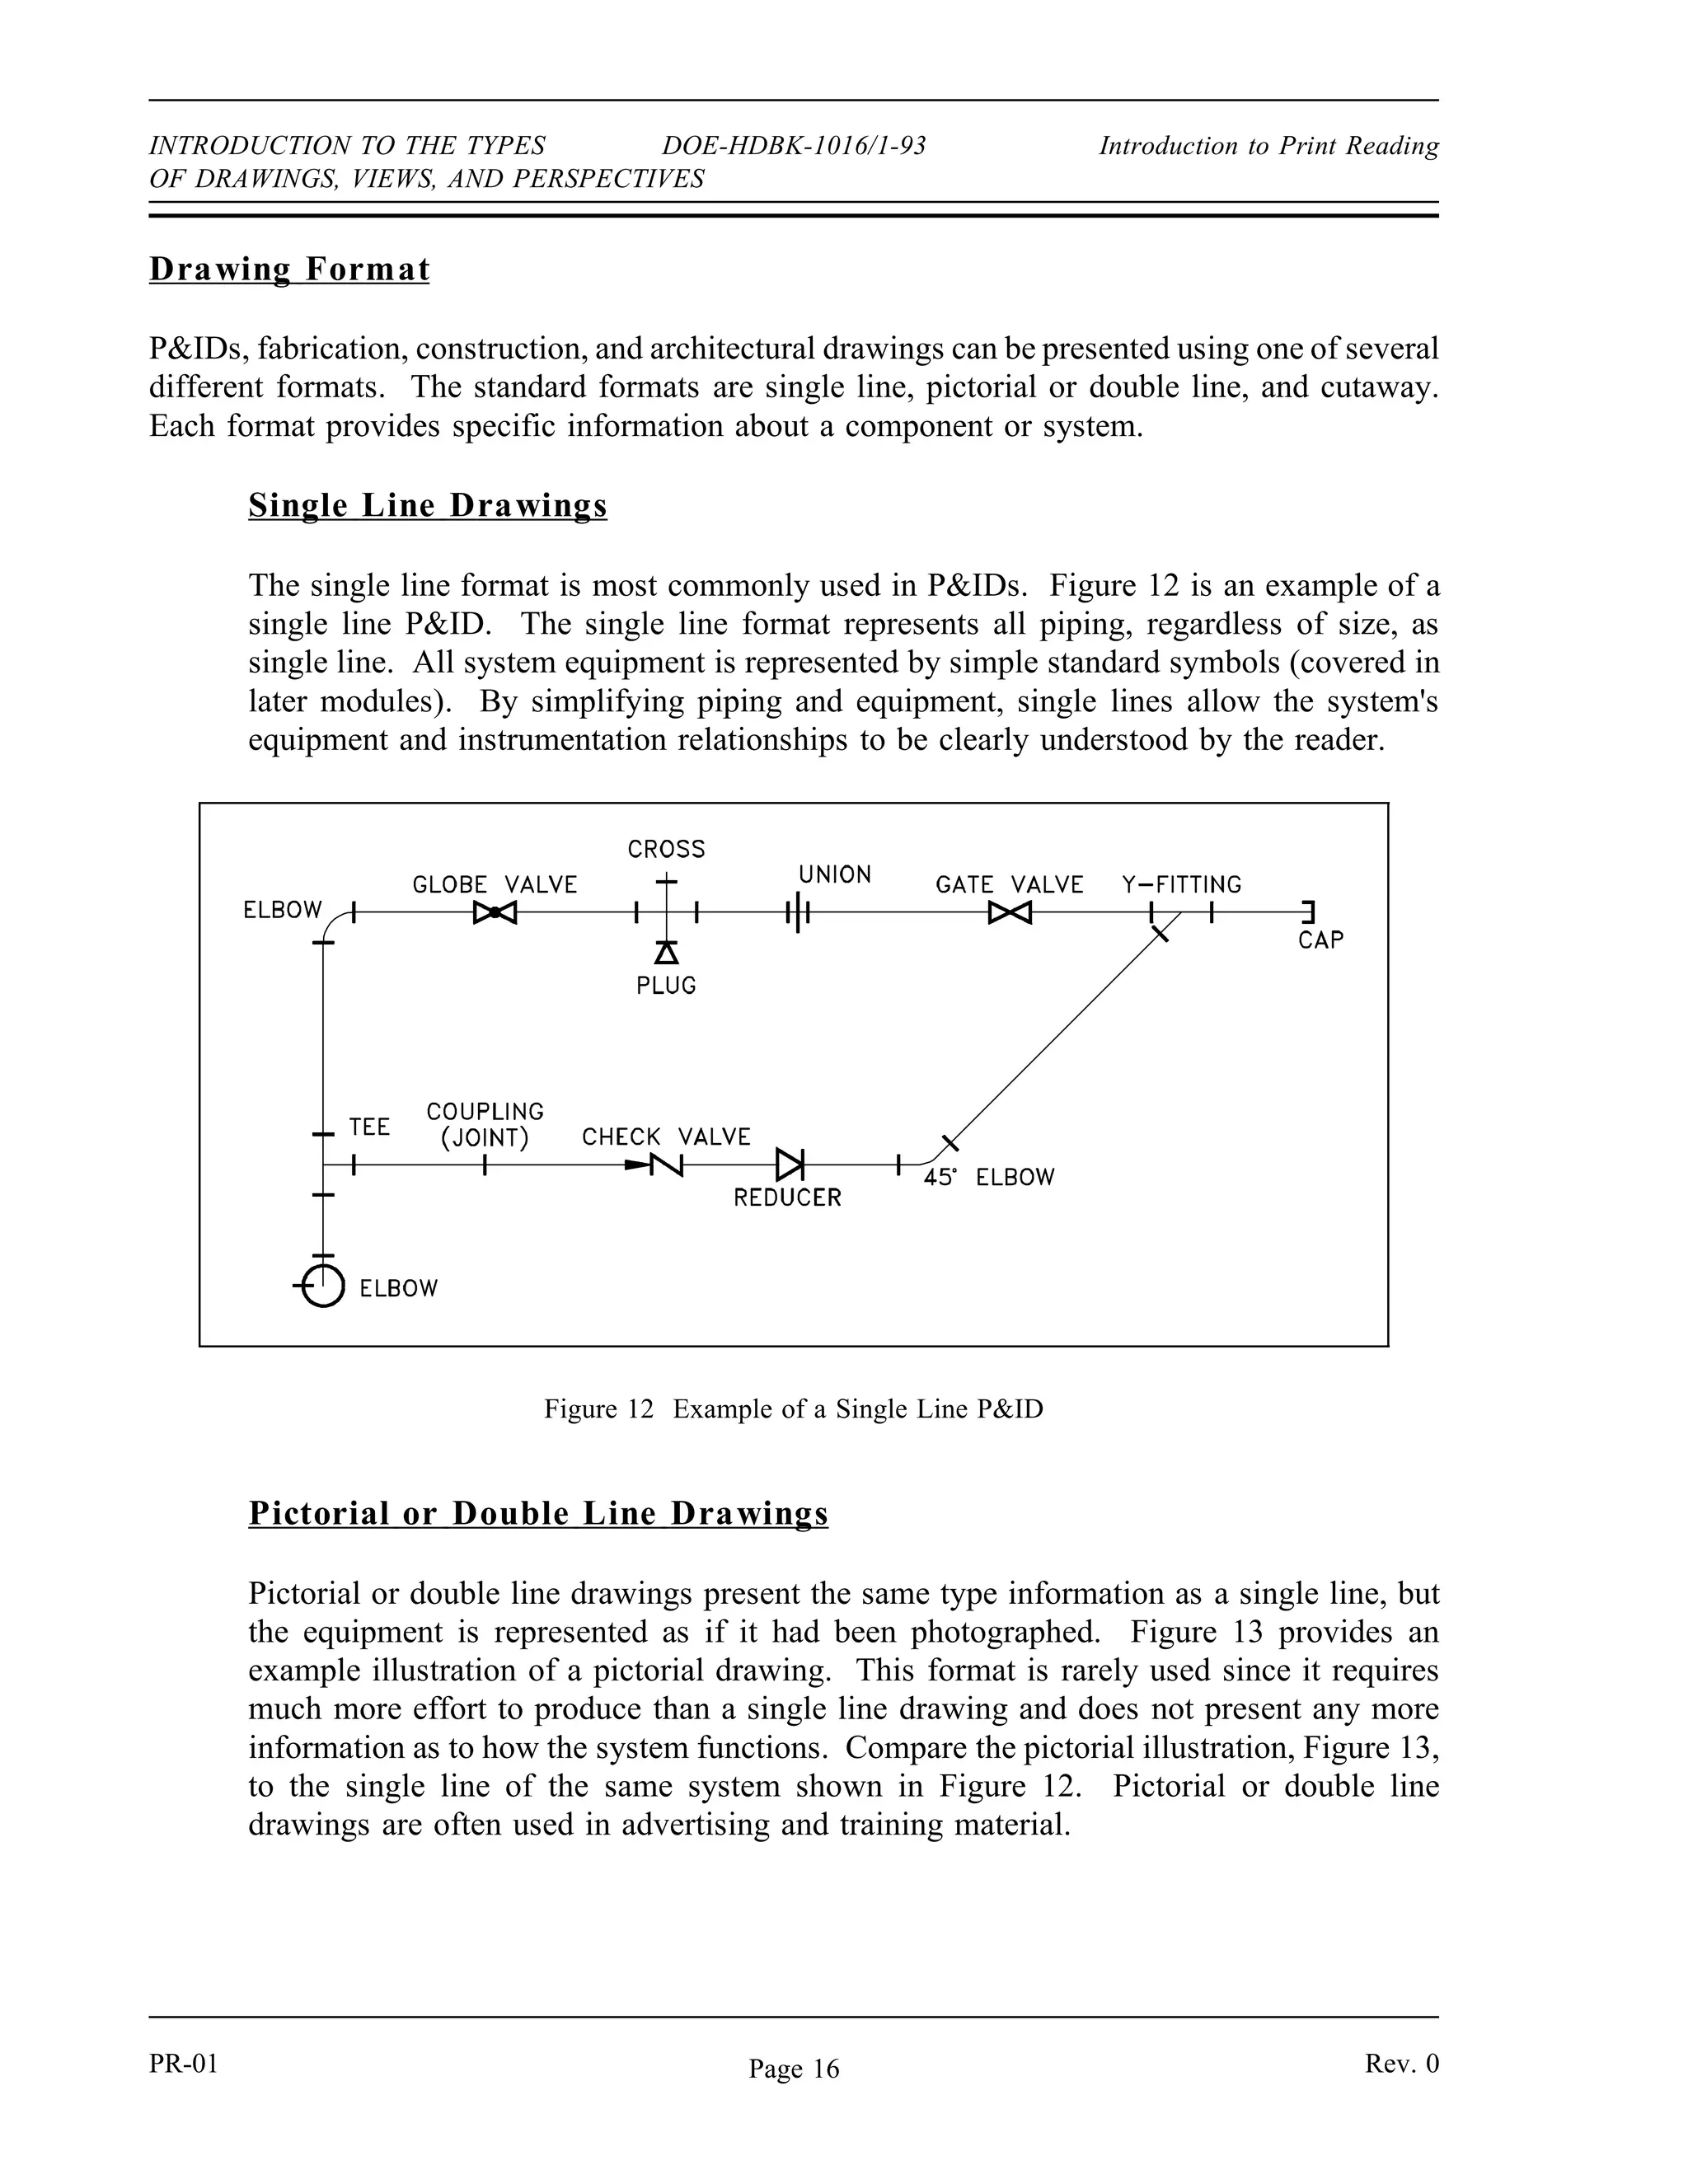


This document provides an overview of an engineering fundamentals handbook on engineering symbology, prints, and drawings. The handbook was developed to provide nuclear facility operators, maintenance personnel, and technical staff with the necessary fundamentals of engineering prints, their use, and function. The handbook covers various types of engineering drawings including piping and instrumentation drawings, electrical diagrams, electronic diagrams, logic diagrams, and fabrication/construction drawings. It also reviews the typical anatomy of an engineering drawing including title blocks, grids, revision blocks, notes, legends, and common views and perspectives. The handbook aims to provide personnel with a foundation for correctly reading, interpreting, and using the various engineering documents relevant to DOE nuclear facility operations and maintenance.


