Downloaded 12 times


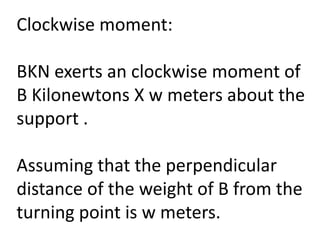

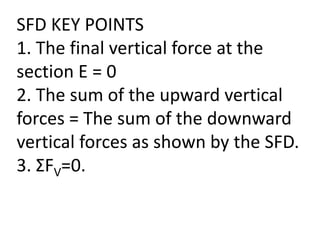
![X ;Y coordinates Calculation
Point
A
Y= 14.8125KN;
X = 0 meters
Reaction
Support A
acts
Upwards
Point
C
Y = 5.8125KN
X = 3 m
14.8125KN
– (3KN/m
X 3m)]
Point
D
Y = 5.8125KN
X = 5m](https://image.slidesharecdn.com/8fae7d3f-f333-4c5a-930b-a6590523c56b-150726122108-lva1-app6891/85/Engineering-Science-1-23-320.jpg)


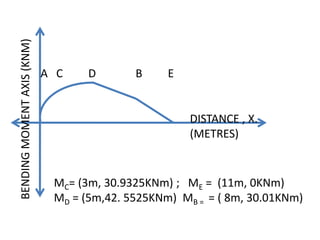
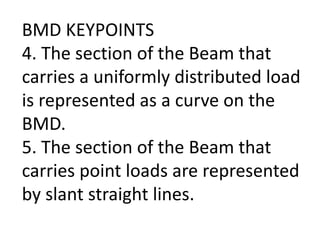

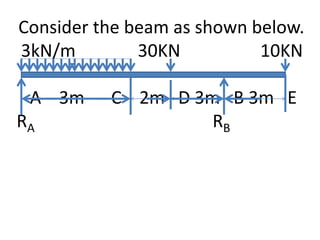
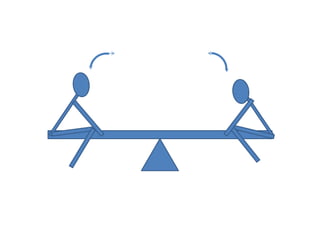
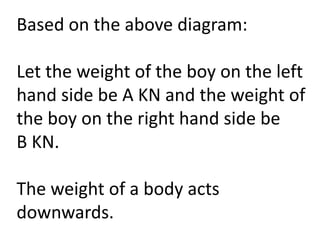
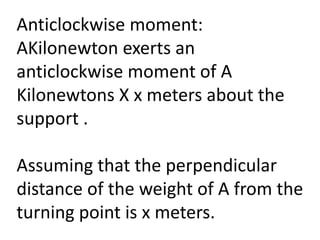
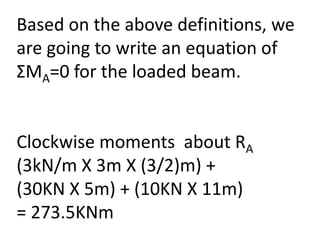
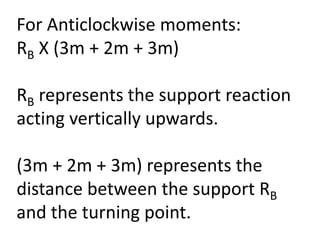
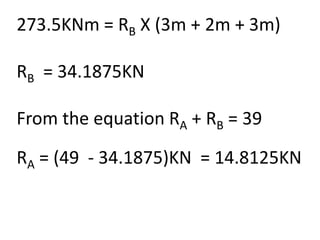
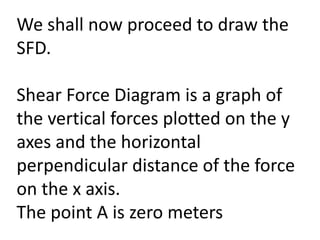
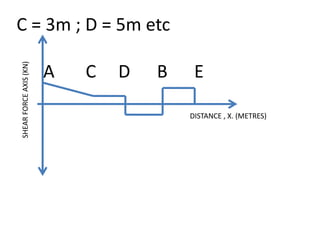
1) The document discusses shear force diagrams (SFD) and bending moment diagrams (BMD) for a loaded beam. 2) Key equations for a loaded beam include the sum of vertical forces equals zero, and the sum of clockwise and anticlockwise moments equals zero. 3) An example beam is given and the SFD and BMD are drawn by calculating reaction forces, shear forces, and bending moments at different points along the beam.