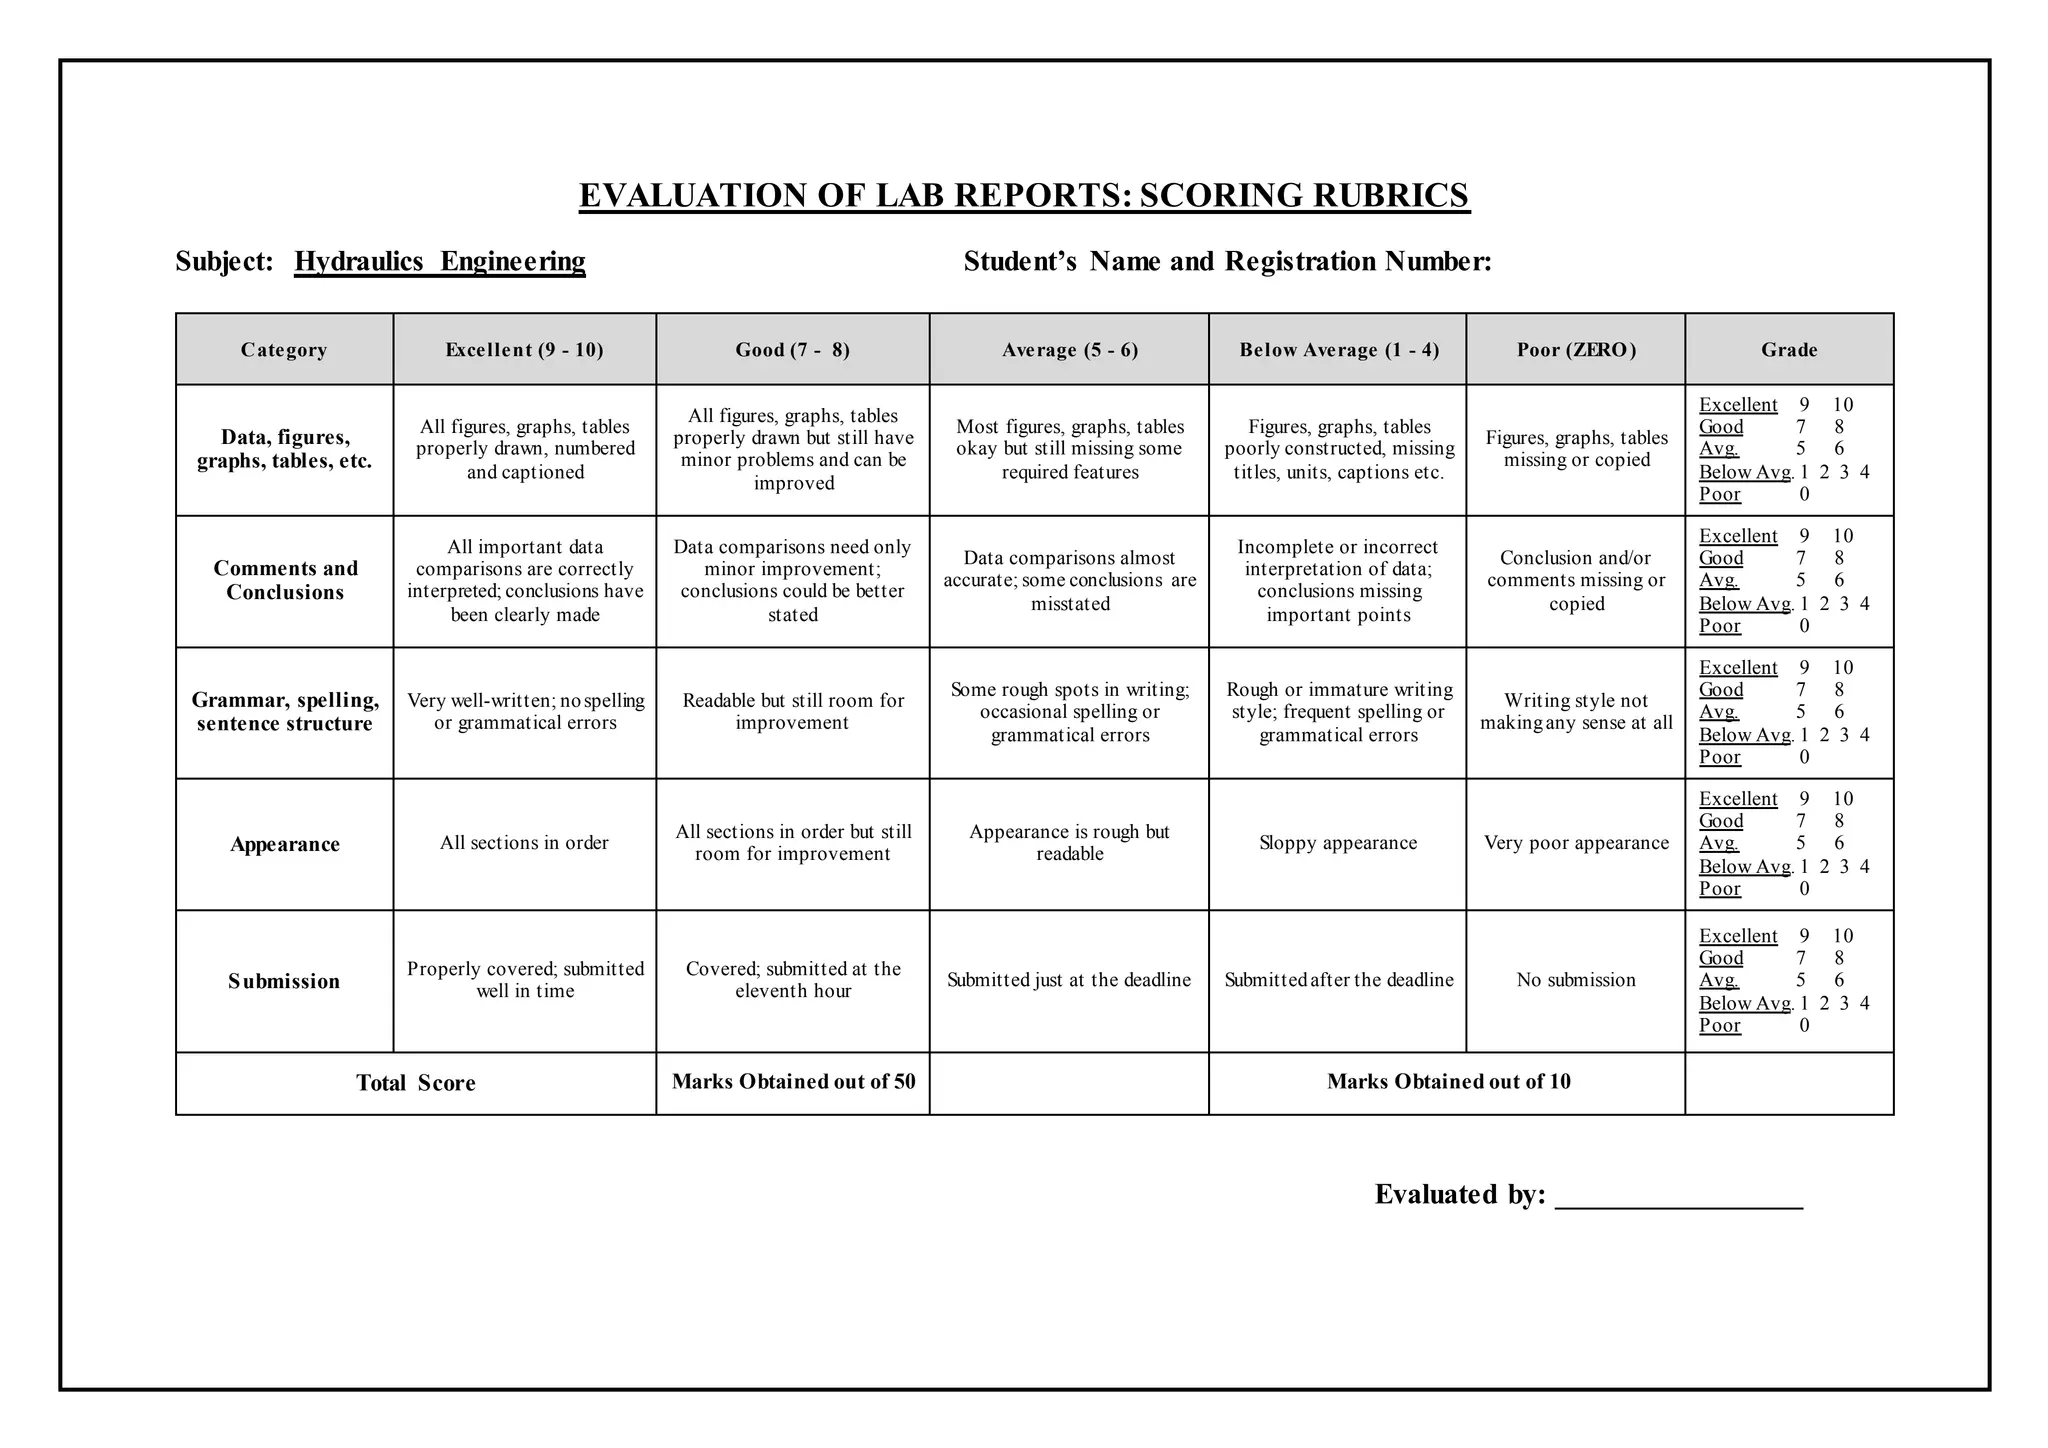
This laboratory manual provides instructions for undergraduate students to complete hydraulic engineering experiments in a laboratory setting. It includes layout of the laboratory, general safety guidelines, procedures for 4 experiments involving open channel flow, specific energy relationships, flow over a hump/weir, and hydraulic jumps. It also includes procedures for 4 design exercises applying hydraulic principles and equations. Graphs, tables, and spaces are provided for recording observations, calculations, and results. The goal is for students to apply hydraulic theory and gain practical experience with hydraulic phenomena in a controlled environment.
Geophysical methods of soil/Foundation testing Pirpasha Ujede
Geophysical methods such as seismic refraction and resistivity testing provide non-invasive subsurface investigation over large areas more quickly and cheaply than traditional boring and testing. However, geophysical results require interpretation and are less definitive. Both methods are important, with geophysical testing used for initial screening and borings to accurately determine soil properties. Seismic refraction uses shock waves to determine layer velocities and depths, while resistivity measures subsurface resistivity variations related to moisture, compaction, and material to infer stratigraphy.
The document provides an overview of open channel hydraulics and discharge measuring structures. It discusses:
- Uniform and non-uniform open channel flow conditions, including gradually varied, rapidly varied, subcritical, critical and supercritical flows.
- Basic equations for uniform flow such as the continuity, energy and momentum equations.
- Hydraulic principles and formulas used to design channels and structures, including the Chezy and Manning's equations.
- Characteristics of gradually varied flow and methods for analyzing water surface profiles.
- Phenomena such as flow over a hump, through a contraction, and hydraulic jumps; and equations for analyzing conjugate depths.
this is the experiment of fluid mechanics .FLOW OVER A SHARP CRESTED WEIR.experiment of weir.from this experiment we can learn discharge over the sharp crested weir and etc.
In situ permeability testing in boreholesMartin Preene
This document discusses in-situ hydraulic testing methods for low permeability materials. It defines hydraulic conductivity and permeability, and describes current UK testing practices like packer injection tests. More sophisticated pulse tests and deconvolution analysis methods are presented, which are useful for very low permeability environments. These specialist techniques allow reliable determination of flow models and permeability for applications like nuclear waste repositories.
The document discusses laboratory soil compaction tests. It defines compaction as increasing the bulk density of soil by removing air through external compactive effort. An optimum water content exists where soil achieves maximum density. The document outlines standard and modified Proctor compaction tests and describes how to conduct the tests by compacting soil in layers using specified hammers and measuring dry density at different water contents. Compaction increases soil strength, stability and resistance to erosion while decreasing permeability and compressibility.
This document discusses permeability and seepage in soils. It begins with an overview of permeability, noting that it is a measure of how easily water can flow through soil. Darcy's law is then presented, which relates permeability to flow velocity. Several laboratory tests for measuring permeability are also described, including constant head, falling head, and determination from consolidation or capillary tests. Real-world applications where permeability is important are mentioned, such as seepage through dams or behind retaining walls.
SHEAR STRENGTH THEORY
the shear strength of any material is the load per unit area or pressure that it can withstand before undergoing shearing failure.
1. Stage measurement involves using staff gauges, wire gauges, and automatic recorders like float gauges and bubble gauges to measure the water surface elevation in a river over time.
2. Staff gauges involve a fixed graduated staff while wire gauges lower a weighted wire from above the water surface. Float gauges use a float and pulley system connected to a recorder while bubble gauges measure pressure from gas bled into the river.
3. Automatic recorders provide continuous measurements of stage over time in a stage hydrograph, which is important for estimating design floods and historical flood discharges.
Flow Through Orifices, Orifice, Types of Orifice according to Shape Size Edge Discharge, Jet, Venacontracta, Hydraulic Coefficients, Coefficient of Contraction,Coefficient of Velocity, Coefficient of Discharge, Coefficient of Resistance, Hydraulic Coefficients by Experimental Method, Discharge Through a Small rectangular orifice, Discharge Through a Large rectangular orifice, Discharge Through a Fully Drowned orifice, Discharge Through Partially Drowned orifice, Mouthpiece and its types. By Engr. M. Jalal Sarwar
This document describes how to derive a required time (T) unit hydrograph from a given time (D) unit hydrograph when T is not a multiple of D using the S-curve method. It explains that an S-curve hydrograph is generated by continuous, uniform effective rainfall and rises continuously in the shape of an S until equilibrium is reached. The ordinates of the S-curve can be calculated using the equation S(t) = U(t) + S(t-D), where S(t) is the ordinate of the S-curve at time t, U(t) is the ordinate of the given unit hydrograph at time t, and S(t-D) is the
This document discusses methods for selecting design floods for hydraulic structures. It describes three types of design floods: spillway design flood, standard project flood, and probable maximum flood. The spillway design flood is used for spillway design. The standard project flood results from extreme but plausible meteorological conditions. The probable maximum flood represents the physically possible worst case flood. The document also provides examples of calculating design floods using the Gumbel method and defines safety factors and margins of safety for flood discharge estimates.
Class notes of Geotechnical Engineering course I used to teach at UET Lahore. Feel free to download the slide show.
Anyone looking to modify these files and use them for their own teaching purposes can contact me directly to get hold of editable version.
The document discusses the design and estimation of an Intze tank. It includes an abstract that describes the need for water storage and supply. It then covers various topics related to designing water tanks such as estimating water demand based on population and consumption rates, classifying different types of water tanks, design requirements for concrete water tanks, and the design of specific elements like domes and overhead tanks. The document aims to provide theory and guidelines for designing a reinforced concrete elevated circular water tank with a domed roof and conical base using the working stress method.
This document discusses different methods for computing average rainfall over a basin including arithmetic average, Thiessen polygon, and isohyetal methods. It provides examples of calculating average rainfall using each method. It also discusses presenting rainfall data through mass curves and hyetographs. The arithmetic average method simply takes the mean of recorded rainfall values at stations. Thiessen polygon method weights values based on each station's representative area. Isohyetal mapping involves contouring equal rainfall and calculating weighted averages between contours.
This document provides 10 examples of problems related to bearing capacity of foundations. The examples calculate bearing capacity using Terzaghi's analysis for different soil and foundation conditions, including cohesionless and cohesive soils, square and strip footings, and considering the water table depth. One example compares results to field plate load tests. The solutions show calculations for determining soil shear strength parameters, factor of safety, and safe bearing capacity.
Minor losses are a major part in calculating the flow, pressure, or energy reduction in piping systems. Liquid moving through pipes carries momentum and energy due to the forces acting upon it such as pressure and gravity. Just as certain aspects of the system can increase the fluids energy, there are components of the system that act against the fluid and reduce its energy, velocity, or momentum. Friction and minor losses in pipes are major contributing factors.
Reservoir sedimentation & its controlZahinRana
This document discusses reservoir sedimentation and its control. It begins with an introduction that defines a reservoir as an enlarged natural or artificial lake or pond created by a dam to store water. It then explains that reservoirs experience sedimentation as rivers carry sediment from erosion that is deposited in the reservoir, reducing its storage capacity over time. The document outlines the types of sediment as suspended or bed load. It lists the causes of sedimentation as the nature of catchment soils, vegetation cover, topography, rainfall intensity and land cultivation. Finally, it discusses methods to control sedimentation such as proper design, sediment control structures, and sediment removal.
This document provides information on analyzing the stability and safety of concrete gravity dams. It discusses the different loading cases to consider, including empty reservoir, full reservoir under normal and flood conditions, and with seismic forces. It describes analyzing the dam's stability against overturning, sliding, shear stresses, and foundation and concrete overstresses. The document outlines the assumptions made in stability analysis and the recommended safety factors. It also discusses determining normal and principal stresses in the dam, and ensuring compressive stresses are maintained.
APPLICATION OF SPECIFIC ENERGY IN FLUID MECHANICSKaran Patel
The document discusses two applications of specific energy in fluid mechanics: 1) Flow through a rectangular channel transition where the width gradually reduces, and 2) Flow over a raised channel floor or "hump". For channel transitions, the specific energy at the initial and final sections must be equal, allowing analysis of how the water surface and flow depth change through the transition. For raised floors, the specific energy upstream minus the height raised gives the specific energy over the floor, enabling calculation of the maximum height the floor can be raised before flow becomes critical.
Lacey's regime theory states that the dimensions and slope of a channel are uniquely determined by the discharge, silt load, and erodibility of the soil material. A channel is in regime if there is no scouring or silting. Lacey proposed equations to calculate parameters like velocity, slope, and dimensions based on variables like discharge, silt factor, and side slopes. The theory has limitations as the conditions of true regime cannot be achieved and parameters like silt grade/load are not clearly defined. Lacey also developed shock theory accounting for form resistance due to bed irregularities.
The document describes procedures for determining the liquid limit and plastic limit of soil samples. The liquid limit test involves adding water to soil and determining the moisture content at which a groove closes after 25 blows. The plastic limit is the moisture content at which a soil ball crumbles after rolling out to 3mm diameter. These limits are used to classify soils and predict properties like strength and compressibility. The plasticity index, defined as the liquid limit minus the plastic limit, provides further information on soil type and reactivity. Proper determination of the Atterberg limits is important for building foundations to ensure suitable shear strength and volume change with moisture fluctuations.
Case study on effect of water table on bearing capacityAbhishek Mangukiya
The document discusses the effect of water table on soil bearing capacity. It states that a water table located within the width of a foundation's base will reduce the soil's bearing capacity. The bearing capacity equation is provided, along with factors to account for water table depth. If the water table is below the base width, it has no effect on bearing capacity. A case study finds that for a given project, the water table depth exceeds the foundation depth, so there is no water table effect on soil bearing capacity. In summary, the proximity of the water table can impact a soil's ability to support structural loads, and established methods account for water table levels in bearing capacity calculations.
This document describes different types of infiltrometers used to measure infiltration rates of water into soil. A single ring infiltrometer consists of a metal cylinder driven into the ground filled with a fixed level of water. A double ring infiltrometer uses two concentric rings to better control lateral water flow. A rainfall simulator produces controlled rainfall over a plot of land to measure surface runoff under varying rainfall intensities and durations.
Lec.2 statically determinate structures & statically indeterminate struct...Muthanna Abbu
The student will learn the determination of internal forces in different structures and the
kind of forces distribution due to external & internal effects .He will also learn about the
structures deformation due to these effects .
Determination of Field Density Using Sand Cone Method | Jameel AcademyJameel Academy
The document describes a soil mechanics lab report on determining field density using the sand cone method. The test procedure involves digging a hole, placing the excavated soil in an airtight bag, then using a sand cone apparatus to pour sand into the hole to determine the hole's volume. Calculations are shown to find the field dry unit weight, water content, and relative density compared to the maximum dry unit weight from a lab compaction test. The results found a field dry unit weight of 1.4149 g/cm3 and relative density of 72%, indicating the field compaction was not adequate for the project.
The document discusses gradually varied flow in open channels. It defines gradually varied flow as flow where the depth changes gradually along the channel. It presents the assumptions and governing equations for gradually varied flow analysis. It also describes different types of water surface profiles that can occur, such as mild slope, steep slope, critical slope, and adverse slope profiles. The key methods for analyzing water surface profiles, including direct integration, graphical integration, and numerical integration are summarized.
A group of 16 square piles extends 12 m into stiff clay soil, underlain by rock at 24 m depth. Pile dimensions are 0.3 m x 0.3 m. Undrained shear strength of clay increases linearly from 50 kPa at surface to 150 kPa at rock. Factor of safety for group capacity is 2.5. Determine group capacity and individual pile capacity.
The group capacity is calculated to be 1600 kN. The individual pile capacity is determined to be 100 kN. The factor of safety of 2.5 is then applied to determine the safe load capacity.
Module 1: Master's Prepared Nurse Interview Guide
Criteria
% Value
1: Unsatisfactory
2: Less Than Satisfactory
3: Satisfactory
4: Good
5: Excellent
% Scaling
0%
80%
88%
92%
100%
Content – 70%
Introduction
5%
Introduction lacks any discernible overall purpose or organizing claim.
Introduction is insufficiently developed and/or vague. Purpose is not clear.
Introduction is clear, forecasting development of the paper.
Introduction is comprehensive; purpose of the paper is present.
Introduction is comprehensive and makes the purpose of the paper clear by restating the thesis.
Career
Overview
15%
Omits major elements and is disorganized.
Describes but fails to paint a clear picture of the nurse's career and/or progression in a logical order.
Addresses most of the primary elements of the individual's career in a logical fashion.
Addresses the primary elements. Reader can easily see purpose.
Thoroughly presents all of the information to portray a clear chronology as well as richness of detail.
Graduate
Education
15%
Omits major elements; is disorganized; and has no depth or detail.
Describes but fails to address some of the elements; lacks depth and detail.
Addresses the same elements but lacks depth and detail.
Necessary elements are present and clearly presented. Decision-making process is evident to the reader.
Thoroughly presents the process that led to the decision to seek graduate education as well as the program itself with clarity, order, and depth.
Present
Position (includes pearls of wisdom)
20%
Omits major elements; information is tangential and disorganized.
Describes but fails to address most of the primary elements in any depth.
Addresses most of the primary elements of the present position with recognition of competencies but lacks detail.
All key elements are presented with clarity.
Thoroughly presents all of the key elements of the present position with emphasis on competencies required. Describes in rich detail, and includes advice given and original insights.
Conclusion
15%
Conclusion lacks any discernible purpose.
Conclusion is insufficiently developed and/or vague.
Conclusion is clear and identifies key points of interview but fails to draw inferences.
Conclusion is clearly evident to the reader. Career opportunities are present.
Conclusion is comprehensive; paints a clear picture of the potential outcomes and career opportunities of graduate education; identifies key points of the interview; and demonstrates insight and interpretation.
Organization and Effectiveness – 20%
Thesis Development and Purpose
7%
Paper lacks any discernible overall purpose or organizing claim.
Thesis and/or main claim are insufficiently developed and/or vague; purpose is not clear.
Thesis and/or main claim are apparent and appropriate to purpose.
Thesis and/or main claim are clear and forecast the development of the paper. It is descriptive and reflective of the arguments and appropriate to the purpose.
Thesis and/or main claim are com ...
Lab Report Assistant
Dear Science Student,
As you will learn from reading your manual, a formal Lab Report represents the
culmination of your experimental activities. It summarizes your actions, observations, and
conclusions, as well as demonstrates to your instructor that you have performed the
experiment and what you have learned from doing so. In addition, the Lab Report usually
forms the basis for your laboratory grade.
To facilitate your report writing and to take some of the formatting drudgery out of
preparing the formal report, a Lab Report Assistant section has been added to this DVD.
When you open one of these files you will see the Experiment Name at the top of the
page. For each lab experiment, relevant procedural sections including necessary
questions to be addressed and tables that should be integrated into the report are
included. An MS-Word document is provided so that you can copy and paste questions
and tables into your lab report document. This will save you time and trouble plus allow
you to input data directly into the pre-formatted tables.
Before writing a lab report, it is helpful to understand what instructors usually believe
constitutes a good lab report and to know the criteria they often use to evaluate students’
reports. On the following page is a copy of a standard lab report grading rubric that is
used by many science instructors. Invest a little time to study it and understand how
instructors usually allocate points when grading reports. Familiarize yourself with the six
standard sections of a lab report and the criteria on which they are evaluated. This will
not only help you write the A+ reports you deserve, it will also help you focus your
attention on the more relevant aspects of your experimentation activities so that you can
better learn and address them in your report.
Understanding science is foundational to understanding ourselves and the world we live
in plus essential to making the informed decisions that will preserve our planet for future
generations. Apart from such lofty goals, it is fun and exciting to study science, perform
hands-on labs, and experience first-hand how nature and the universe work.
All the staff at Hands-On Labs wishes you a wonderful science learning experience as
you work with the LabPaqs we have designed to enrich your course.
Science Laboratory Report Grading Rubric
Developed by Peter Jeschofnig, Ph.D.
TOTAL OUT OF 100 POSSIBLE POINTS ________
Unsatisfactory Borderline Satisfactory Excellent Score
Title Page
Total = 5 pts.
Missing more than two
items, title, or names
0–2 points
Contains title and all
names; but missing two
items
3 point
Contains title and names;
but missing one item
4 points
Contains title, author’s and
partner’s names, course
name, experiment number,
and report dates
5 points
Abstract
Total = 10 pts.
No abstract; incomplete
purpose and/or
incomp ...
1. The document outlines the agenda for a 2011 training and standardization event for Edexcel examiners, including a welcome, training on sampling rules and report forms, and a standardization exercise.
2. The standardization exercise involves questions to test examiners and discussion of answers, with the goal of improving consistency in assessment decisions.
3. Guidelines are provided on assessment processes such as ensuring assignment briefs include clear evidence requirements and that feedback is linked to grading criteria.
BUSI 642Thematic Integration of Faith and Learning RubricCri.docxfelicidaddinwoodie
BUSI 642
Thematic Integration of Faith and Learning Rubric
Criteria
Content
Levels of Achievement
98 Points
Advanced
Proficient
Developing
Not Present
Points Earned
Key Components
& Major Point Support
98-92 points
· Student exhibits a defined and clear understanding of the assignment. Thesis is clearly defined and well constructed to help guide the reader throughout the assignment. Student builds upon the thesis of the assignment with well-documented and exceptional supporting facts, figures, and/or statements
· Student demonstrates proficient command of the subject matter in the assignment. Assignment shows an impressive level of depth of student’s ability to relate course content to practical examples and applications. Student provides comprehensive analysis of details, facts, and concepts in a logical sequence.
· Student demonstrates a higher level of critical thinking necessary for doctoral-level work. Student provides a strategic approach in presenting examples of problem solving or critical thinking, while drawing logical conclusions, which are not immediately obvious. Student provides well-supported ideas and reflection with a variety of current and/or worldviews in the assignment. Student presents a genuine intellectual development of ideas throughout assignment.
91-85 points
· Establishes a good comprehension of topic and in the building of the thesis. Student demonstrates an effective presentation of thesis, with most support statements helping to support the key focus of assignment.
· Student exhibits above average usage of subject matter in assignment. Student provides above average ability in relating course content in examples given. Details and facts presented provide an adequate presentation of student’s current level of subject matter knowledge.
· Student exhibits a good command of critical thinking skills in the presentation of material and supporting statements. Assignment demonstrates the students above average use of relating concepts by using a variety of factors. Overall, student provides adequate conclusions, with two or fewer errors.
84-1 points
· Student exhibits a basic understanding of the intended assignment, but the thesis is not fully supported throughout the assignment. While thesis helps to guide the development of the assignment, the reader may have some difficulty in seeing linkages between thoughts. While student has included a few supporting facts and statements, this has limited the quality of the assignment.
· The assignment reveals that the student has a general, fundamental understanding of the course material. There are areas of some concern in the linkages provided between facts and supporting statements. Student generally explains concepts, but only meets the minimum requirements in this area.
· Student takes a common, conventional approach in guiding the reader through various linkages and connections presented in assignment. Student presents a limited perspective on key.
1 Rubric for Chemical and Petroleum Engineering Researc.docxfelicidaddinwoodie
This document provides a rubric and guidelines for assessing a chemical or petroleum engineering research report or thesis. The rubric includes criteria for introduction, literature review, methodology, results, discussion/conclusion, formatting and more. Key areas that will be evaluated include clearly stating the aims of the project, conducting an up-to-date and relevant literature review, using an appropriate methodology, thoroughly analyzing results, and discussing findings in relation to the literature. General guidelines are also provided on the expected structure of the report, including sections for the background, purpose, objectives, and conclusions. Proper formatting and referencing is expected, as well as clear and logical writing.
This document provides details for an assignment for a mathematics/computation module. It includes 5 questions worth a total of 100 marks. It provides learning outcomes being tested, submission details, formatting instructions, and assessment criteria. The deadline is February 3rd, 2015. References must be included using the Numeric or Harvard style. Questions involve solving differential equations using Laplace transforms, Markov modeling, linear programming, and probabilistic analysis techniques.
BUSI 230Discussion Board Forum 1Project 2 InstructionsSta.docxRAHUL126667
BUSI 230
Discussion Board Forum 1/Project 2 Instructions
Standard Deviation and Outliers
Thread:
For this assignment, you will use the Project 2 Excel Spreadsheet to answer the questions below. In each question, use the spreadsheet to create the graphs as described and then answer the question.
Put all of your answers into a thread posted in Discussion Board Forum 1/Project 2.
This course utilizes the Post-First feature in all Discussion Board Forums. This means you will only be able to read and interact with your classmates’ threads after you have submitted your thread in response to the provided prompt. For additional information on Post-First, click here for a tutorial. This is intentional. You must use your own work for answers to Questions 1–5. If something happens that leads you to want to make a second post for any of your answers to Questions 1–5, you must get permission from your instructor.
1. A. Create a set of 5 points that are very close together and record the standard deviation. Next, add a sixth point that is far away from the original 5 and record the new standard deviation.
What is the impact of the new point on the standard deviation? Do not just give a numerical value for the change. Explain in sentence form what happened to the standard deviation. (4 points)
B. Create a data set with 8 points in it that has a mean of approximately 10 and a standard deviation of approximately 1. Use the second chart to create a second data set with 8 points that has a mean of approximately 10 and a standard deviation of approximately 4. What did you do differently to create the data set with the larger standard deviation? (4 points)
2. Go back to the spreadsheet and clear the data values from Question 1 from the data column and then put values matching the following data set into the data column for the first graph. (8 points)
50, 50, 50, 50, 50.
Notice that the standard deviation is 0. Explain why the standard deviation for this one is zero. Do not show the calculation. Explain in words why the standard deviation is zero when all of the points are the same. If you don’t know why, try doing the calculation by hand to see what is happening. If that does not make it clear, try doing a little research on standard deviation and see what it is measuring and then look again at the data set for this question.
3. Go back to the spreadsheet one last time and put each of the following three data sets into one of the graphs. Record what the standard deviation is for each data set and answer the questions below.
Data set 1:
0, 0, 0, 100, 100, 100
Data set 2:
0, 20, 40, 60, 80, 100
Data set 3:
0, 40, 45, 55, 60, 100
Note that all three data sets have a median of 50. Notice how spread out the points are in each data set and compare this to the standard deviations for the data sets. Describe the relationship you see between the amount of spread and the size of the standard deviation and explain why this connection exists. Do not give your calcu ...
Paper
Graduate Level Rubric:
APUS Assignment Graduate Level Rubric
500-600
EXEMPLARY
LEVEL
ACCOMPLISHED
LEVEL
DEVELOPING
LEVEL
BEGINNNIG
LEVEL
TOTAL POINTS
FOCUS AND THESIS
Student exhibits a defined and clear understanding of the assignment. Thesis is clearly defined and well constructed to help guide the reader throughout the assignment. Student builds upon the thesis of the assignment with well-documented and exceptional supporting facts, figures, and/or statements.
10 points
Establishes a good comprehension of topic and in the building of the thesis. Student demonstrates an effective presentation of thesis, with most support statements helping to support the key focus of assignment.
7 points
Student exhibits a basic understanding of the intended assignment, but the thesis is not fully supported throughout the assignment. While thesis helps to guide the development of the assignment, the reader may have some difficulty in seeing linkages between thoughts. While student has included a few supporting facts and statements, this has limited the quality of the assignment.
5 points
Exhibits a limited understanding of the assignment. Reader is unable to follow the logic used for the thesis and development of key themes. Introduction of thesis is not clearly evident, and reader must look deeper to discover the focus of the writer. Student’s writing is weak in the inclusion of supporting facts or statements.
1 point
/10
CONTENT AND SUBJECT KNOWLEDGE
Student demonstrates proficient command of the subject matter in the assignment. Assignment shows an impressive level of depth of student’s ability to relate course content to practical examples and applications. Student provides comprehensive analysis of details, facts, and concepts in a logical sequence.
25 points
Student exhibits above average usage of subject matter in assignment. Student provides above average ability in relating course content in examples given. Details and facts presented provide an adequate presentation of student’s current level of subject matter knowledge.
20 points
The assignment reveals that the student has a general, fundamental understanding of the course material. Whereas, there are areas of some concerning in the linkages provided between facts and supporting statements. Student generally explains concepts, but only meets the minimum requirements in this area.
15 points
Student tries to explain some concepts, but overlooks critical details. Assignment appears vague or incomplete in various segments. Student presents concepts in isolation, and does not perceive to have a logical sequencing of ideas.
10 points
/25
CRITICAL THINKING SKILLS
Student demonstrates a higher-level of critical thinking necessary for 500-600 level work. Learner provides a strategic approach in presenting examples of problem solving or critical thinking, while drawing logical conclusions which are not immediately obvious. Student provides well-supported ideas.
This document is a grading rubric for a lab experiment in the ECET-330: Microprocessor Architecture course. It evaluates students on objectives and results, conclusions, troubleshooting, observations/measurements, and questions. For each category, it provides descriptors for excellent, good, satisfactory, and needs improvement scores. The professor and raw score are listed at the top, along with the total points possible.
EGR 1403TECHNICAL COMMUNICATIONJOHN W. STRYBOS, P.E.21.docxjack60216
EGR 1403
TECHNICAL COMMUNICATION
JOHN W. STRYBOS, P.E.
210-367-3039
[email protected][email protected]
9/28/2015 EGR 1403 1
mailto:[email protected]
ABET FOLDER IS REQUIRED FOR EACH
STUDENT
• DUE WHEN YOU TAKE THE FINAL EXAM.
• THE ABET FOLDER INCLUDES GRADED
HOMEWORK, QUIZZES, TESTS AND PROJECT.
• THE ABET FOLDER DOES NOT INCLUDE NOTES
AND HANDOUTS.
• Extra credit of an amount to be determined
will be provided for students that turn in a
complete and organized ABET binder.
9/28/2015 CE 4313 2
PROJECT STEPS
DATE Memo
Number
Essay Title Ideas % of Final
Course
Grade
September 16, 2015 1 Brainstorming Several 10%
September 30, 2015 2 Comparison and
Contrast
4 (3 plus
conventional
construction)
10%
October 14, 2015 3 Technical Memo 1 10%
November 18, 2015 4 Technical Memo
with Graphs =
Draft Final Report
1 10%
11/23, 25, 30, 12/1,
2015
Group
Presentation
Presentation 1 10%
December 7 and 9,
2015
Group Final
Report
Final Report 1 10%
Total 1
Presentation
5 Writing
Assignments
60%
9/28/2015 EGR 1403 3
EGR 1403 COURSE GRADING CRITERIA
Due Date ASSIGNMENT % WHAT YOU
EARNED
Quizzes
December 7, and 9, 2015 Written Communication = Final Exam 10
Homework 1 11/02/2015
Homework 2 11/16/2015
Graphical Communication 5
5
Quiz 1 August 31, 2015
Quiz 2 September 2, 2015
Personal responsibility through professional ethics and case
studies.
5
5
Writing Exercises
November 18, 2015 Summary Memorandum, after attending presentation. NO. 5 10
September 30, 2015 Compare and Contrast Memorandum after select writings. NO.
2
10
October 14, 2015 Technical instructions memorandum. NUMBER 3 10
November 18, 2015 Edit technical writing examples with graphs memorandum NO.
4 (Draft Final Report)
10
Team Design Project
September 16, 2015 Brain-storming and background research memorandum NO. 1 10
December 7 and 9, 2015 Formal project design report. (Group Final Report) 10
11/23, 25, 30, 12/1, 2015 Oral and visual presentation with audience participation 10
TOTAL 100
9/28/2015 EGR 1403 4
FINAL PRESENTATION GRADING
CRITERIA
CATEGORY Excellent 4 Good 3 Fair 2 Poor 1
Organization Students present information in logical,
interesting sequence which audience
can follow.
Students present information in
logical sequence which
audience can follow.
Audience has difficulty following
presentation because students
jump around.
Audience cannot understand
presentation because there is
no sequence of information.
Graphics Slides clear and uncluttered with
lettering large enough to be seen.
Diagrams and photos clearly labeled.
Slides clear, but contain a few
distracting transitions or
unnecessary graphics.
Slides too busy or lettering too
small.
Poorly prepared slides which
are hard to read and hard to
follow.
Mechanics Presentation has no misspellings or
grammatical errors.
Presentation has no more than
two misspellings and/or
gram ...
This document provides information about regulations and course structures for undergraduate engineering programs affiliated with Anna University in Chennai, India. It outlines requirements for course credits, attendance, examinations, grading systems, degree completion and classification. It also lists sample course schedules and subjects for the first two semesters of programs like computer science, electrical and electronics engineering, and mechanical engineering.
Faculty Comments Thank you for Week 4 – Assignment 1. I have g.docxmecklenburgstrelitzh
Faculty Comments: Thank you for Week 4 – Assignment 1. I have graded your Application to reflect the Rubric assessment: DDBA_8300_Week_4_Assignment_Rubric. Grade: 85/100 = 68/80
DDBA_8300_Week_4_Assignment 1_Rubric
Superior Criteria
Excellent Criteria
Satisfactory Criteria
Marginal
Criteria
Unsatisfactory Criteria
Not
Submitted
Element 1a:
Initial Post –
Quantitative
Problem
Statement
(Hook
& Anchor
Statements)
Points:
8 (10%)
Student presents a well-written hook (WOW statement) statement that includes a correctly formatted APA citation and a well-written anchor statement that demonstrates the magnitude of the business problem and includes a correctly formatted APA citation from a quantitative perspective. There are no errors.
Points:
7.6 (9.5%)
Student presents a well-written hook (WOW statement) statement that includes a correctly formatted APA citation and a well-written anchor statement that demonstrates the magnitude of the business problem and includes a correctly formatted APA citation from a quantitative perspective. There are one or two minor errors.
Points:
6.8 (8.5%)
Student presents a hook (WOW statement) statement that includes a correctly formatted APA citation and an anchor statement that demonstrates the magnitude of the business problem and includes a correctly formatted APA citation from a quantitative perspective; however, the hook does not provide sufficient impact or anchor does not provide a number demonstrating magnitude or citations are not appropriate.
Points:
6 (7.5%)
Student presents a cursory or incomplete hook (WOW statement) statement and/or a cursory or incomplete anchor statement that is not appropriate for a quantitative problem statement and/or is missing citations.
Points:
4 (5%)
Does not meet minimal standards.
Points:
0 (0%)
Did not submit element.
Element 1b:
Initial Post –
Quantitative
Problem
Statement
(General &
Specific
Business
Statements)
Points:
8 (10%)
Student presents a well-written general business statement that identifies an over-arching business problem and a well-written specific business problem that identifies who has the problem from a quantitative perspective. There are no errors.
Points:
7.6 (9.5%)
Student presents a well-written general business statement that identifies an over-arching business problem and a well-written specific business problem that identifies who has the problem from a quantitative perspective. There are one or two minor errors.
Points:
6.8 (8.5%)
Student presents a general business statement that identifies an over-arching business problem and a specific business problem that identifies who has the problem from a quantitative perspective; however, the general and/or specific business statements are not clear, are missing some details, and/or are not relevant to leaders in business.
Points:
6 (7.5%)
Student presents cursory or incomplete general business statement and/or cursory or incomplete specific business problem that doe.
Rubric Name naCriteriaOutline includes all the req.docxpotmanandrea
Rubric Name: n/a
Criteria
Outline includes all the required components and planned experiment meets requirements for the assignment and is clearly and accurately described. Submitted on time.
9-10 points
Outline missing one or two of the required components,
and/or
planned experiment does not meet one of requirements for the assignment
and/or
minor issues with clarity and accuracy.
7-8 points
Outline missing several of the required components,
and/or
planned experiment does not meet several of the requirements for the assignment
and/or
major issues with clarity and accuracy.
5-6 points
Outline missing most of the required components
and
planned experiment does not meet the requirements of the assignment.
0-4 points
Background information about enzymes in general and about specific enzyme used in project is clearly and accurately written. Questions and hypothesis are specific, relevant and clearly stated.
14-15 points
Background information about enzymes in general and about specific enzyme is somewhat unclear and/or inaccurate. Questions and hypothesis could be more specific, relevant and clearly stated.
11-13 points
Missing background information about enzymes in general
or
about specific enzyme used in project
or
questions and hypothesis.
7-12 point
Missing background information about enzymes in general
and
about specific enzyme used in project
and
questions/hypothesis.
0-6 points
Experiment is designed to directly test the hypothesis; description of experiment is detailed and well written and includes all materials and methods used.
18-20 points
Experiment is mostly designed to test the hypothesis
and/or
description of experiment is somewhat inaccurate
and/or
some information about materials and methods used is missing
and/or
minor problems with clarity an organization.
15-17 points
Experiment is barely designed to test the hypothesis
and/or
description of experiment is inaccurate
and/or
most of the materials and methods used are missing
and/or
major problems with clarity an organization.
10-14 points
Experiment is not designed to test hypothesis
and/or
description of experiment and materials and methods used are missing.
0-9 points
Results are clearly and accurately presented in a table and/or graph format.
18-20 points
Results are presented, but minor problems with clarity and/or accuracy.
15-17 points
Results are described, but major problems with clarity and/or accuracy and/or results not presented in table or graph.
10-14 points
Results are not included
0-9 points
A clear, accurate and well organized discussion of results that demonstrates good knowledge of enzymes.
14-15 points
Minor problems with clarity, accuracy or organization
and/or
demonstrates some gaps in knowledge of enzymes.
15-17 points
Major problems with clarity, accuracy or organization
or
demonstrates minimal knowledge of enzymes.
10-14 points
Missing discussion of results, or major problems with clarity, accuracy or organizatio.
• Cooperated with fellow colleagues in a lab environment and experimented on the science of fluid flow through various types of piping and fittings.
• Researched the head loss that is caused in different piping including Venturi pipe, orifice plate, and elbow pipe fittings.
This document provides information about a Differential Equations course offered at De La Salle University. It includes the course description, learning outcomes, required outputs, grading system, learning plan, topics, and class policies. The course covers solving first and higher order differential equations using various methods, including separation of variables, exact equations, linear equations, Laplace transforms, and power series. Students are required to submit a written report on understanding the course nature. The grading system weights quizzes, other requirements, and the final exam differently depending on exemptions.
Assessment Cover page Page 1 of 1 Version 1.0 0518 .docxgalerussel59292
The document provides instructions for a 3-part assessment for a unit on leading organizational learning strategies. It includes:
1) Written questions to answer about concepts like authority, research approaches, and legislation.
2) A practical assessment involving role-playing a meeting to review an organization's learning practices and options for quality policies. The student must document the meeting.
3) Designing and developing an organizational learning strategy for a case study organization. This involves analyzing technology, human resource, and learning requirements and designing the strategy.
The assessment aims to test the student's knowledge of key concepts and ability to practically lead the development of an organizational learning strategy through tasks like meetings, analysis, and strategy design. Feedback
Assessment Cover page Page 1 of 1 Version 1.0 0518 .docxfestockton
Assessment Cover page Page 1 of 1
Version 1.0 05/18
ASSESSMENT COVER PAGE
STUDENT DETAILS / DECLARATION:
Course Name:
Unit / Subject Name: BSBLED802 Lead Learning Strategy Implementation
Trainer’s Name: Assessment No: Task 1, Task 2, Task 3
I declare that:
o I fully understand the context and purpose of this assessment.
o I am fully aware of the competency standard/criteria against which I will be assessed.
o I have been given fair notice of the date, time and venue for the assessment.
o I am aware of the resources I need and how the assessment will be conducted.
o I have had the appeals process and confidentiality explained to me.
o I agree that I am ready to be assessed and that all written work is my own.
o This assessment is my:
o First submission o Re-submission (Attempt ___ )
Student Name: Student ID:
Student’s Signature: Submission Date: / /
ASSESSOR USE ONLY: (ACADEMIC DEPARTMENT)
Result:
Assessment Task 1: o Satisfactory o Not Satisfactory
Assessment Task 2: o Satisfactory o Not Satisfactory
Assessment Task 3: o Satisfactory o Not Satisfactory
Final Assessment Result for this unit C / NYC
Feedback: Feedback is given to the student on each
Assessment task & final outcome of the unit Yes / No
Assessor’s
Feedback:
Assessor’s
Signature:
Date: / /
ASSESSMENT FIRST SUBMISSION/RE-SUBMISSION RECEIPT:
It is student’s responsibility to keep the assessment submission receipt as a proof of submission of assessment tasks.
Student Name: Student ID:
Unit / Subject Code: Assessment No:
Trainer Name: Date: / /
Signature:
BSBLED802 Assessment Instruction
Assessment/evidence gathering conditions
Each assessment component is recorded as either Satisfactory (S) or Not Yet Satisfactory (NYS). A student can only achieve
competence when all assessment components listed under procedures and specifications of the assessment section are Satisfactory.
Your trainer will give you feedback after the completion of each assessment. A student who is assessed as NYS is eligible for re-
assessment. Should the student fail to submit the assessment, a result outcome of Did Not Submit (DNS) will be recorded.
Student should be provided with an appropriate time frame in which to resubmit their work, according to the RTO’s re-assessment
policy and procedure.
Plagiarism, cheating and collusion.
Where a trainer/assessor believes there has been an incident of academic misconduct involving plagiarism, cheating, and/or
collusion, they should report this along with reasons for the allegation. Assessors should refer to their RTO’s policy and procedures
regarding training and assessment for further information.”
When all unit’s assessment tasks have been submitted and assessed (including resubmissions), print out a copy of this unit’s Final
Results Record, included as the last page of this document. Record the result f ...
EDUC 637Unit Portfolio Grading RubricCriteriaLevels of AchEvonCanales257
EDUC 637
Unit Portfolio Grading Rubric
Criteria
Levels of Achievement
Content
Advanced
Proficient
Developing
Not present
Subject, Grade, and Topic
10 points
Plan subject, topic, and grade are age appropriate.
8 to 9 points
Plan subject and topic are age appropriate, but grade is missing.
1 to 7 points
Plan is age appropriate but is missing either grade or topic.
0 points
Plan is not age appropriate.
State and National Standards
10 points
Reflects National and State standards using InTASC Standards and SOLs.
8 to 9 points
Reflects National and State standards but does not address either the InTASC Standards or SOLs.
1 to 7 points
Reflects National and State standards, but is missing InTASC Standards and SOLs
0 points
No standards are mentioned in the plan.
General Goals
10 points
The plan has identified goals for the unit of instruction that appropriately build toward the identified SOLs/InTASC Standards and subject.
8 to 9 points
The plan has identified goals for the unit of instruction that somewhat build toward the identified SOLs/InTASC Standards and subject.
1 to 7 points
The plan has identified goals for the unit of instruction that somewhat build toward the identified SOLs/InTASC Standards or subject.
0 points
The plan does not identify goals for the unit of instruction.
Specific Objectives
10 points
The plan has an objective with an audience, behavior, criterion, and demonstration of performance.
8 to 9 points
The objectives are measurable or it is observable.
1 to 7 points
The objectives are neither measurable nor observable.
0 points
No objectives are present.
Key Concepts
10 points
The plan identifies key concepts to be covered by the unit that appropriately correspond and build toward both the goals and objectives.
8 to 9 points
The plan identifies key concepts to be covered by the unit and they correspond to either the goals or objectives.
1 to 7 points
The plan identifies key concepts to be covered by the unit but does not correspond to the goals and objectives.
0 points
The plan fails to identify key concepts.
Course Map
11 to 12 points
The plan includes a detailed map of concepts and topics connecting the unit’s central theme to the context of the course.
10 points
The plan includes a map of concepts that connect to the unit’s central theme to the context of the course.
1 to 9 points
The plan includes a map of concepts that partially connect to the unit’s central theme to the context of the course.
0 points
The plan does not effectively connect the central theme to the context of the course.
Unit Map
11 to 12 points
The plan includes a detailed map of concepts and topics as connected to the central theme of the unit.
10 points
The plan includes a map of concepts and topics as connected to the central theme of the unit.
1 to 9 points
The plan includes a map of some concepts and topics as connected to the central theme of the unit.
0 points
The plan does not include a map of concepts and topics connected to the central theme of ...
Hbel 3203 teaching of grammar asgnmt qnsperoduaaxia
1. The document provides instructions for an assignment on teaching grammar for an education course. Students are asked to write a report analyzing their use of tenses in short essays and describing the grammar instruction methods used.
2. The assignment requires students to teach present and past tenses to others, have them write short essays, and analyze their ability to use tenses accurately. Students must justify their choice of explicit or implicit grammar instruction methods.
3. The report will be evaluated based on introduction, data collection method, analysis of instruction methods, analysis of tense use in essays, conclusion, and organization. Students must attach at least 5 essays for full marks.
EDUC 554Lesson Plan Grading Rubric (for edTPA preparation)CritEvonCanales257
EDUC 554
Lesson Plan Grading Rubric (for edTPA preparation)
Criteria
Levels of Achievement
Content 70%
Advanced
Proficient
Developing
Not present
Preliminary Information
5 points
All sections are complete which include the following:
· The subject/topic is reading or language arts, and the theme is one of the building blocks of reading.
· The appropriate learning segment and structure for grouping are established.
· The context along with the diversity of the students is described.
· Resources and materials are described and appropriate.
4 points
Three of the following sections are complete which include the following:
· The subject/topic is reading or language arts, and the theme is one of the building blocks of reading.
· The appropriate learning segment and structure for grouping are established.
· The context along with the diversity of the students is described.
· Resources and materials are described and appropriate.
1 to 3 points
One or 2 of the following sections are complete which include the following:
· The subject/topic is reading or language arts, and the theme is one of the building blocks of literacy.
· The appropriate learning segment and structure for grouping are established.
· The context along with the diversity of the students is described.
· Resources and materials are described and appropriate.
0 points
Not present
Content Standards
5 points
Lesson plan accurately includes standards, including state and national standards.
Standards are relevant to the grade level of the lesson and skill level based on the chart.
4 points
Lesson plan accurately includes standards, including state or national standards.
Standards are relevant to the grade level of the lesson or skill level based on the chart.
1 to 3 points
Lesson plan is missing standards; including state or national standards, but they are not relevant to the grade level of the lesson or skill level based on the chart.
0 points
Not present
Learning Objective
5 points
The objective(s) meets all of the following requirements:
· Concise statements of what students will know, understand, and be able to do at the end of the lesson (consider all 3 domains).
· Written with a condition, performance, and criterion.
· Connects directly to the summative assessment.
· Not written in paragraph format.
4 points
The objective(s) meets 2 of the following requirements:
· Concise statements of what students will know, understand, and be able to do at the end of the lesson (consider all 3 domains).
· Written with a condition, performance, and criterion.
· Connects directly to the summative assessment.
· Not written in paragraph format.
1 to 3 points
The objective(s) either do not meet the criteria or 1 of the following requirements:
· Concise statements of what students will know, understand, and be able to do at the end of the lesson (consider all 3 domains).
· Written with a condition, performance, and criterion.
· Connects directly to the summative assessment.
· Written in paragr ...
Applications of artificial Intelligence in Mechanical Engineering.pdfAtif Razi
Historically, mechanical engineering has relied heavily on human expertise and empirical methods to solve complex problems. With the introduction of computer-aided design (CAD) and finite element analysis (FEA), the field took its first steps towards digitization. These tools allowed engineers to simulate and analyze mechanical systems with greater accuracy and efficiency. However, the sheer volume of data generated by modern engineering systems and the increasing complexity of these systems have necessitated more advanced analytical tools, paving the way for AI.
AI offers the capability to process vast amounts of data, identify patterns, and make predictions with a level of speed and accuracy unattainable by traditional methods. This has profound implications for mechanical engineering, enabling more efficient design processes, predictive maintenance strategies, and optimized manufacturing operations. AI-driven tools can learn from historical data, adapt to new information, and continuously improve their performance, making them invaluable in tackling the multifaceted challenges of modern mechanical engineering.
This study Examines the Effectiveness of Talent Procurement through the Imple...DharmaBanothu
In the world with high technology and fast
forward mindset recruiters are walking/showing interest
towards E-Recruitment. Present most of the HRs of
many companies are choosing E-Recruitment as the best
choice for recruitment. E-Recruitment is being done
through many online platforms like Linkedin, Naukri,
Instagram , Facebook etc. Now with high technology E-
Recruitment has gone through next level by using
Artificial Intelligence too.
Key Words : Talent Management, Talent Acquisition , E-
Recruitment , Artificial Intelligence Introduction
Effectiveness of Talent Acquisition through E-
Recruitment in this topic we will discuss about 4important
and interlinked topics which are
Road construction is not as easy as it seems to be, it includes various steps and it starts with its designing and
structure including the traffic volume consideration. Then base layer is done by bulldozers and levelers and after
base surface coating has to be done. For giving road a smooth surface with flexibility, Asphalt concrete is used.
Asphalt requires an aggregate sub base material layer, and then a base layer to be put into first place. Asphalt road
construction is formulated to support the heavy traffic load and climatic conditions. It is 100% recyclable and
saving non renewable natural resources.
With the advancement of technology, Asphalt technology gives assurance about the good drainage system and with
skid resistance it can be used where safety is necessary such as outsidethe schools.
The largest use of Asphalt is for making asphalt concrete for road surfaces. It is widely used in airports around the
world due to the sturdiness and ability to be repaired quickly, it is widely used for runways dedicated to aircraft
landing and taking off. Asphalt is normally stored and transported at 150’C or 300’F temperature
Null Bangalore | Pentesters Approach to AWS IAMDivyanshu
#Abstract:
- Learn more about the real-world methods for auditing AWS IAM (Identity and Access Management) as a pentester. So let us proceed with a brief discussion of IAM as well as some typical misconfigurations and their potential exploits in order to reinforce the understanding of IAM security best practices.
- Gain actionable insights into AWS IAM policies and roles, using hands on approach.
#Prerequisites:
- Basic understanding of AWS services and architecture
- Familiarity with cloud security concepts
- Experience using the AWS Management Console or AWS CLI.
- For hands on lab create account on [killercoda.com](https://killercoda.com/cloudsecurity-scenario/)
# Scenario Covered:
- Basics of IAM in AWS
- Implementing IAM Policies with Least Privilege to Manage S3 Bucket
- Objective: Create an S3 bucket with least privilege IAM policy and validate access.
- Steps:
- Create S3 bucket.
- Attach least privilege policy to IAM user.
- Validate access.
- Exploiting IAM PassRole Misconfiguration
-Allows a user to pass a specific IAM role to an AWS service (ec2), typically used for service access delegation. Then exploit PassRole Misconfiguration granting unauthorized access to sensitive resources.
- Objective: Demonstrate how a PassRole misconfiguration can grant unauthorized access.
- Steps:
- Allow user to pass IAM role to EC2.
- Exploit misconfiguration for unauthorized access.
- Access sensitive resources.
- Exploiting IAM AssumeRole Misconfiguration with Overly Permissive Role
- An overly permissive IAM role configuration can lead to privilege escalation by creating a role with administrative privileges and allow a user to assume this role.
- Objective: Show how overly permissive IAM roles can lead to privilege escalation.
- Steps:
- Create role with administrative privileges.
- Allow user to assume the role.
- Perform administrative actions.
- Differentiation between PassRole vs AssumeRole
Try at [killercoda.com](https://killercoda.com/cloudsecurity-scenario/)
DEEP LEARNING FOR SMART GRID INTRUSION DETECTION: A HYBRID CNN-LSTM-BASED MODELijaia
As digital technology becomes more deeply embedded in power systems, protecting the communication
networks of Smart Grids (SG) has emerged as a critical concern. Distributed Network Protocol 3 (DNP3)
represents a multi-tiered application layer protocol extensively utilized in Supervisory Control and Data
Acquisition (SCADA)-based smart grids to facilitate real-time data gathering and control functionalities.
Robust Intrusion Detection Systems (IDS) are necessary for early threat detection and mitigation because
of the interconnection of these networks, which makes them vulnerable to a variety of cyberattacks. To
solve this issue, this paper develops a hybrid Deep Learning (DL) model specifically designed for intrusion
detection in smart grids. The proposed approach is a combination of the Convolutional Neural Network
(CNN) and the Long-Short-Term Memory algorithms (LSTM). We employed a recent intrusion detection
dataset (DNP3), which focuses on unauthorized commands and Denial of Service (DoS) cyberattacks, to
train and test our model. The results of our experiments show that our CNN-LSTM method is much better
at finding smart grid intrusions than other deep learning algorithms used for classification. In addition,
our proposed approach improves accuracy, precision, recall, and F1 score, achieving a high detection
accuracy rate of 99.50%.
Prediction of Electrical Energy Efficiency Using Information on Consumer's Ac...PriyankaKilaniya
Energy efficiency has been important since the latter part of the last century. The main object of this survey is to determine the energy efficiency knowledge among consumers. Two separate districts in Bangladesh are selected to conduct the survey on households and showrooms about the energy and seller also. The survey uses the data to find some regression equations from which it is easy to predict energy efficiency knowledge. The data is analyzed and calculated based on five important criteria. The initial target was to find some factors that help predict a person's energy efficiency knowledge. From the survey, it is found that the energy efficiency awareness among the people of our country is very low. Relationships between household energy use behaviors are estimated using a unique dataset of about 40 households and 20 showrooms in Bangladesh's Chapainawabganj and Bagerhat districts. Knowledge of energy consumption and energy efficiency technology options is found to be associated with household use of energy conservation practices. Household characteristics also influence household energy use behavior. Younger household cohorts are more likely to adopt energy-efficient technologies and energy conservation practices and place primary importance on energy saving for environmental reasons. Education also influences attitudes toward energy conservation in Bangladesh. Low-education households indicate they primarily save electricity for the environment while high-education households indicate they are motivated by environmental concerns.
Blood finder application project report (1).pdfKamal Acharya
Blood Finder is an emergency time app where a user can search for the blood banks as
well as the registered blood donors around Mumbai. This application also provide an
opportunity for the user of this application to become a registered donor for this user have
to enroll for the donor request from the application itself. If the admin wish to make user
a registered donor, with some of the formalities with the organization it can be done.
Specialization of this application is that the user will not have to register on sign-in for
searching the blood banks and blood donors it can be just done by installing the
application to the mobile.
The purpose of making this application is to save the user’s time for searching blood of
needed blood group during the time of the emergency.
This is an android application developed in Java and XML with the connectivity of
SQLite database. This application will provide most of basic functionality required for an
emergency time application. All the details of Blood banks and Blood donors are stored
in the database i.e. SQLite.
This application allowed the user to get all the information regarding blood banks and
blood donors such as Name, Number, Address, Blood Group, rather than searching it on
the different websites and wasting the precious time. This application is effective and
user friendly.
Generative AI Use cases applications solutions and implementation.pdfmahaffeycheryld
Generative AI solutions encompass a range of capabilities from content creation to complex problem-solving across industries. Implementing generative AI involves identifying specific business needs, developing tailored AI models using techniques like GANs and VAEs, and integrating these models into existing workflows. Data quality and continuous model refinement are crucial for effective implementation. Businesses must also consider ethical implications and ensure transparency in AI decision-making. Generative AI's implementation aims to enhance efficiency, creativity, and innovation by leveraging autonomous generation and sophisticated learning algorithms to meet diverse business challenges.
https://www.leewayhertz.com/generative-ai-use-cases-and-applications/
Impartiality as per ISO /IEC 17025:2017 StandardMuhammadJazib15
This document provides basic guidelines for imparitallity requirement of ISO 17025. It defines in detial how it is met and wiudhwdih jdhsjdhwudjwkdbjwkdddddddddddkkkkkkkkkkkkkkkkkkkkkkkwwwwwwwwwwwwwwwwwwwwwwwwwwwwwwwwwwwwwwwwwwwwwwwwwwwwwwwwwwwwwwwwwwwwwwwwwwwwwwwwwwwwwwwwwwwwwwwwwwwwwwwwwwwwwwwwwwwwwwwwwwwwwwwwwwwwwwwwwwwwwwwwwwwwwwwwwioiiiiiiiiiiiii uwwwwwwwwwwwwwwwwhe wiqqqqqqqqqqqqqqqqqqqqqqqqqqqqqqqqqqqqqqqqqqqqqqqqqqqqqqqqqqqqqqqqqqqqqqqqqqqqqqqqqqqqqqqqqqqqqqqqqqqqqqqqqqqqqqqqqqqqqqqqqqqqqqqqqqqqqqqqqqqqqqqqqqqqqqqqqqqqqqqqqqqqqqqqqqqqqqqqqqqqqqqqqqqqqqqqqqq gbbbbbbbbbbbbb owdjjjjjjjjjjjjjjjjjjjj widhi owqqqqqqqqqqqqqqqqqqqqqqqqqqqqqqqqqq uwdhhhhhhhhhhhhhhhhhhhhhhhhhhhhhhhhhhhhhhhhhhhhhhhhhhhhhhhhhhhhhhhhhhhhhhhhhhhhhhhhhhhhhhhhhhhhhhhhhhhhhhhhhhhhhhhhhhhhhhhhhhhhhhhhhhhhhhhhhhhhhhhhhhhhhhhhhhhhhhhhhhhhhhwqiiiiiiiiiiiiiiiiiiiiiiiiiiiiw0pooooojjjjjjjjjjjjjjjjjjjjjjjjjjjjjjjjjjjjjjjjjjjjjjjjjjjjjj whhhhhhhhhhh wheeeeeeee wihieiiiiii wihe
e qqqqqqqqqqeuwiiiiiiiiiiiiiiiiiiiiiiiiiiiiiiiiiiiiiiiiiiiiiiiiiiiiiiiiiiiiiiiiiiiiiiiiiiiiiiiiiiiiiiiiiiiiiiiiiiiiiiiiiiiiiiiiiiiiiiiiiiiiiiiiiiiiiiiiiiiiiiiiiiiiiiiiiiiiiiiiiiiiiiiiiiiiiiiiiiiiiiiiiiiiiiiiiiiiiiiiiiiiiiiiiiiiiiiiiiiiiiiiiiiiiiiiiiiiiiiiiiiiiiiiiiiiiiiiiiiiiiiiiiiiiiiiiiiiiiiiiiiiiiiiiiiiiiiiiiiiiiiiiiiiiiiiiqw dddddddddd cccccccccccccccv s w c r
cdf cb bicbsad ishd d qwkbdwiur e wetwwwwwwwwwwwwwwwwwwwwwwwwwwwwwwwwwwwwwwwwwwwwwwwwwwwwwwwwwwwwwwwwwwwwww w
dddddddddddddddddddddddddddddddddddddddddddddddddddddddddddddddddddddddddddddddddddddddddddddddddddddddddddfffffffffffffffffffffffffffffffffffffffffffffffffffffffffffffffffffffffffffffffffffffffffffffffffffffffffffffffffffffffffffffffffffffffffffffffffffffffffffffffffffffffffffffffffffffffffffffffffffffffffffffffffffffw
uuuuhhhhhhhhhhhhhhhhhhhhhhhhe qiiiiiiiiiiiiiiiiiiiiiiiiiiiiiiiiiiiiiiiiiiiiiiiiiiiiiiiiiiiiiii iqqqqqqqqqqqqqqqqqqqqqqqqqqqqqqqqqqqqqqqqqqqqqqqqqqqqqqqqqqqqqqqqqqqqqqqqqqqqqqqqqqqqqqqqqqqqqqqqqqqqqqqqqqqqqqqqqqqqqqqqqqqqqqqqqqqqq eeeeeeeeeeeeeeeeeeeeeeeeeeeeeeeeeeeeeeeeeeeeeeeeeeeeeeeeeeeeeeeeeeeeeeeeeeeeeeeeeeeeeeeeeeeeeeeeee qqqqqqqqqqqqqqqqqqqqqqqqqqqqqqqqqqqqqqqqqqqqqqqqqqqqqqqqqqqqqqqqqqqqqqqqqqqqqqqqqqqqqqqqqqqqqqqqqqqqqqqqqqqqqqccccccccccccccccccccccccccccccccccccccccccccccccccccccccccccc ccccccccccccccccccccccccccccccccccc bbbbbbbbbbbbbbbbbbbbbbbbbbbbbbbbbbbbbbbbbbbbbbbbbbbbbbbbbbbbbbbbbbbbbbbbbbbbbbbbu uuuuuuuuuuuuuuuuuuuuuuuuuuuuuuuuuuuuuuuuuuuuuuuuuuuuuuuuuuuuuuuuuuuuuuuuuuuuuuuuuuuuuuuuuuuuuuuuuuuuuuuuuuuuuuuuuuuuuuuuuuuuuuuuuuuuuuuuuuuuuuuuuuuuuuuuuum
m
m mmmmmmmmmmmmmmmmmmmmmmmmmmmmmmmmmmmmmmmmmmmmmmmmmmmmmmmmmmmmmmmmmmmmmmmmmmmmmmmmmmmmmmmmmmmm m i
g i dijsd sjdnsjd ndjajsdnnsa adjdnawddddddddddddd uw
2. 2
PREFACE
This Laboratory Manual is intended to provide undergraduate engineering students an
understanding of the practical applications of running water covering all experiments related
to the fourth year level of the B.Sc. Civil Engineering.
It explains the procedures of performing various experiments in the hydraulic laboratory. The
use of this manual in conducting the laboratory work described will lead the students in the
preparation of a laboratory report which is sufficiently detailed and exhaustive. It is a
convenient way of imparting instructions for handling apparatus, indicating the range and
accuracy of observations, and providing a guide to the presentations of results. The students
are required to interpret the result of experiment, with a view to make them appreciate the
importance and significance of the test in real life situations.
This manual is complete in itself and required graph sheets, etc. form an integral part of each
experiment included. For each experiment, the observations can be entered on the tabulated
sheets, calculations made and the results plotted on graph sheets attached. It is expected that
this manual will help students effectively in understanding the principles of hydraulics.
Theory is discussed with the help of photographs to quickly grasp the basic concepts. It also
contains brief procedure for the experiment, precautions, self-explanatory tables of
observations and calculations, blank spaces for writing results and finally comments on the
results. As practiced universally, SI units are used in this Manual. However, wherever felt
necessary, values in alternate units are also provide to facilities students.
In this Laboratory Manual, totally four experiments and four designs are covered. Experiment
number 1 refer the basic hydraulics equation, 2 refers the Specific energy relationship with
flow depth, 3 refers the effect of hump/weir on specific energy and 4 refers the hydraulic jump
development in laboratory flume. Design Exercises refers the basic hydraulic concepts related
to open channel flows. Two open ended experiments are also included.
Suggestions for improvements are welcome.
3. EVALUATION OF LAB REPORTS: SCORING RUBRICS
Subject: Hydraulics Engineering Student’s Name and Registration Number:
Category Excellent (9 - 10) Good (7 - 8) Average (5 - 6) Below Average (1 - 4) Poor (ZERO) Grade
Data, figures,
graphs, tables, etc.
All figures, graphs, tables
properly drawn, numbered
and captioned
All figures, graphs, tables
properly drawn but still have
minor problems and can be
improved
Most figures, graphs, tables
okay but still missing some
required features
Figures, graphs, tables
poorly constructed, missing
titles, units, captions etc.
Figures, graphs, tables
missing or copied
Excellent 9 10
Good 7 8
Avg. 5 6
Below Avg. 1 2 3 4
Poor 0
Comments and
Conclusions
All important data
comparisons are correctly
interpreted; conclusions have
been clearly made
Data comparisons need only
minor improvement;
conclusions could be better
stated
Data comparisons almost
accurate; some conclusions are
misstated
Incomplete or incorrect
interpretation of data;
conclusions missing
important points
Conclusion and/or
comments missing or
copied
Excellent 9 10
Good 7 8
Avg. 5 6
Below Avg. 1 2 3 4
Poor 0
Grammar, spelling,
sentence structure
Very well-written; nospelling
or grammatical errors
Readable but still room for
improvement
Some rough spots in writing;
occasional spelling or
grammatical errors
Rough or immature writing
style; frequent spelling or
grammatical errors
Writing style not
makingany sense at all
Excellent 9 10
Good 7 8
Avg. 5 6
Below Avg. 1 2 3 4
Poor 0
Appearance All sections in order
All sections in order but still
room for improvement
Appearance is rough but
readable
Sloppy appearance Very poor appearance
Excellent 9 10
Good 7 8
Avg. 5 6
Below Avg. 1 2 3 4
Poor 0
Submission
Properly covered; submitted
well in time
Covered; submitted at the
eleventh hour
Submitted just at the deadline Submittedafter the deadline No submission
Excellent 9 10
Good 7 8
Avg. 5 6
Below Avg. 1 2 3 4
Poor 0
Total Score Marks Obtained out of 50 Marks Obtained out of 10
Evaluated by: _________________
4. 4
EVALUATION OF LAB VIVA/PERFORMANCE: SCORING RUBRICS (EXPERIMENT # 1 - 4)
Subject: Hydraulics Engineering Student’s Name and Registration Number:
Category Excellent (9 - 10) Good (7 - 8) Average (5 - 6) Below Average (1 - 4) Poor (ZERO) Grade
Identifying Problem
and specifying
constraints
Student restates the
problem clearly and
precisely and identifies
many constraints
Student restates the
problem clearly and
identifies several
constraints
Student restates the
problem clearly and
identifies some
constraints
Student does not restate
the problem clearly and
identifies minor
constraints
Student does not restate the
problem clearly and fails to
identify constraints
Excellent 9 10
Good 7 8
Avg. 5 6
Below Avg. 1 2 3 4
Poor 0
Exploring
Possibilities
Student thoroughly
analyzes the pluses and
minuses of a variety of
possible solutions
Student analyzes some
pluses and minuses of a
variety of possible
solutions
Student satisfactorily
analyzes the pluses and
minuses of a variety of
possible solutions
Student inadequately
analyzes the pluses and
minuses of a variety of
possible solutions
Student does not analyze
the pluses and minuses of a
variety of possible solutions
Excellent 9 10
Good 7 8
Avg. 5 6
Below Avg. 1 2 3 4
Poor 0
Developing a design
proposal
Design proposal is accurate
and comprehensive
Design proposal is
accurate ,containing all
pertinent elements
Design proposal is
adequate , containing all
pertinent elements
Design proposal is
inadequate and lacking
pertinent information
Design proposal is wrong
and incomprehensive
Excellent 9 10
Good 7 8
Avg. 5 6
Below Avg. 1 2 3 4
Poor 0
Results and
Analysis
All formulae, calculations
and conclusions are
accurate
All formulae, calculations
and conclusions are
accurate but some minor
steps are missing
Formulae, calculations
and conclusions contain
some inaccuracies
Formulae, calculations
and conclusions are
incorrect.
Student is unable to
perform any calculations
Excellent 9 10
Good 7 8
Avg. 5 6
Below Avg. 1 2 3 4
Poor 0
Understanding of
Objectives vis-à-vis
Theory
Student fully understands
the link between performed
job and associated
theoretical concepts
Student reasonably
understands the link
between performed job
and associated theoretical
concepts
Student has some
difficulty in explaining
link between job and
associated theoretical
concepts
Student cannot identify
the associated theoretical
concepts
Student is unable to answer
any question relating
associated theoretical
concepts
Excellent 9 10
Good 7 8
Avg. 5 6
Below Avg. 1 2 3 4
Poor 0
Total Score Marks Obtained out of 50 Marks Obtained out of 10
Evaluated By: ____________________
5. 5
EVALUATION OF LAB VIVA/PERFORMANCE:SCORING RUBRICS (DESIGNEXERCISE# 1 - 4)
Subject: Hydraulics Engineering Student’s Name and Registration Number:
Category Excellent (9 - 10) Good (7 - 8) Average (5 - 6) Below Average (1 - 4) Poor (ZERO) Grade
Identifying Problem
and specifying
constraints
Student restates the
problem clearly and
precisely and identifies
many constraints
Student restates the
problem clearly and
identifies several
constraints
Student restates the
problem clearly and
identifies some constraints
Student does not restate
the problem clearly and
identifies minor
constraints
Student does not restate the
problem clearly and fails to
identify constraints
Excellent 9 10
Good 7 8
Avg. 5 6
Below Avg. 1 2 3 4
Poor 0
Exploring
Possibilities
Student thoroughly
analyzes the pluses and
minuses of a variety of
possible solutions
Student analyzes some
pluses and minuses of a
variety of possible
solutions
Student satisfactorily
analyzes the pluses and
minuses of a variety of
possible solutions
Student inadequately
analyzes the pluses and
minuses of a variety of
possible solutions
Student does not analyze
the pluses and minuses of a
variety of possible solutions
Excellent 9 10
Good 7 8
Avg. 5 6
Below Avg. 1 2 3 4
Poor 0
Developing a design
proposal
Design proposal is
accurate and
comprehensive
Design proposal is
accurate ,containing all
pertinent elements
Design proposal is
adequate , containing all
pertinent elements
Design proposal is
inadequate and lacking
pertinent information
Design proposal is wrong
and incomprehensive
Excellent 9 10
Good 7 8
Avg. 5 6
Below Avg. 1 2 3 4
Poor 0
Results and Analysis
All formulae, calculations
and conclusions are
accurate
All formulae, calculations
and conclusions are
accurate but some minor
steps are missing
Formulae, calculations
and conclusions contain
some inaccuracies
Formulae, calculations
and conclusions are
incorrect.
Student is unable to
perform any calculations
Excellent 9 10
Good 7 8
Avg. 5 6
Below Avg. 1 2 3 4
Poor 0
Understanding of
Objectives vis-à-vis
Theory
Student fully understands
the link between
performed job and
associated theoretical
concepts
Student reasonably
understands the link
between performed job
and associated theoretical
concepts
Student has some
difficulty in explaining
link between job and
associated theoretical
concepts
Student cannot identify
the associated theoretical
concepts
Student is unable to answer
any question relating
associated theoretical
concepts
Excellent 9 10
Good 7 8
Avg. 5 6
Below Avg. 1 2 3 4
Poor 0
Total Score Marks Obtained out of 50 Marks Obtained out of 10
Evaluated By: ____________________
6. 6
EVALUATION OF OPEN ENDED LAB: SCORING RUBRICS
Subject: Hydraulics Engineering Student’s Name and Registration Number:
Evaluated By: ____________________
Category Excellent (9 - 10) Good (7 - 8) Average (5 - 6) Below Average (1 - 4) Poor (ZERO) Grade
Topic
Understanding
Complete understanding of
topic
Good understanding of topic Fair understanding of topic
Minimum understanding of
topic
Poor understanding of
topic
Excellent 9 10
Good 7 8
Avg. 5 6
Below Avg. 1 2 3 4
Poor 0
Apparatus Setup
Student can properly set up
the apparatus; fully aware of
the factors that couldalterthe
results
Student can properly set up
apparatus with little
supervision; aware of factors
that could alter results
Student can set up apparatus
with some help but has limited
ability to take care of factors
affecting results
Student has difficulty setting
up the apparatus
Student cannot set up
the apparatus at all.
Excellent 9 10
Good 7 8
Avg. 5 6
Below Avg. 1 2 3 4
Poor 0
Time Management
Much time went into the
planning and design. Student
was self-motivatedthe whole
time seeking assistance as
needed.
Sometime went into the
planning and design. The
student needed some
refocusing but managed well.
Little time went into the
planning and design. The
student was sometimes
distracted or off task.
Little went into the design.
Student was often off task
and not focused on the
project.
All class time was
wasted. Student was not
focused on the task.
Excellent 9 10
Good 7 8
Avg. 5 6
Below Avg. 1 2 3 4
Poor 0
Description of
research approach,
tools and
procedures,
compliance to
standard
Excellent logical approach,
well laid out design, complete
logical tools, complete
procedure, strictly comply to
a standard
Logical approach, adequately
laid out design, mostly logical
tools, complete procedure,
almost comply to a standard
Slightly logical approach,
partially laidout design, mostly
logical tools, partly complete
procedure, loosely comply to a
standard
Barely logical approach, no
laid out design, unclear
logical tools, partly complete
procedure, barley comply to
a standard
Misleading logical
approach, no laid out
design, no logical tools,
no complete procedure,
non-compliance to any
standard
Excellent 9 10
Good 7 8
Avg. 5 6
Below Avg. 1 2 3 4
Poor 0
Explanation and
presentation of
results, Reasoning
discussion, Critical
view
Comprehensive result
presentation, informative
tables andfigures, limitations
mentioned, critical view and
reasoning
Sufficient result presentation,
informative tables and figures,
limitations mentioned,
adequate view and reasoning
Result presentation, somehow
informative tables and figures,
few limitations mentioned,
adequate view and reasoning
Result presentation, less
informative tables and
figures, no limitations
mentioned, adequate view
and reasoning
No result presentation,
no informative tables
and figures, no
limitations mentioned,
minimum view and
reasoning
Excellent 9 10
Good 7 8
Avg. 5 6
Below Avg. 1 2 3 4
Poor 0
Grammar, Sentence
structure and
Submission
Perfect grammar, variance in
sentence structure and word
choice, submitted in time
Acceptable grammar, variance
in sentence structure and word
choice, submitted at the
eleventh hour
Acceptable grammar, some
variance in sentence structure
andword choice , submittedjust
at the deadline
Acceptable grammar, limited
variance in sentence
structure and word choice,
submitted after deadline
According to standard,
limited errors in
grammar, no variancein
sentence,no submission
Excellent 9 10
Good 7 8
Avg. 5 6
Below Avg. 1 2 3 4
Poor 0
7. 7
TABLE OF CONTENTS
Sr.
No.
Description
Page
No.
1 Layout of Hydraulics Engineering Laboratory and General Safety guidelines 9
Experiments
1
To determine Chezy’s co-efficient (C) and Manning’s roughness co-efficient (n)
in laboratory flume
14
2
To experimentally investigate the relationship between specific energy (E) and
depth of flow (y)
20
3
To study the flow characteristics over a hump/weir and draw the water surface
profile over the hump
27
4
To study the flow characteristics of hydraulic jump development in tilting flume
in the laboratory
35
Design Exercises
1
1) To Plot velocity variation and discharge variation curves with respect to depth
of flow for a channel of circular section in the dimensionless form
2) Determine the conditions of flow for maximum velocity and maximum
discharge both graphically and analytically
37
2
A Trapezoidal channel having base width “B” (m), side slopes “x : 1” and
Manning’s roughness coefficient “n” is carrying a discharge “Q” (
𝑚3
𝑠𝑒𝑐
). Determine
both graphically and analytically the critical depth “𝑦𝑐", also calculate the critical
slope “𝑆𝑐", Take numerical values for 𝐵 =
Age,as 𝑡𝑜𝑑𝑎𝑦 𝑖𝑛 𝑑𝑎𝑦𝑠
600
𝑄 = 1.9𝐵
𝑛 =
𝐵
700
Take; x = 1.5 for odd registration number
x = 2 for even registration number
It is provided with a hump of height P, Assuming the hump to be frictionless and
using usual notations plot the following curves.
1) P~𝑦1
2) P~𝑦2
3) P~𝑦3
43
3
To develop the relationship between Surface Area, Elevation and Capacity of
Reservoir:
For a given reservoir develop
1) Elevation ~ Surface Area curve
2) Elevation ~ Capacity curve
3) Surface Area ~ Capacity curve
4) To develop co-relation between Elevation, Surface Area & Capacity of
reservoir to check the feasibility of project
48
8. 8
4
To estimate the live capacity of reservoir for various operational scenarios:
a) Estimate the live storage capacity of reservoir so that constant maximum
supply can be assured from this reservoir if the losses are assumed to be
negligible.
b) Estimate the live storage capacity of reservoir to have constant maximum
supply from the reservoir if 20% of the inflows are lost due to seepage
and evaporation.
c) Estimate the live storage capacity of reservoir if outflow R/2 𝑚3
𝑠𝑒𝑐
⁄ has
to be released from the reservoir from d/s usage, also plot mass curve and
decide emptying and filling program in each case.
56
Open Ended Experiments
1 To study the characteristics of flow over a different roughened beds. 67
2 Measurement of discharge beneath a Sluice Gate 70
9. 9
JOB # 1
TITLE:
Layout of Hydraulics Engineering Laboratory and General Safety guidelines
PURPOSE:
1. To get familiar with the apparatus of laboratory and their functions and also known
which apparatus is placed at which position in the laboratory?
2. To get familiar with the hazards involved in working in this laboratory.
3. To get familiar with the safety precautions that must be taken while working in this
laboratory.
4. To get familiar with the emergency exit plan of the laboratory in case of any emergency.
INTRODUCTION:
Layout:
Layout means the plan view of the laboratory about the relative position of equipments as per
detailed measurements of all the objects and dimensions.
List of Equipments:
1. Model of Typical Cross-Regulator
2. Sediment Transport System
3. Adjustable Bed Flow Channel
4. Tilting Glass Flume (25 feet with accessories)
5. Fluid Friction Apparatus
a) Hydraulic Bench
b) Venturimeter
6. Basic Hydrology System
7. Francis Reaction Turbine
8. Centrifugal Pump
a) Digital Energy Meter
9. Reciprocating Pump
10. Evaporation Pan
11. Model of Taunsa Barrage
12. Standard Rain Gauge (8 inch Diameter)
a) Standard Rain Gauge (4.5 inch Diameter)
13. Anemometer
14. Wind Vane Apparatus
15. Instrument Shelter
a) Dry and Wet Bulb Thermometers graduated in °C
b) Maximum & Minimum Thermometer graduated in °C
16. Thermometer graduated in °C and °F
17. Barometer
11. 11
HYDRAULICS ENGINEERING LABORATORY SAFETY GUIDELINES:
In Hydraulics Engineering laboratory, with an aim to prevent any unforeseen accidents during
conduct of lab experiments, Students must read these guidelines carefully and thoroughly
before attempting any laboratory activities. Following preventive measures and safe practices
shall be adopted:
GENERAL RULES:
1) Be mentally alert, always read the safety instructions and pay attention to safety signs.
2) Ask lab instructors if you are not sure about what to do.
3) Users must adhere to safety procedure of the laboratory.
4) Unauthorized persons are not permitted in the laboratory.
5) No running, jumping, horseplay, drinks, food and smoking are allowed in the
laboratory.
6) Always maintain awareness of the surrounding activities and walk in aisles to the
extent possible.
7) Maintain clean and orderly laboratories and work area. Discard immediately
unwanted items. Make sure all spilled liquids are wiped up immediately.
8) Students are responsible for maintaining work area in a safe and reasonable condition.
9) Be aware of the various experiment controls (start button, stop button, speed control)
for lab.
10) Be aware of the equipment harness when conducting experiments.
11) Do not leave equipments running unattended.
12) Any injuries should be reported immediately for proper care.
13) Working in this laboratory may require you to move or lift heavy items. Do not try to
be a hero! Be sure to follow appropriate lifting techniques. Ask for assistance
whenever you need it.
SPECIFIC RULES:
1. Dress Code
1) No high heel shoes what so ever. No loose shoelaces.
2) No rings, no bracelets, no necklaces, no watches or any other similar accessories that
may create risk when working with lab equipments.
3) No long coats, no long jackets or similar outfit that hangs out from the neck or shoulders
or waist. This sort of outfit may create the risk of stumbling over.
4) If long sleeves are worn, both sleeves should be rolled up prior to lab work.
2. Dry up wet floor
1) Floor should be kept dry at all times.
12. 12
2) Water on the floor must be swept away immediately.
3) Ensure all tripping and slipping hazards are removed.
4) While flumes are running, wet floor caution sign must be placed at entrances to the lab.
3. Keep water level within safety limit
1) Water level inside the flume/water related equipment must not rise beyond the safe
level.
2) Users to look out at all times in case water hose falls off or water overflows from
flume/water related equipment.
4. Gloves and rubber gloves
1) Wear safety gloves when handling metal sheet.
5. Power extension
1) All extension cords must be secured above ground level.
2) Ensure that electrical cords do not lie in water.
6. Equipment
1) Seek approval from staff before using any piece of machine/equipment.
2) Read and understand the safety precautions for the operation of machine/equipment
before use.
3) Secure all apparatus/equipment at all times.
4) Any fault (lighting/electrical), immediately inform the staff of lab.
5) Notify the staff if the experiment is to be continued or equipment is to be ‘ON’ after
office hours.
6) Use the appropriate tools at all times.
7) Do not touch anything that is not relevant with your experiment.
8) Put away tools and equipment in their proper place.
9) Only AUTHORIZED PERSONNEL may operate water pump.
10) Training is required for all equipment.
11) A status signboard must be displayed prominently near the experiment/equipment if it
is still running.
7. Damage of equipment/instrument
1) Report any damage of equipment/instrument to staff immediately.
2) Consider the safety for any person using the equipment or space after you.
8. Use of laboratory after office hours
1) No student is allowed to work ALONE in the laboratory after office hours.
13. 13
9. Firefighting equipment
1) Familiarize yourself with the location of fire extinguishers/fire hydrants, first‐ aid box.
10. Passage and Fire escape route
1) Know the fire escape route.
2) Do not obstruct the passage and the fire escape route.
11. Personal protective equipment:
1) Eye, ear, respiratory and hand protection to be used when there is a danger of injury.
2) Masks must be worn when there is dust or fumes in the air.
3) Wear the helmets to avoid any damage while performing experiment.
14. 14
EXPERIMENT # 1
TITLE:
To determine Chezy’s co-efficient (C) and Manning’s roughness co-efficient (n) in laboratory
flume
PURPOSE:
1. To determine the Chezy’s co-efficient “C” and Manning’s co-efficient “n”
2. To develop the relationship between “n” and “C”
3. To study the variation of “n” and “C” as the function of velocity
4. To develop uniform steady flow in laboratory flume
EQUIPMENT:
1. Glass sided Tilting flume
2. Slope adjusting arrangements (Built-in with Tilting flume)
3. Water pump (Built-in with Tilting flume)
4. Differential manometer (Built-in with Tilting flume)
5. Hook gauge (Built-in with Tilting flume)
INTRODUCTION:
Flow:
The moving water either due to gravity or pressure is said to be in flow.
Types of Flow:
1) With respect to Medium:
There are two types of flow w.r.t. medium. They are;
a) Pressure Flow/ Pipe Flow:
It is the type of flow which takes place due to pressure force provided that the internal diameter
of the pipe is fully wet.” e.g. flow in water supply pipes.
b) Open Channel Flow:
This flow takes place under the force of gravity and is open to the atmospheric pressure.
2) With respect to State of Flow:
There are three types of flow w.r.t. state of flow. They are;
a) Steady Flow:
If flow parameters remain constant w.r.t. time at any x-section, then it is steady flow.”
i.e.
𝝏
𝝏𝒕
= 𝟎 (1.1)
b) Unsteady Flow:
If flow parameters do not remain constant w.r.t. time at any x-section, then it is unsteady flow.”
i.e.
𝝏
𝝏𝒕
≠ 𝟎 (1.2)
15. 15
c) Uniform flow:
If the flow is having constant flow parameters w.r.t. distance, then it is uniform flow
i.e.
𝝏
𝝏𝒙
= 𝟎 (1.3)
Note: If we combine steady and uniform flow then we get steady uniform flow.
Or if the flow parameters do not change w.r.t time as well as distance then it will be called as
uniform steady flow.
Hydraulic Radius:
It is the ratio of flow area to the wetted perimeter.” It is used to measure efficiency of pipe or
channel.
Assumptions:
Fluid is incompressible.
Fluid is ideal i.e. no resistance between layers.
Flow is uniform steady.
Chezy’s Formula:
Chezy’s equation is valid over the wide range of flows, like turbulent or uniform flows. This
equation is more diverse in use. It is a function of inertial, viscous force (flow forces) and the
relative roughness of the channel bed.
It is given as;
V = C √𝑹𝑺 (1.4)
Where; V = average velocity, C = Chezy’s constant
R = hydraulic radius, S = slope of bed of the channel.
Manning’s Formula:
Manning’s equation is an empirical equation that applies to an open channel flow. It is the
function of channel velocity, flow area and the channel slope. The Manning’s co-efficient
represents the roughness and the friction applied to the flow by the channel bed.
It is given as;
𝑽 =
𝟏
𝒏
𝑹
𝟐
𝟑 𝑺
𝟏
𝟐 (1.5)
Where;
R = hydraulic radius,
S = slope of the bed of the channel
n = Manning’s roughness co-efficient.
Relationship between “n” and “C”:
From Manning’s equation:
16. 16
𝑽 =
𝟏
𝒏
𝑹
𝟐
𝟑 𝑺
𝟏
𝟐
𝑽 =
𝟏
𝒏
𝑹
𝟏
𝟔 𝑹
𝟏
𝟐 𝑺
𝟏
𝟐
𝑽 =
𝟏
𝒏
𝑹
𝟏
𝟔 √𝑹𝑺 (1.6)
From Chezy’s Equation
V = C √𝑹𝑺 (1.4)
Comparing Eq. 1.4 & 1.6
C √𝑹𝑺 =
𝟏
𝒏
𝑹
𝟏
𝟔 √𝑹𝑺
C =
𝟏
𝐧
𝐑
𝟏
𝟔 (1.7)
PROCEDURE:
1) Allow the water to flow with certain depth in the flume.
2) Note down the readings of the differential manometer and see the corresponding
discharge from the discharge charts.
3) Take the depth at differing points and note it.
4) Calculate the area of flowing water.
5) Calculate the hydraulic radius and velocity by the formula, 𝑽 =
𝑸
𝑨
6) Calculate the co-efficient “C” and “n” accordingly.
HAZARDS INVOLVED IN OPERATING TILTING FLUME:
1) Danger of electric shock, while opening the switch cabinet and in contact with the
electrical equipment.
2) Danger of injury from falling objects while working underneath the flow channel while
it is in operation.
3) One of the supports may slip under load. While adjusting the inclination of flume
beyond the specified range.
4) Risk of spillover while filling the flume.
5) Leaks may allow large amounts of water to escape unnoticed.
SAFETY PRECAUTIONS FOR TILTING FLUME:
1) Safety shoes, safety helmet and gloves must be worn while operating the
equipment.
2) Never adjust the slope beyond the specified range. One of the supports may slip under
load.
3) Protect the switch cabinet against water incursion.
4) Fill the flume up to certain limits. There may be risk of spillover.
5) Never operate the flume without the supervision of lab instructor.
17. 17
OBSERVATIONS AND CALCULATIONS:
Flume width = B = 300mm
Slope = S =
Sr.
No.
Discharge Depth of flow
Area of
flow
Wetted
perimeter
Flow
velocity
Hydraulic
radius
C n
Q y B*y P = B + 2y V = Q/A R = A/P ---- ----
m3/sec m m2 M m/sec M ---- ----
19. 19
EXPERIMENT # 2
TITLE:
To experimentally investigate the relationship between specific energy (E) and depth of flow
(y)
PURPOSE:
1. To study the variation of specific energy as a function of depth of flow for a given
discharge
2. To study the variation of specific energy as a function of depth of flow when discharge
per unit width changes.
EQUIPMENT:
1. Glass sided Tilting flume
2. Hook gauge
INTRODUCTION:
Flume:
A channel above the ground mostly used for study purpose is called flume.
Figure 2.1: Glass sided Tilting Flume
Specific Energy:
The total energy per unit weight or flow rate at a particular cross section with respect to the
channel bed is known as specific energy.”
It is given by; 𝑬 = 𝒚 +
𝑽𝟐
𝟐𝒈
(2.1)
Units of specific energy are meters (m).
20. 20
Figure 2.2: Hydraulic and Energy Grade lines
Open Channel flow:
Flow taking place due to component of gravity along the channel bed slope is Open channel
flow.
Uniform flow:
It is the flow in which velocity of flow, depth, slope of bed and x-sec of channel remain constant
w.r.t. length.” Specific energy in case of uniform flow remains constant.
Specific energy curve or E-Y Diagram:
It is the graphical representation of variation of specific energy as a function of depth of flow.
In this curve we draw depth of flow on y-axis and specific energy on x-axis at a constant
discharge.
Purpose of E-Y diagram is to know that at what depth flow is of what type.
As 𝑬 = 𝒚 +
𝑽𝟐
𝟐𝒈
so 𝑬 = 𝒚 +
𝑸𝟐
𝟐𝒈𝑨𝟐
And 𝑬 = 𝒚 +
𝑸𝟐
𝟐𝒈𝒚𝟐𝒃²
𝑬 = 𝒚 +
𝑸𝟐
𝟐𝒈𝒃²
(
𝟏
𝒚𝟐)
𝑬 = 𝒚 +
𝒒𝟐
𝟐𝒈
(
𝟏
𝒚𝟐)
E - y =
𝒄𝒐𝒏𝒔𝒕𝒂𝒏𝒕
𝒚𝟐
(E – y) y² = constant
21. 21
Figure 2.3: Specific Energy versus Flow depth diagram
Minimum Specific Energy:
Energy corresponding to the critical depth is minimum specific energy.
As we know that 𝑬 = 𝒚 +
𝒒𝟐
𝟐𝒈𝒚𝟐
So, 𝑬𝒎𝒊𝒏 = 𝒚𝒄 +
𝒒𝟐
𝟐𝒈𝒚 𝟐
𝒄
We know that 𝒚𝒄 = [
𝒒𝟐
𝒈
]
𝟏
𝟑
so 𝒒𝟐
= 𝒈𝒚𝟑
𝒄
Put in equation of Emin we get; 𝑬𝒎𝒊𝒏 =
𝟑
𝟐
𝒚𝒄 (2.2)
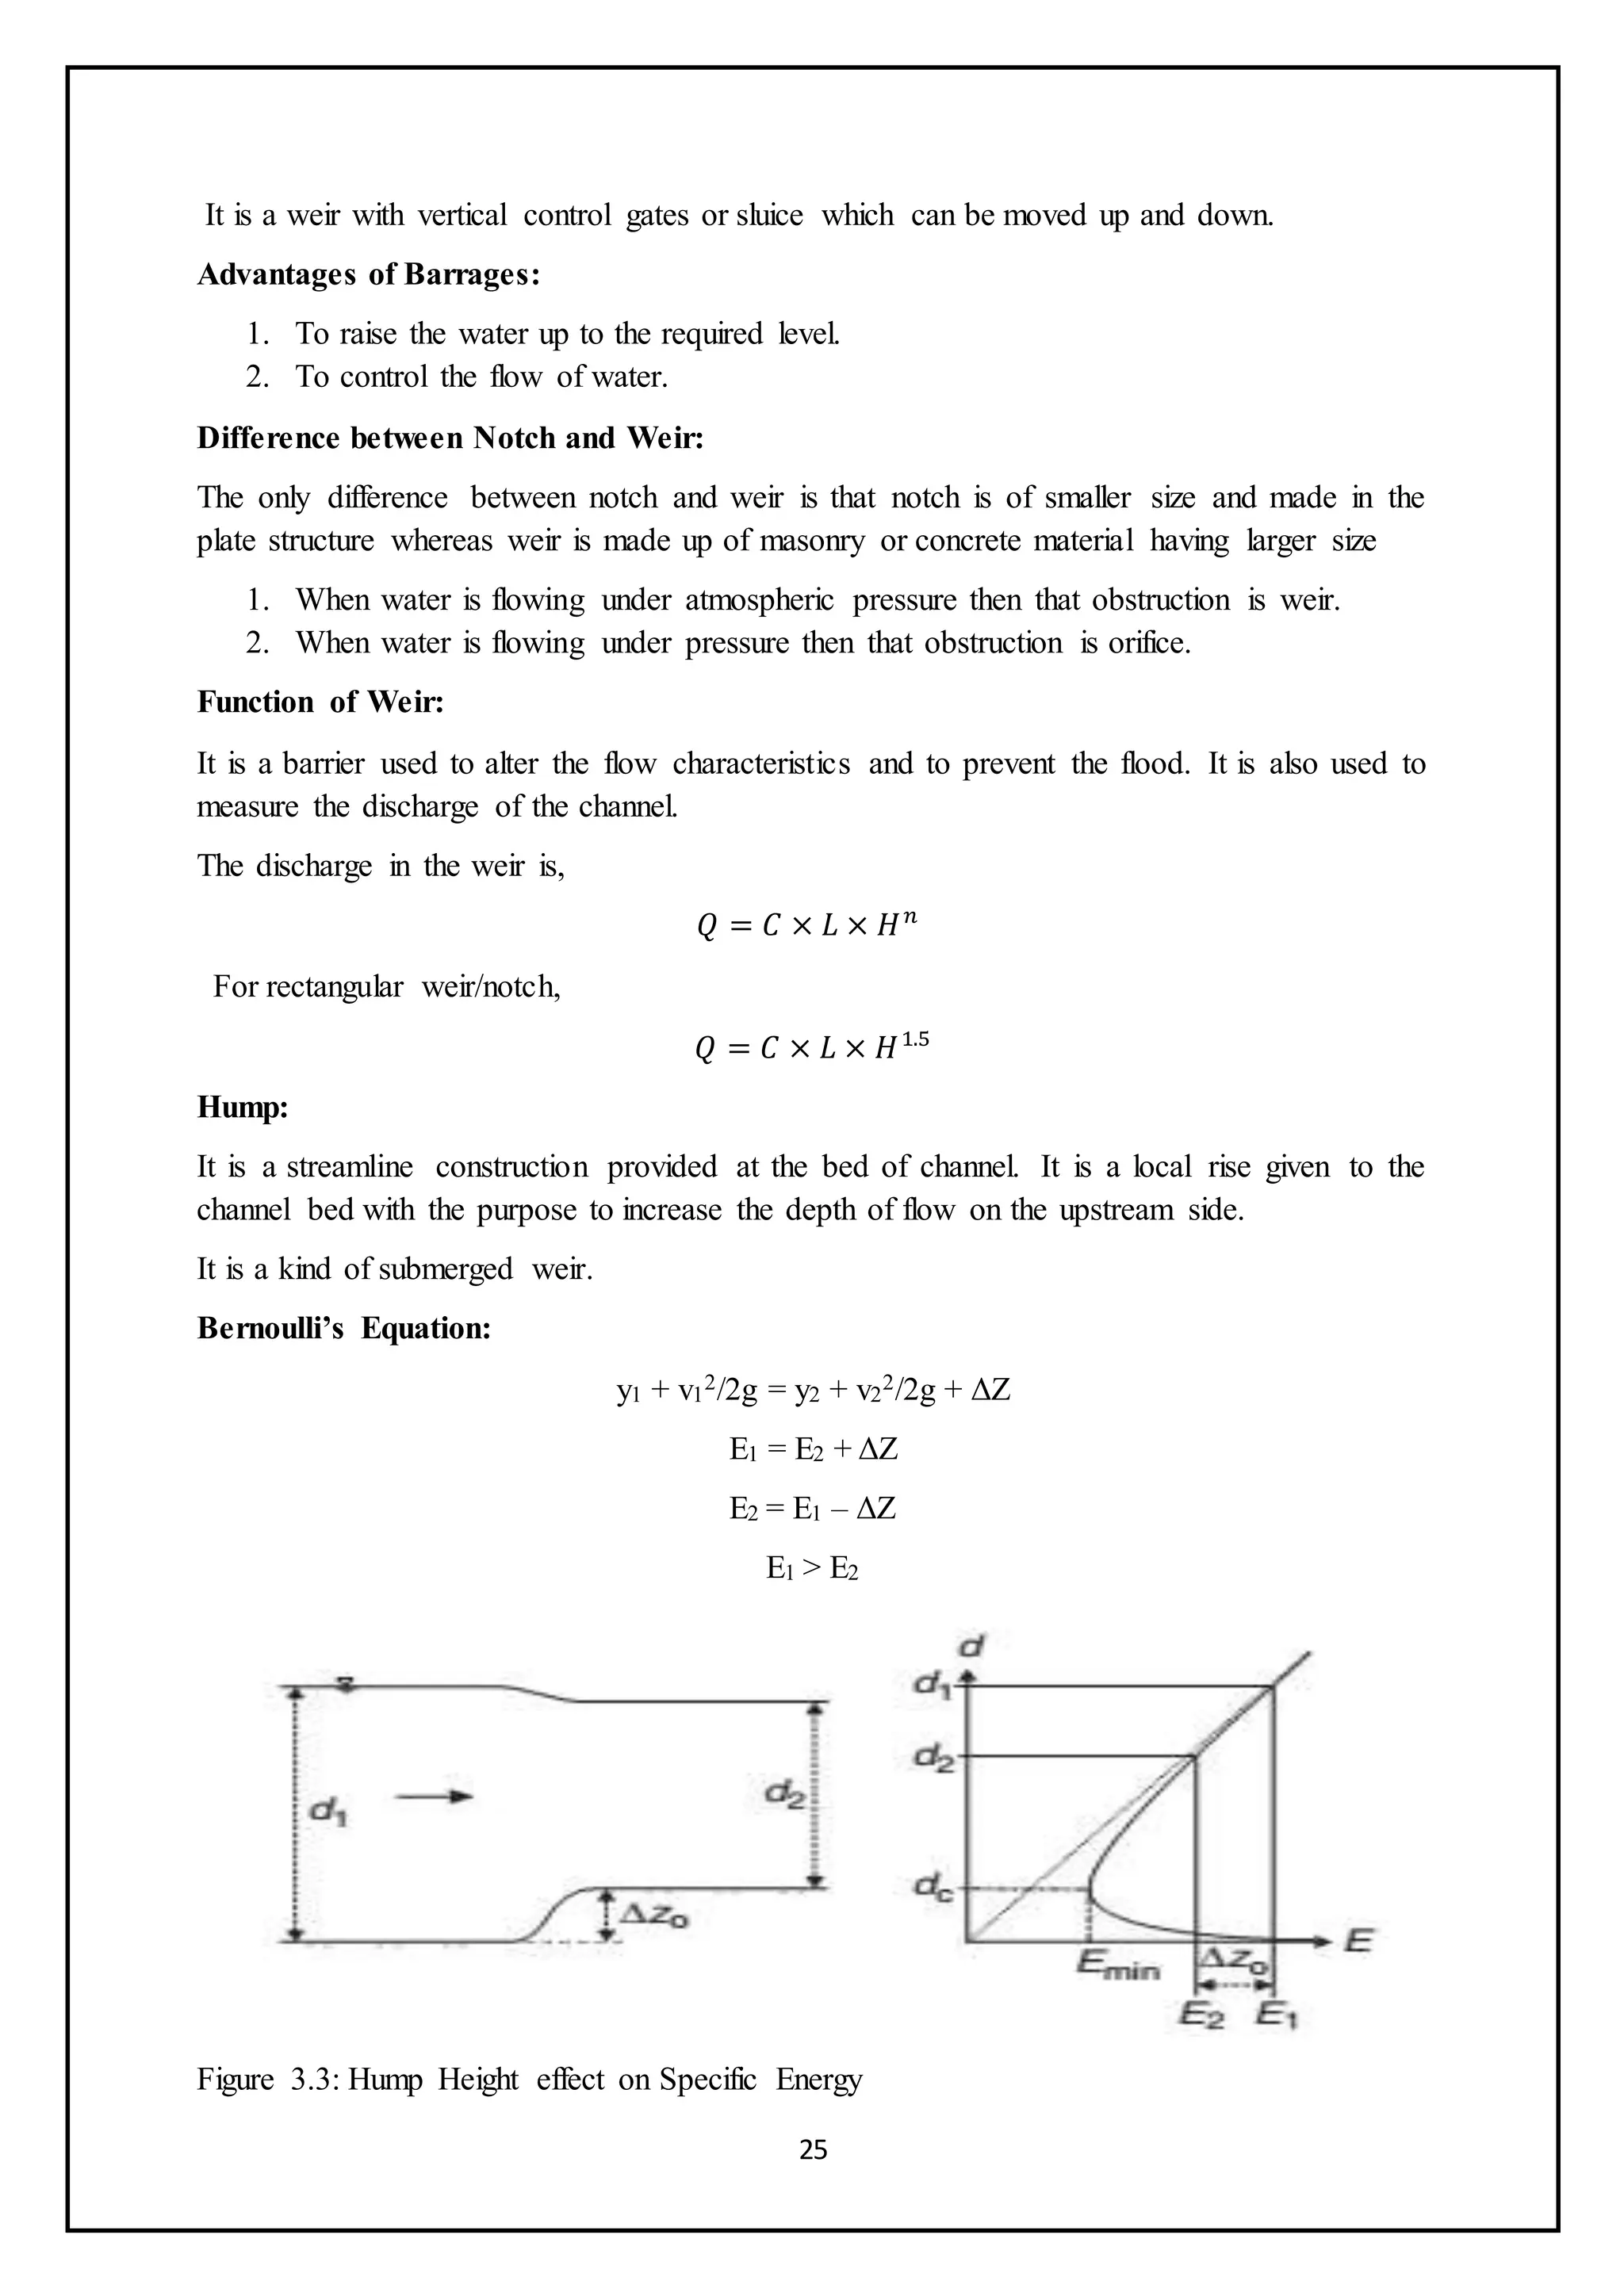
Critical Depth Of Flow: (yc)
It is the depth of flow corresponding to the minimum specific energy at constant discharge.” It
is given as;
𝑦𝑐 = [
𝑞2
𝑔
]
1
3
(2.3)
By increasing Q, yc will increase and different E ~ y diagrams would result for different
discharge values.
Critical Velocity: (Vc)
The velocity corresponding to critical depth of flow in an open channel is called critical
velocity.”
It is given as;
Vc = √𝒈𝒚𝒄 (2.4)
22. 22
Critical Flow:
It is the flow corresponding to the critical depth, when specific energy is minimum for a given
discharge.
Super Critical Flow:
The flow for which depth is less than the critical depth is termed as super critical flow.
Sub Critical Flow:
The flow with depth more than critical depth is called as sub critical flow.
Froude’s Number:
It is an index which is a ratio of inertial to the gravitational forces. It tells us about the state of
flow. “It is used to differentiate flow conditions and is given as;
𝐹𝑁 =
𝑉
√𝑔𝑦
(2.5)
If, FN < 1 Subcritical flow
FN = 1 Critical flow
FN > 1 Supercritical flow (Flow with larger velocity and smaller depth)
Alternate Depths:
For any value of specific energy other than the critical, there exists two depths; one
corresponding to super critical flow and the other corresponding to sub critical flow. These two
depths at a particular specific energy are called as alternate depths of flow.
PROCEDURE:
1. Adjust the glass sided Tilting flume accordingly and make it ready for experiment.
2. Adjust the slope of the flume and setup a flow in the flume.
3. Adjust the discharge and take the discharge value from the chart.
4. Take depth at different places along the flume and take the mean value for the depth.
5. Repeat the experiment after changing the slope of the flume.
HAZARDS INVOLVED IN OPERATING TILTING FLUME:
1. Danger of electric shock, while opening the switch cabinet and in contact with the
electrical equipment.
2. Danger of injury from falling objects while working underneath the flow channel while
it is in operation.
3. One of the supports may slip under load. While adjusting the inclination of flume
beyond the specified range.
4. Risk of spillover while filling the flume.
5. Leaks may allow large amounts of water to escape unnoticed.
SAFETY PRECAUTIONS FOR TILTING FLUME:
1. Safety shoes, safety helmet and gloves must be worn while operating the
equipment.
23. 23
2. Never adjust the slope beyond the specified range. One of the supports may slip under
load.
3. Protect the switch cabinet against water incursion.
4. Fill the flume up to certain limits. There may be risk of spillover.
5. Never operate the flume without the supervision of lab instructor.
OBSERVATIONS AND CALCULATIONS:
Sr.
No.
Slope Depth of flow (m) Discharge q = Q/b
Area
of flow
Velocity of
flow
Specific
Energy E =y
+(v²/2g)
S y1 y2 y3 y Q (mᵌ/s) (m²/s) (m²) (m/s) (m)
for Discharge Q 1
for Discharge Q 2
for Discharge Q 3
24. 24
EXPERIMENT # 3
TITLE:
To study the flow characteristics over a hump/weir and draw the water surface profile over the
hump
PURPOSE:
1. To study the variation in the flow in the laboratory glass sided Tilting Flume by
introducing various types of weirs in it.
2. To draw the water surface profile over the hump.
EQUIPMENT:
1. Glass sided Tilting flume
2. Hook gauge
3. Broad crested sharp corner weir
4. Broad crested rounded corner weir
INTRODUCTION:
Weir or Hump:
It is an obstruction or structure which is constructed across a river or stream to the level of
water on the upstream side used to dam up a stream or a river over which water flows.
Figure 3.1: Different types of weirs in execution models
Sharp corner weir Round corner weir
Figure 3.2: Sharp and Round Cornered Weirs
Barrage:
Q 1 < Q 2 < Q 3
25. 25
It is a weir with vertical control gates or sluice which can be moved up and down.
Advantages of Barrages:
1. To raise the water up to the required level.
2. To control the flow of water.
Difference between Notch and Weir:
The only difference between notch and weir is that notch is of smaller size and made in the
plate structure whereas weir is made up of masonry or concrete material having larger size
1. When water is flowing under atmospheric pressure then that obstruction is weir.
2. When water is flowing under pressure then that obstruction is orifice.
Function of Weir:
It is a barrier used to alter the flow characteristics and to prevent the flood. It is also used to
measure the discharge of the channel.
The discharge in the weir is,
𝑄 = 𝐶 × 𝐿 × 𝐻𝑛
For rectangular weir/notch,
𝑄 = 𝐶 × 𝐿 × 𝐻1.5
Hump:
It is a streamline construction provided at the bed of channel. It is a local rise given to the
channel bed with the purpose to increase the depth of flow on the upstream side.
It is a kind of submerged weir.
Bernoulli’s Equation:
y1 + v1
2/2g = y2 + v2
2/2g + ΔZ
E1 = E2 + ΔZ
E2 = E1 – ΔZ
E1 > E2
Figure 3.3: Hump Height effect on Specific Energy
26. 26
From specific energy diagram, we can design the height of hump (ΔZ) easily.
Maximum height = ΔZmax. = Zc = E1 – Ec
When the fluid is flowing over a hump, the behavior of free water surface is sharply different
according to weather. The approach of flow is sub-critical or super-critical. The height of hump
can change the character of results.
If the approach of flow is sub-critical then the water level over the hump will reduce and vice
versa. For super-critical approach flow, if the hump height reaches ΔZmax .which isE1 – Ec, the
flow over the crest will exactly be the critical flow. If the hump height is more than ΔZmax.
Then it will cause damming action.
Critical Hump Height:
It is the minimum hump height that causes the critical depth (flow) over the hump.
Y2 = Yc ΔZ = Zc
Effects on Depth of Flow:
1. Depth of flow decreases with increase hump height over the hump up to a critical value
(yc) then it becomes constant with further increase in hump height.
2. Specific energy decreases over the hump due to decrease in depth of flow for same
discharge and slope, which causes depression of water over the hump.
Damming Action:
Where hump height is more than the critical hump height, there is a sudden increase in water
depth on upstream side. This phenomenon is called damming action.
PROCEDURE:
1. Adjust the glass sided Tilting flume at required slope and check if there is any problem
in arrangement or anything residual inside the flume causing obstruction in flow.
2. Setup a specific discharge in the flume.
3. Note down the manometer readings on u/s side on weir and on d/s side of the weir.
4. Compare these values with yc to write down the flow characteristics.
HAZARDS INVOLVED IN OPERATING TILTING FLUME:
1. Danger of electric shock, while opening the switch cabinet and in contact with the
electrical equipment.
2. Danger of injury from falling objects while working underneath the flow channel while
it is in operation.
3. One of the supports may slip under load. While adjusting the inclination of flume
beyond the specified range.
4. Risk of spillover while filling the flume.
5. Leaks may allow large amounts of water to escape unnoticed.
SAFETY PRECAUTIONS FOR TILTING FLUME:
1. Safety shoes, safety helmet and gloves must be worn while operating the
equipment.
27. 27
2. Never adjust the slope beyond the specified range. One of the supports may slip under
load.
3. Protect the switch cabinet against water incursion.
4. Fill the flume up to certain limits. There may be risk of spillover.
5. Never operate the flume without the supervision of lab instructor.
OBSERVATIONS AND CALCULATIONS
Type of weir Width (mm) Height (mm)
a) Round cornered 300 120
b) Sharp cornered 300 60
Slope = S = 1/500
Width of flume = B = 300 mm
Sr.
No.
Weir
type
Q Depth of Flow (mm) q = Q/b yc Flow type
mᵌ/sec U/S Over the Hump D/S m²/sec mm U/S
Over
hump
D/S
y1 y2 y3 y y1 y2 y3 y y1 y2 y3 y
28. 28
EXPERIMENT # 4
TITLE:
To study the flow characteristics of hydraulic jump development in tilting flume in the
laboratory
PURPOSE:
To achieve physically, the development of hydraulic jump in laboratory flume.
EQUIPMENT:
1. Glass sided Tilting flume
2. Hook gauge
INTRODUCTION:
Hydraulic Jump:
It is formed due to transformation of supercritical flow to subcritical flow.
Figure 4.1: Hydraulic jump simulatin in flume
Applications of Hydraulic Jump:
1. To dissipate the energy of water flowing over the hydraulic structures.
2. To avoid scouring d/s of hydraulic structure.
3. To recover head or raise the water level d/s of a hydraulic structure and thus to maintain
the high water in the channel for irrigation or other water distribution purposes.
4. To increase the weight of apron and thus to reduce the uplift pressure, under the
structure by raising water depth on the apron.
5. To mix chemicals used for water filtration etc.
Importance of Hydraulic Jump:
1. Location of hydraulic jump is very important on d/s side. For ideal situation d2 < yn2
then back water effect will be produced and jump will be submerged.
2. If d2 > yn2 then water will move forward more efficiently.
3. By decreasing d2 more hydraulic energy is dissipated, where d2 is depth required to
develop the jump.
29. 29
PROCEDURE:
1. Adjust the S-6 Tilting flume at required slope and check if there is any problem in
arrangement or anything residual inside the flume causing obstruction in flow.
2. Setup a specific discharge in the flume.
3. Note down the depth of the water surface before, after and at the hydraulic jump.
4. Repeat the above procedure with various values of discharge and calculate the results.
HAZARDS INVOLVED IN OPERATING TILTING FLUME:
1. Danger of electric shock, while opening the switch cabinet and in contact with the
electrical equipment.
2. Danger of injury from falling objects while working underneath the flow channel while
it is in operation.
3. One of the supports may slip under load. While adjusting the inclination of flume
beyond the specified range.
4. Risk of spillover while filling the flume.
5. Leaks may allow large amounts of water to escape unnoticed.
SAFETY PRECAUTIONS FOR TILTING FLUME:
1. Safety shoes, safety helmet and gloves must be worn while operating the
equipment.
2. Never adjust the slope beyond the specified range. One of the supports may slip under
load.
3. Protect the switch cabinet against water incursion.
4. Fill the flume up to certain limits. There may be risk of spillover.
OBSERVATIONS AND CALCULATIONS
Sr.
No.
Q q = Q/0.3 y0 y1 y2 yc x0 x1 x2
m3/sec m2/sec m m m m m m m
30. 30
DESIGN EXERCISE # 1
TITLE:
1) Plot Velocity – Variation and Discharge –Variation curves with respect to depth of flow
for a channel of circular section in dimensionless form
2) Determine the conditions of flow for maximum Velocity and maximum Discharge both
graphically and analytically
SOLUTION:
1)
Conduits running partially full are considered as open channels because the pressure in such
conduits is atmospheric.
In circular cross-section channels, velocity and discharge varies when the flow depth, y is
changed. Sewers are the most common examples of open channels. More the velocity, more
will be the suspended load.
SKETCH:
Considering Chezy’s formula,
𝑉 = 𝐶√𝑅𝑆
= 𝐶√𝑆 √
𝐴
𝑃
Taking C and S as Constant, 𝑉 ∝ √
𝐴
𝑃
31. 31
Velocity will be maximum when
𝐴
𝑃
is maximum.
Now, wetted perimeter, P = Length of the arc ADB
= 2rθ, where θ is in radians.
Flow area, A = Area of the sector AOBD – Area of the Triangle AOB
=
𝜋𝑟2
2𝜋
. 2𝜃 −
1
2
𝑟 𝑐𝑜𝑠𝜃. 2 𝑟 𝑠𝑖𝑛𝜃
= 𝑟2
𝜃 −
𝑟2
2
𝑠𝑖𝑛2𝜃 = 𝑟2
( 𝜃 −
𝑠𝑖𝑛2𝜃
2
)
V = C√𝑆 √𝑟2 (𝜃−
𝑠𝑖𝑛2𝜃
2
)
2𝑟𝜃
When pipe is running full, 𝜃 = 𝜋 𝑟𝑎𝑑
Velocity when the pipe runs full, 𝑉
𝑓 = 𝐶√𝑆 √𝑟2 ( 𝜋−
𝑠𝑖𝑛2𝜋
2
2𝜋𝑟
Or 𝑉
𝑓 = 𝐶√𝑆 √
𝑟
2
𝑉
𝑉𝑓
=
𝐶√𝑆 √
𝑟2(𝜃−
𝑠𝑖𝑛2𝜃
2
)
2𝑟𝜃
𝐶 √𝑆 √
𝑟
2
= √𝜃−
𝑠𝑖𝑛2𝜃
2
𝜃
Or
𝑉
𝑉𝑓
= √1 −
𝑠𝑖𝑛2𝜃
2𝜃
(5.1)
𝑄
𝑄𝑓
=
𝐴𝑉
𝐴𝑓𝑉𝑓
=
𝐴
𝐴𝑓
𝑉
𝑉𝑓
=
𝑟2( 𝜃−
𝑠𝑖𝑛2𝜃
2
)
𝜋𝑟2
. √1 −
𝑠𝑖𝑛2𝜃
2𝜃
Or
𝑄
𝑄𝑓
= (𝜃 −
𝑠𝑖𝑛2𝜃
2
).
1
𝜋
(1 −
𝑠𝑖𝑛2𝜃
2𝜃
)
1
2 (5.2)
𝑦 = 𝑟 − 𝑟𝑐𝑜𝑠𝜃 = 𝑟(1 − 𝑐𝑜𝑠𝜃)
𝑦
𝑑
=
1−𝑐𝑜𝑠𝜃
2
(5.3)
𝜃 = cos−1
(1 −
2𝑦
𝑑
) (5.4)
θ may be obtained for different values of
𝑦
𝑑
, and hence
𝑉
𝑉𝑓
and
𝑄
𝑄𝑓
may be
obtained for different values of
𝑦
𝑑
.
33. 33
DESIGN EXERCISE # 2
TITLE:
A trapezoidal channel having base width ‘B’ m, side slopes ‘x: 1’ and Manning’s roughness
coefficient ‘n’ is carrying a discharge ‘Q’ (m3/sec) (shown in Figure 2.1). Take numerical
values for:
B =
𝐴𝑔𝑒 𝑎𝑠 𝑡𝑜𝑑𝑎𝑦, 𝑖𝑛 𝑑𝑎𝑦𝑠
600
𝑄 = 1.9𝐵
𝑛 =
𝐵
700
x = 1.5 for odd registration number
x = 2 for even registration number
It is provided with a hump of height P. Assuming the hump to be frictionless and using usual
notations, plot the following curves:
1) P~y1
2) P~y2
3) P~y3
Take yo = 1.6 yc
Figure 2.1: Cross-Section of Trapezoidal Channel and water surface profile
34. 34
INTRODUCTION:
Referring to Figure 2.1 and applying Bernoulli’s equation between section 1, 2 and 3
𝑦1 +
𝑉1
2
2𝑔
= 𝑃 + 𝑦2 +
𝑉2
2
2𝑔
= 𝑦3 +
𝑉3
2
2𝑔
𝑜𝑟 𝐸1 = 𝑃 + 𝐸2 = 𝐸3
𝑉1 =
𝑄
𝐴1
, 𝑉2 =
𝑄
𝐴2
, 𝑉3 =
𝑄
𝐴3
𝑜𝑟 𝑉1 =
𝑄
(𝐵 + 𝑥𝑦1)𝑦1
𝑉2 =
𝑄
(𝐵 + 𝑥𝑦2 )𝑦2
𝑉3 =
𝑄
(𝐵 + 𝑥𝑦3 )𝑦3
𝑦𝑜 = 1.6 𝑦𝑐
= 1.6 × 1.251 = 2.0016 𝑚
As 𝑦𝑜 > 𝑦𝑐 , the flow
𝑈
𝑆
ofthe hump is subcritical flow. Hence, water surface over
the hump will lower down.
𝐹𝑜𝑟 0 < 𝑃 ≤ 𝑃𝑐, y1 = yo , y1 ≥ y2 ≥ yc
𝑎𝑛𝑑 𝑦3 = 𝑦1
𝐹𝑜𝑟 𝑃 > 𝑃𝑐, y1 > yo > 𝑦𝑐 , y2 = yc
𝑎𝑛𝑑 𝑦3 < 𝑦𝑐 < 𝑦𝑜
Also, y1 and y3 are the alternate flow depths for each E or consequently P value.
Calculations:
35. 35
DESIGN EXERCISE # 3
TITLE:
To develop the relationship between Surface Area, Elevation and Capacity of Reservoir
PURPOSE:
For a given reservoir develop:
1. Elevation ~ Surface Area curve
2. Elevation ~ Capacity curve
3. Surface Area ~ Capacity curve
4. To develop co-relation between Elevation, Surface Area & Capacity of reservoir to check
the feasibility of project
INTRODUCTION:
Reservoir:
Area occupied by water body due to construction of a dam is called as reservoir. A reservoir is
created with impounding of the part of runoff from the catchment upstream by the construction
of a dam across the river or stream.
The total volume of water that can be stored in the reservoir is termed as capacity of reservoir.
This capacity can be obtained by Engineering survey or by the contour maps so that the site
selected may be fulfilling the capacity requirement.
Classification/ Types of Reservoir:
1. Storage reservoir
2. Flood control reservoir
3. Detention reservoir
4. Distribution reservoir
5. Multipurpose reservoir
6. Balancing reservoir
Storage Reservoir:
It is constructed to store the water in the rainy season and release it later when the river flow is
low.
Flood Control Reservoir:
It is constructed for the purpose of flood control to protect the area on the downstream side
from the damage due to flood.
Detention Reservoirs:
It stores the excess of water during flood and release it after the flood. It is similar to storage
reservoir but is provided with gated spillways and the sluice ways to permit the flexibility of
operation.
36. 36
In storage and flood control reservoir flow cannot be controlled. But in detention reservoir we
can control flow.
Distribution Reservoir:
It is a small storage reservoir to tide over the peak demand of water for domestic water supply
and agricultural purposes.
Multipurpose Reservoir:
These are constructed for more than single purposes i.e. storage for Irrigation as well as Power
generation. For example. Tarbela and Mangla dams.
Balancing Reservoir:
It is the reservoir on the downstream of the main reservoir for holding water released from the
main reservoir.
Capacity of Reservoir:
The capacity of reservoir is defined as the amount of water which the reservoir can store. This
storage can be used for fulfilling the demand of downstream users for various activities. E.g.
water supply, irrigation purpose, hydral power generation etc.
It is decided on the basis of surplus and deficit. A reference line has to be use which tells us
that water is available in excess or less in amount. Storage capacity depends upon the lesser
value of surplus or deficit because that amount of water we have to store for future. If we store
larger value which indicates the large amount of water and the sedimentation problem has to
be occurred.
The main purpose of constructing the reservoir is to store water for emergency purposes, as
well as user requirement.
Practical Importance of Surface Area (S), Elevation (E) and Capacity (C) curves:
1) S-E Curve:
This curve provides us information about the land that is required for the reservoir, people
evacuation, deforestation and other Environmental Factors.
It is used in site selection before construction and needs modification time to time as the
area corresponding to particular elevation changes (due to sedimentation and erosion)
which affects the capacity of reservoir.
2) E-C Curve:
These are important to calculate the storage capacity by selecting the elevation of water
and it is used to select the level of spillways and sluiceways.
Some frequently used levels which can be calculated from this curve are:
1. Maximum level
2. Operational level
3. Dead level
3) S-C Curve:
This curve provides us information about area that is under water.
37. 37
4) S-C-E Curve:
This curve is used to check the feasibility of the project.
Types of storage:
There are two main types of storages.
1) Live storage
2) Dead storage
Live storage:
The live storage reduces with the reduction in life time of the reservoir. This also depends upon
the sedimentation process. To accommodate this reduction in capacity we have to plan to
increase the height of dam step by step. This is known as integrated water management. Live
storage is the capacity of the reservoir above the dead storage level which constituted useable
portion of the total storage. Live storage assures the supply of water for certain period of time
to meet the demand for the irrigation, Hydal power generation or public water supply etc.
Generally it is said for good projects the water is available about 80% of the design for
irrigation purposes.
For Hydal power generation 90% water should be available for maximum time.
For domestic purposes the water should be available 100%.
Dead storage:
It is the minimum amount of the water that should remain in the reservoir all the time is called
as dead storage. The amount of water in any reservoir should not be lesser than the dead storage.
Flood storage:
This is the storage contains between maximum reservoir level and full reservoir level. It varies
with the spill way capacity for a given design flood.
PROCEDURE:
1. Note down the depth (height) of the dam.
2. From the cross section of the dam note the width of the catchments area which is in (m)
& from the longitudinal cross section we will get the length which is also in (m).
3. Get the area form the following data and take mean of the area, in this way we will get
the idea of the area which is our catchment area.
4. We will do this method for the entire height of the dam but in strips which we are going
to consider of 1 m.
5. We will get the volume which is to be accommodated in the dam and the total volume
is obtained just by cumulating the whole volume.
6. Now as we got the total volume but this volume is in (m3) so we have to convert this in
MILLION CUBIC METER (MCM).
1MCM = 106 m3
1MAF = 43560 x 106 ft3
38. 38
7. Plot the desired curves.
8. Note the behavior of the curves against different depths, capacity and area.
DESIGN WORK:
For the following set of data related to the longitudinal section and cross-section of a river at a
dam site
DEVELOP:
1) Elevation ~ Surface Area curve
2) Elevation ~ Capacity curve
3) Surface Area ~ Capacity curve
4) Elevation, Surface Area & Capacity curve
5) Calculate the elevation of water required in the reservoir to store 2 BCM water.
(ROLL # = R = 90)
`
Figure 3.1: Longitudinal – Section
H3 = 45
m
H4 =75
m
1:600
1:500
9.00 (km) 15.00(km) 22.50(km) 45.00 (km)
H1 = 90
m
H2 = 60
m
1:100
1:250
42. 42
DESIGN EXERCISE # 4
TITLE:
To estimate the live capacity of reservoir for various operational scenarios.
1) Estimate the live storage capacity of reservoir so that constant maximum supply can be
assured from this reservoir if the losses are assumed to be negligible.
2) Estimate the live storage capacity of reservoir to have constant maximum supply from
the reservoir if 20% of the inflows are lost due to seepage and evaporation.
3) Estimate the live storage capacity of reservoir if outflow R/2 𝑚3
𝑠𝑒𝑐
⁄ has to be released
from the reservoir from d/s usage, also plot mass curve and decide emptying and filling
program in each case.
PURPOSE:
1. For a given reservoir develop:
Estimation of capacity of reservoir for following operational conditions
Estimate the live storage capacity of reservoir so that constant maximum supply
can be assured from this reservoir if the losses are assumed to be negligible.
Estimate the live storage capacity of reservoir to have constant maximum supply
from the reservoir if 20% of the inflows are lost due to seepage and evaporation.
Estimate the live storage capacity of reservoir if outflow R/2 𝑚3
𝑠𝑒𝑐
⁄ has to be
released from the reservoir from d/s usage, also plot mass curve and decide
emptying and filling program in each case.
2. To plot the mass curve.
3. To propose suitable emptying & filling program for reservoir.
INTRODUCTION:
Reservoir:
Area occupied by water body due to construction of a dam is called as reservoir. A reservoir is
created with impounding of the part of runoff from the catchment upstream by the construction
of a dam across the river or stream.
The total volume of water that can be stored in the reservoir is termed as capacity of reservoir.
This capacity can be obtained by Engineering survey or by the contour maps so that the site
selected may be fulfilling the capacity requirement.
Capacity of Reservoir:
The capacity of reservoir is defined as the amount of water which the reservoir can store. This
storage can be used for fulfilling the demand of downstream users for various activities e.g.
water supply, irrigation purpose, Hydal power generation etc.
It is decided on the basis of surplus and deficit. A reference line has to be used which tells us
that water is available in excess or less in amount. Storage capacity depends upon the lesser
value of surplus or deficit because that amount of water we have to store for future. If we store
43. 43
larger value which indicates the large amount of water and the sedimentation problem has to
be occurred.
The main purpose of constructing the reservoir is to store water for emergency purposes, as
well as user requirement.
Reservoir Levels:
There are different reservoir levels:
Full ReservoirLevel:
Maximum level of water in normal operating condition is full reservoir level.
Maximum Water Level:
Highest level of water in reservoir when design flood discharge passes over the spillway.
Minimum Pool Level:
Minimum water level up to which we can withdraw water from reservoir under ordinary
conditions.
Dead Level:
Minimum possible water level up to which we can withdraw water under all type of conditions
(extra ordinary condition).
Reservoir Storage:
Dead Storage:
Water contained in the reservoir up to the dead level
OR
It is the volume of water held below the minimum pool level and it is equivalent to volume
of sediment expected to be deposited in the reservoir during the design life.
Figure 4.1: Different storage levels
Live/Useful Storage
It is the volume of water stored between the full reservoir level and minimum pool level. It
assures the supply of water for a specific period to meet the demand.
44. 44
Flood/Surcharge Storage
The volume of water stored between maximum water level and full reservoir level is called as
flood storage. It varies with the spillway capacity of dam for a given design flood.
Reservoir Yield
Volume of water which can be withdrawn from reservoir during a specified time period. (In
Pakistan it is 10 days daily yield, given by IRSA)
Primary Yield/Firm Yield/Safe Yield
Maximum quantity of water that can be supplied un-interruptedly from a reservoir in a
specified period of time during a critical dry year.
Secondary Yield
Quantity of water which is available during high flow in the river when yield is more than the
safe yield.
Average Yield
It is the arithmetic average of safe yield and secondary yield over a long period of time for a
reservoir.
DesignYield
It is the yield adopted in the design of reservoir and is usually considered on the
basis of urgency of water needs and the amount of risk involved.
HOW TO ESTIMATE LIVE STORAGE CAPACITY OF RESERVOIR
Live storage capacity of reservoir = Surplus or Deficit
(Whichever is smaller?)
UDO (Uniform Draw Off)
It is the amount withdrawn from the reservoir continuously at a constant rate throughout the
year for a prescribed time period. In Pakistan it is done on ten days basis by the IRSA
(Indus River Storage Authority)
It depends upon the downstream requirements like irrigation, hydropower requirement and the
water supply requirement. If surplus water remains in the reservoir then:
1) Chance of sedimentation
2) More Surface Area would be required.
3) More Elevation.
4) More compensation cost.
5) More deficit
So we’ll be requiring deficit water.
UDO = Total discharge in given time
Given time
Q
Time (t)
UDO
45. 45
How to find Capacity of Reservoir:
Live storage capacity of reservoir = Surplus or Deficit
(Whichever is smaller?)
Mass Curve:
It is the plot between cumulative inflows and demand (outflows) versus time.
This graph gives us:
1) Information about total amount of water available at particular time interval (t) in the
reservoir.
2) Amount of Surplus and Deficit can be calculated.
Mass Inflow Curve:
It is the graph plotted between cumulative inflows & time
Demand Flow Curve:
It is the graph plotted between cumulative outflows &time
Filling and Emptying Program:
Filling and emptying program is decided for a reservoir on the basis of surplus or deficit.
Q
Time (t)
UDO
Surplus
Deficit
Inflow discharge hydrograph
Time (t)
Demand curve
Mass inflow Curve
Cumulative
Discharge
(Q)
46. 46
During the period of surplus, the available water is in excess of requirement and the reservoir
is filled to fulfill the water deficiency during the dry months.
DESIGN DATA:
Time Inflows
4 Weekly Basis
4 60
8 75
12 85
16 125
20 190
24 225
28 245
32 285
36 235
40 205
44 135
48 80
52 65
FORMULAS TO BE USED IN CALCULATION:
Net Inflow = Inflow × (1 − losses(%))
Inflow yield =
Q × 28 × 24 × 3600
106
(MCM)
UDO =
Sum of inflow yield
No of data record
(MCM)
Surplus or Deficit = Inflow yield − UDO
PROCEDURE:
1) Time on the 4 weekly basis given along with the inflows.
2) Calculate the net inflows by considering the losses due to evaporation and seepage.
3) Calculate the inflow yield by the given formula in MCM.
4) Take the cumulative of the inflow yield column.
5) Calculate UDO by summing up the inflow yields divided by the no of data record.
6) Take the cumulative of the UDO column.
7) Calculate the difference between inflow yield and UDO.
𝒎𝟑 𝒔𝒆𝒄
⁄
47. 47
8) If the value is positive write it in surplus column and if negative write it in deficit in
MCM.
9) Plot the mass curve that is between cumulative inflow yield and cumulative UDO vs.
time.
10) Also draw the emptying and filling program.
CALCULATION TABLES
CASE A
Roll No = 183
Case 1
Time Inflows
Net
inflow
Inflow
Yield
Cumulative
Inflow Yield
UDO
Cumulative
UDO
Surplus Deficit
4 weekly
Basis
MCM MCM MCM MCM MCM MCM
𝒎𝟑 𝒔𝒆𝒄
⁄
𝒎𝟑 𝒔𝒆𝒄
⁄
48. 48
CASE B
Roll No. = 183
Case 2
Time Inflows
Net
inflow
Inflow Yield
Cumulative
inflow Yield
UDO
Cumulative
UDO
Surplus Deficit
4 weekly
Basis
MCM MCM MCM MCM MCM MCM
𝒎𝟑 𝒔𝒆𝒄
⁄
𝒎𝟑 𝒔𝒆𝒄
⁄
49. 49
CASE C
Roll No = 183
Case 3
Time Inflows Net inflow
Inflow
Yield
Cumulative
inflow Yield
Outflow
yield
Cumulative
UDO
Surplus Deficit
4 weekly
Basis
MCM MCM MCM MCM MCM MCM
𝒎𝟑 𝒔𝒆𝒄
⁄
𝒎𝟑 𝒔𝒆𝒄
⁄
51. 51
OPEN ENDED EXPERIMENT
Experiment # 1
TITLE:
To study the characteristics of flow over a different roughened beds
PURPOSE:
1) To determine the effect of a roughness of bed on the depth of water at different flow rates
2) To obtain appropriate coefficients to satisfy the Manning’s Formula, by using the
artificially roughened bed of different materials
EQUIPMENT:
1) Glass sided Tilting Flume
2) Hook Gauge
3) Artificially roughened beds of different materials
INTRODUCTION:
For uniform flow over a roughened beds of different materials, the Manning’s formula states
that:
𝑽 =
𝟏
𝒏
𝑹
𝟐
𝟑 𝑺
𝟏
𝟐
Where;
n = Coefficient of roughness (dimensionless)
R = Hydraulic mean radius (m)
= Flow area (A) / Wetted perimeter (P)
S = Slope of bed of the channel
The actual fluid velocity can be calculated as:
V = Q / A
Where;
V = mean fluid velocity (m/s)
Q = Volume flow rate (m3/s)
A = Area of flow (m2)
= Breadth of channel (b) x Depth of flow (y)
PROCEDURE:
1) Allow the water to flow with certain depth in the flume.
2) Note down the readings of the differential manometer and see the corresponding
discharge from the discharge charts.
3) Take the depth at differing points and note it.
52. 52
4) Calculate the area of flowing water.
5) Calculate the hydraulic radius and velocity by the formula 𝑽 =
𝑸
𝑨
6) Calculate the co-efficient “n” accordingly.
HAZARDS INVOLVED IN OPERATING TILTING FLUME:
1) Danger of electric shock, while opening the switch cabinet and in contact with the
electrical equipment.
2) Danger of injury from falling objects while working underneath the flow channel while
it is in operation.
3) One of the supports may slip under load. While adjusting the inclination of flume
beyond the specified range.
4) Risk of spillover while filling the flume.
5) Leaks may allow large amounts of water to escape unnoticed.
SAFETY PRECAUTIONS FOR TILTING FLUME:
1) Safety shoes, safety helmet and gloves should be worn while operating the
equipment.
2) Never adjust the slope beyond the specified range. One of the supports may slip under
load.
3) Protect the switch cabinet against water incursion.
4) Fill the flume up to certain limits. There may be risk of spillover.
5) Never operate the flume without the supervision of lab instructor.
OBSERVATIONS AND CALCULATIONS:
Flume width = B = 300mm
Slope = S = 1:500
Sr.
No.
Discharge Depth of flow
Area of
flow
Wetted
perimeter
Flow
velocity
Hydraulic
radius
n
Q y B x y P = B + 2y V = Q/A R = A/P ----
m3/sec m m2 m m/sec M ----
1
2
3
4
5
6
53. 53
CONCLUSIONS:
1. Does the value of n obtained correspond with the expected value?
2. Comment on the results.
54. 54
Experiment # 2
TITLE:
Measurement of Discharge beneath a Sluice Gate
PURPOSE:
1. To determine the relationship between upstream head and flow rate for water
flowing under a sluice gate.
2. To calculate the discharge coefficient and to observe the flow patterns obtained.
EQUIPMENT:
1. Adjustable sluice gate
2. Glass sided Tilting Flume
3. Point Gauge
INTRODUCTION:
Figure 2.1: Water surface profile and Sluice gate
For flow beneath a sharp edged sluice gate it can be shown that;
Therefore;
Where;
Q = Discharge (m3s-1)
Cd = Discharge coefficient (Dimensionless)
b = Breadth of weir (m)
yg= Height of sluice gate opening above bed (m)
y0 = Upstream depth of flow (m)
g = Gravitational constant (9.81ms-2)
55. 55
Where;
H0 = Total head upstream of weir (m)
H1 = Total head downstream of weir (m)
y1 = Downstream depth of flow (m)
V0 = Mean velocity upstream of weir (ms-1)
V1 = Mean velocity downstream of weir (ms-1)
EQUIPMENT SET UP:
1) Ensure the flume is level, with no stop logs installed at the discharge end of
the channel. Measure and record the actual breadth b (m) of the sluice gate.
2) Clamp the sluice gate assembly securely to the sides of the channel at a position
approximately mid-way along the flume with the sharp edge on the bottom of the
sluice gate facing upstream.
3) The datum for all measurements will be the bed of the flume. Carefully adjust
the hook gauge to coincide with the bed of the flume and record the datum
reading.
PROCEDURE:
1) Adjust the knob on top of the sluice gate to position the sharp edge of the
sluice gate 0.010m above the bed of the flume.
2) Gradually open the flow control valve and admit water until yo = 0.150m measured
using point gauge on the upstream side.
3) With yo at this height, calculate Q, Also measure y1 by using Point gauge on the
downstream side.
4) Raise the sluice gate in increments of 0.010m maintaining yo at the height of
0.150m by varying the flow of water. At each level of the sluice gate record the
values of Q and y1.
5) Repeat the procedure with a constant flow Q allowing yo to vary. Record the values
of y0 and y1.
OBSERVATIONS AND CALCULATIONS:
Flume width = B = 300mm
Slope = S = 1:500
Breadth of sluice gate = b = …………….. (m)
56. 56
Sr.
No.
yg yo y1 Q Cd H0 H1
m m m m3s-1 - m m
1
2
3
4
RESULTS:
1) Plot graphs of Q against yg for constant y0 and y0 against yg for constant Q to
show the characteristics of flow beneath the weir.
2) Plot graphs of Cd against Q for constant y0 and Cd against yg for constant Q to
show the changes in Cd of flow beneath the weir.
CONCLUSIONS:
1) Comment on effects of yo and Q on the discharge coefficient Cd for flow
underneath the gate. Which factor has the greatest effect?
2) Comments on any discrepancies between actual and expected results.
3) Compare the values obtained for H1 and H0 and comment on any differences.