The document provides solutions to chapter 3 problems from an engineering economy textbook. Some of the key problems solved include:
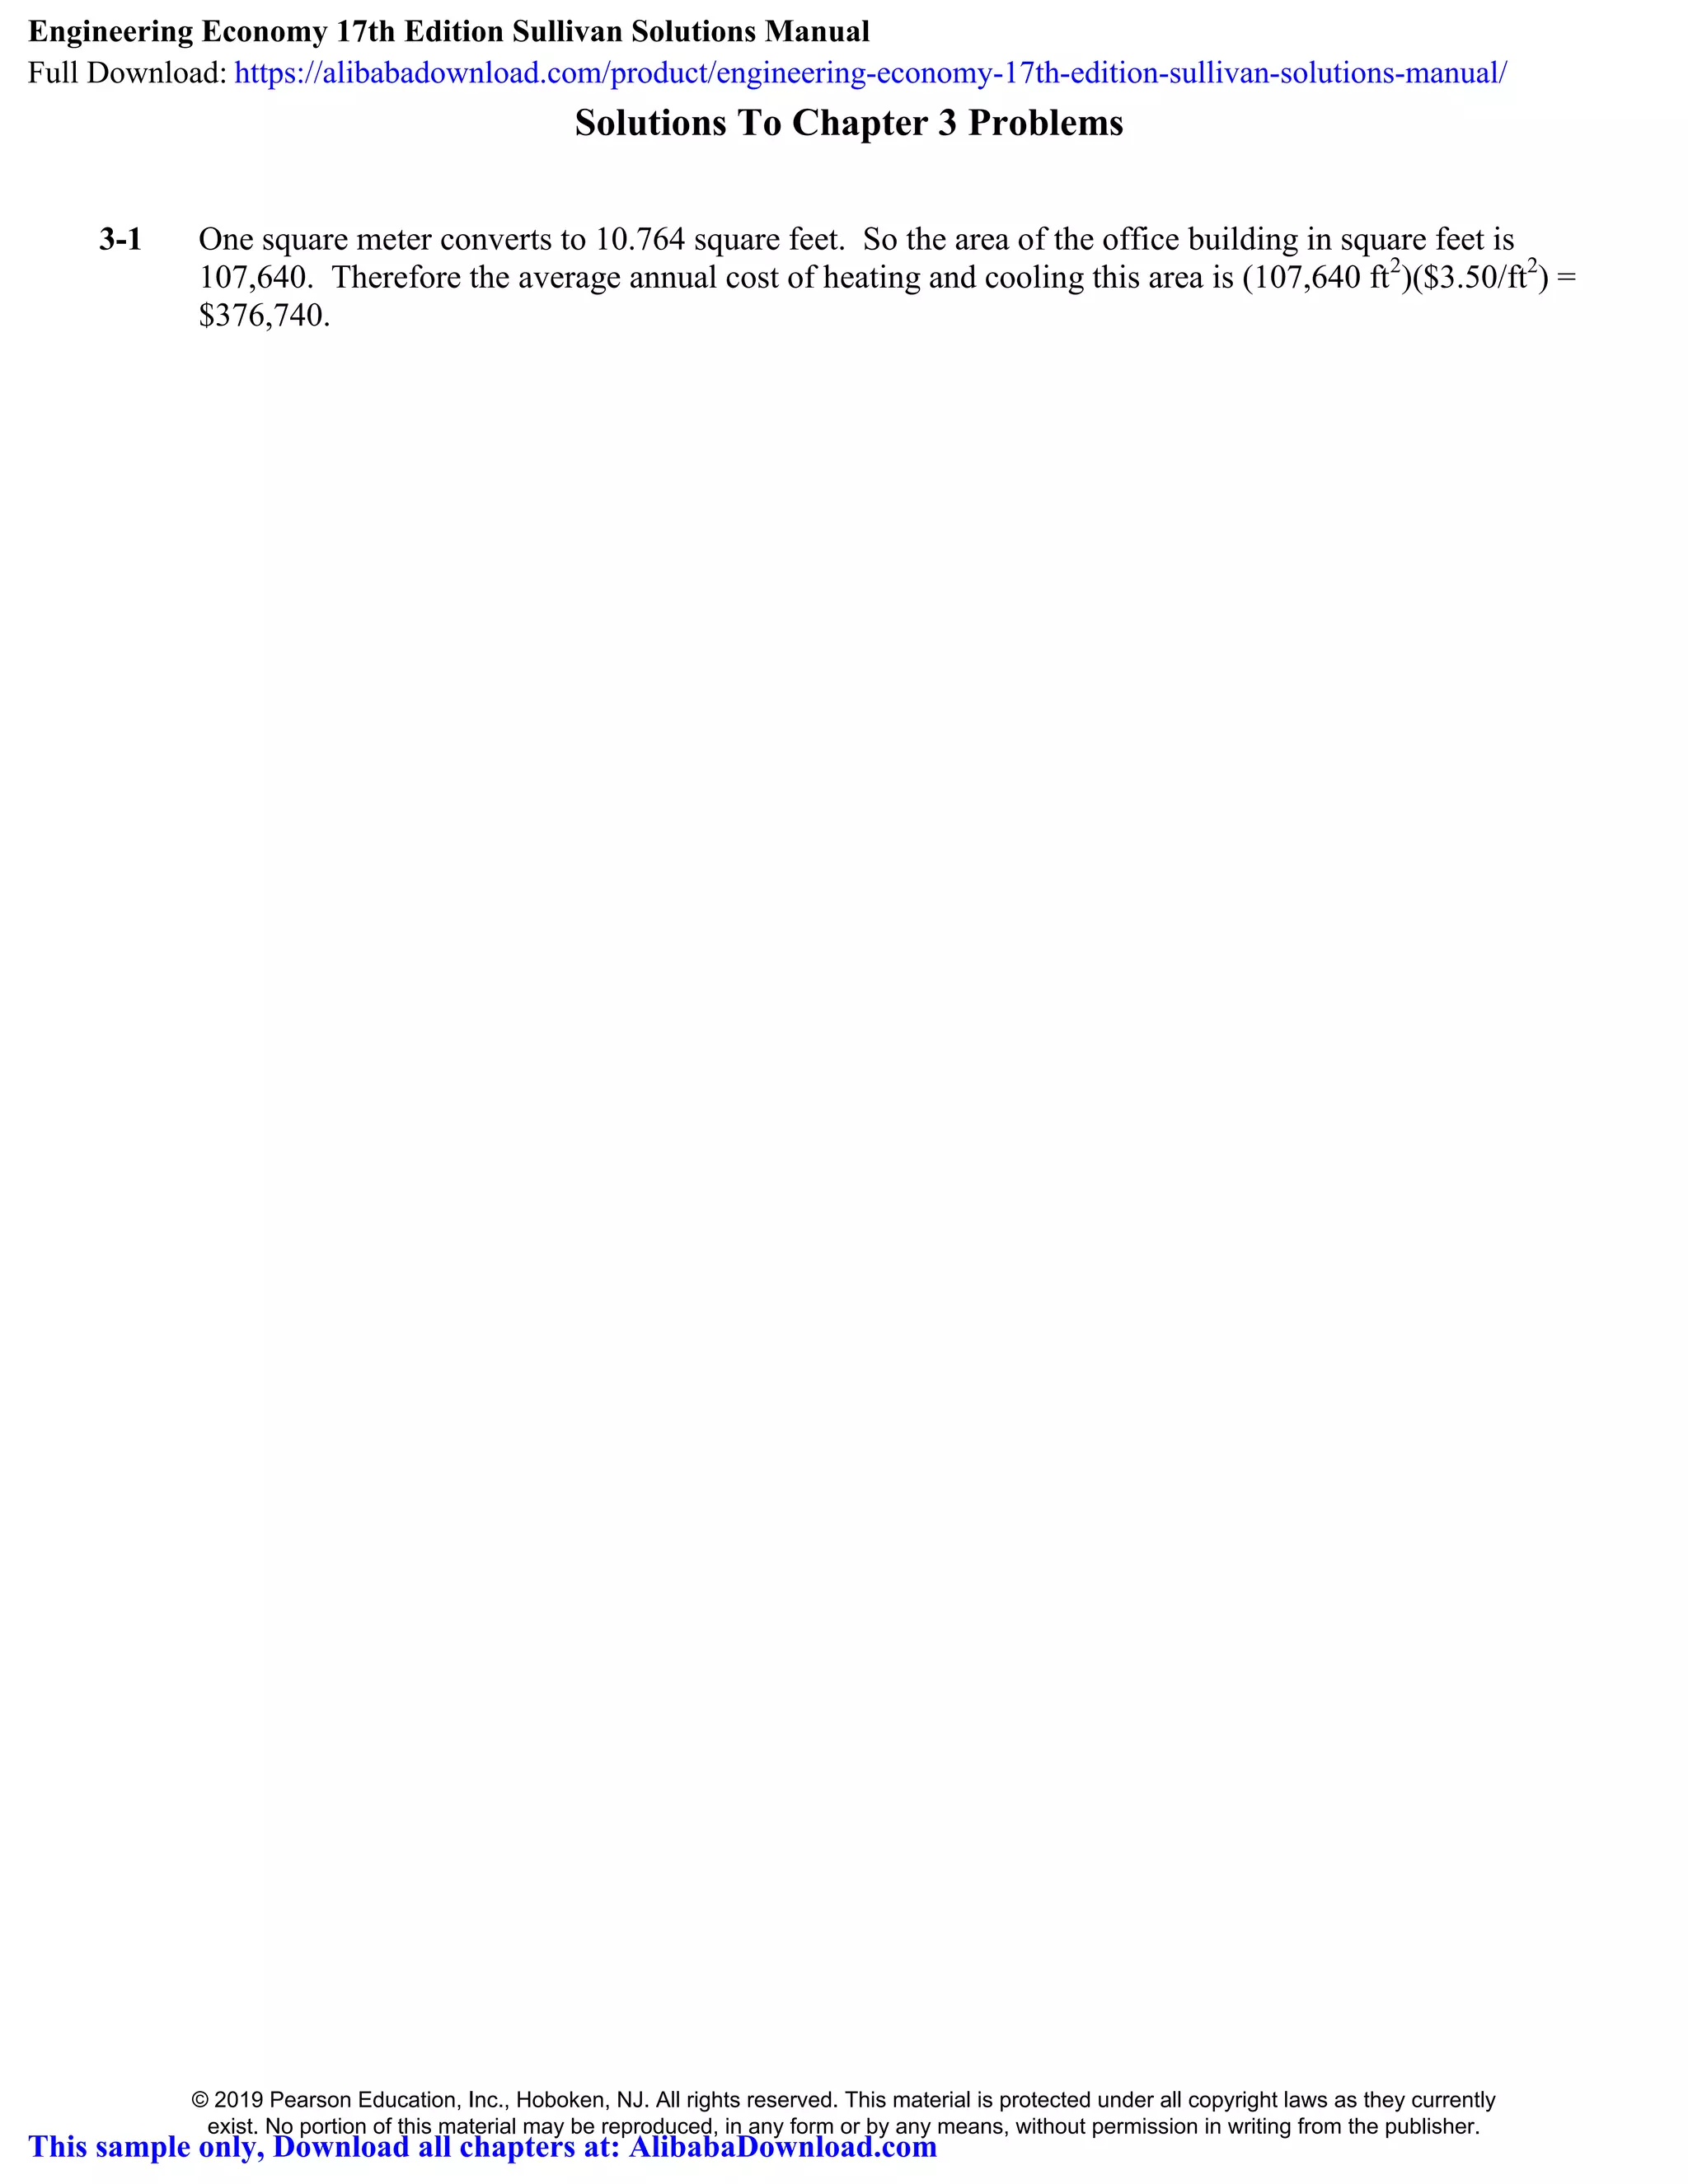
- Calculating the area and annual cost of heating/cooling an office building given dimensions and cost per square foot
- Estimating typical cost categories for owning a home over 10 years including capital investment, annual costs, repairs, fees, and sale of the home
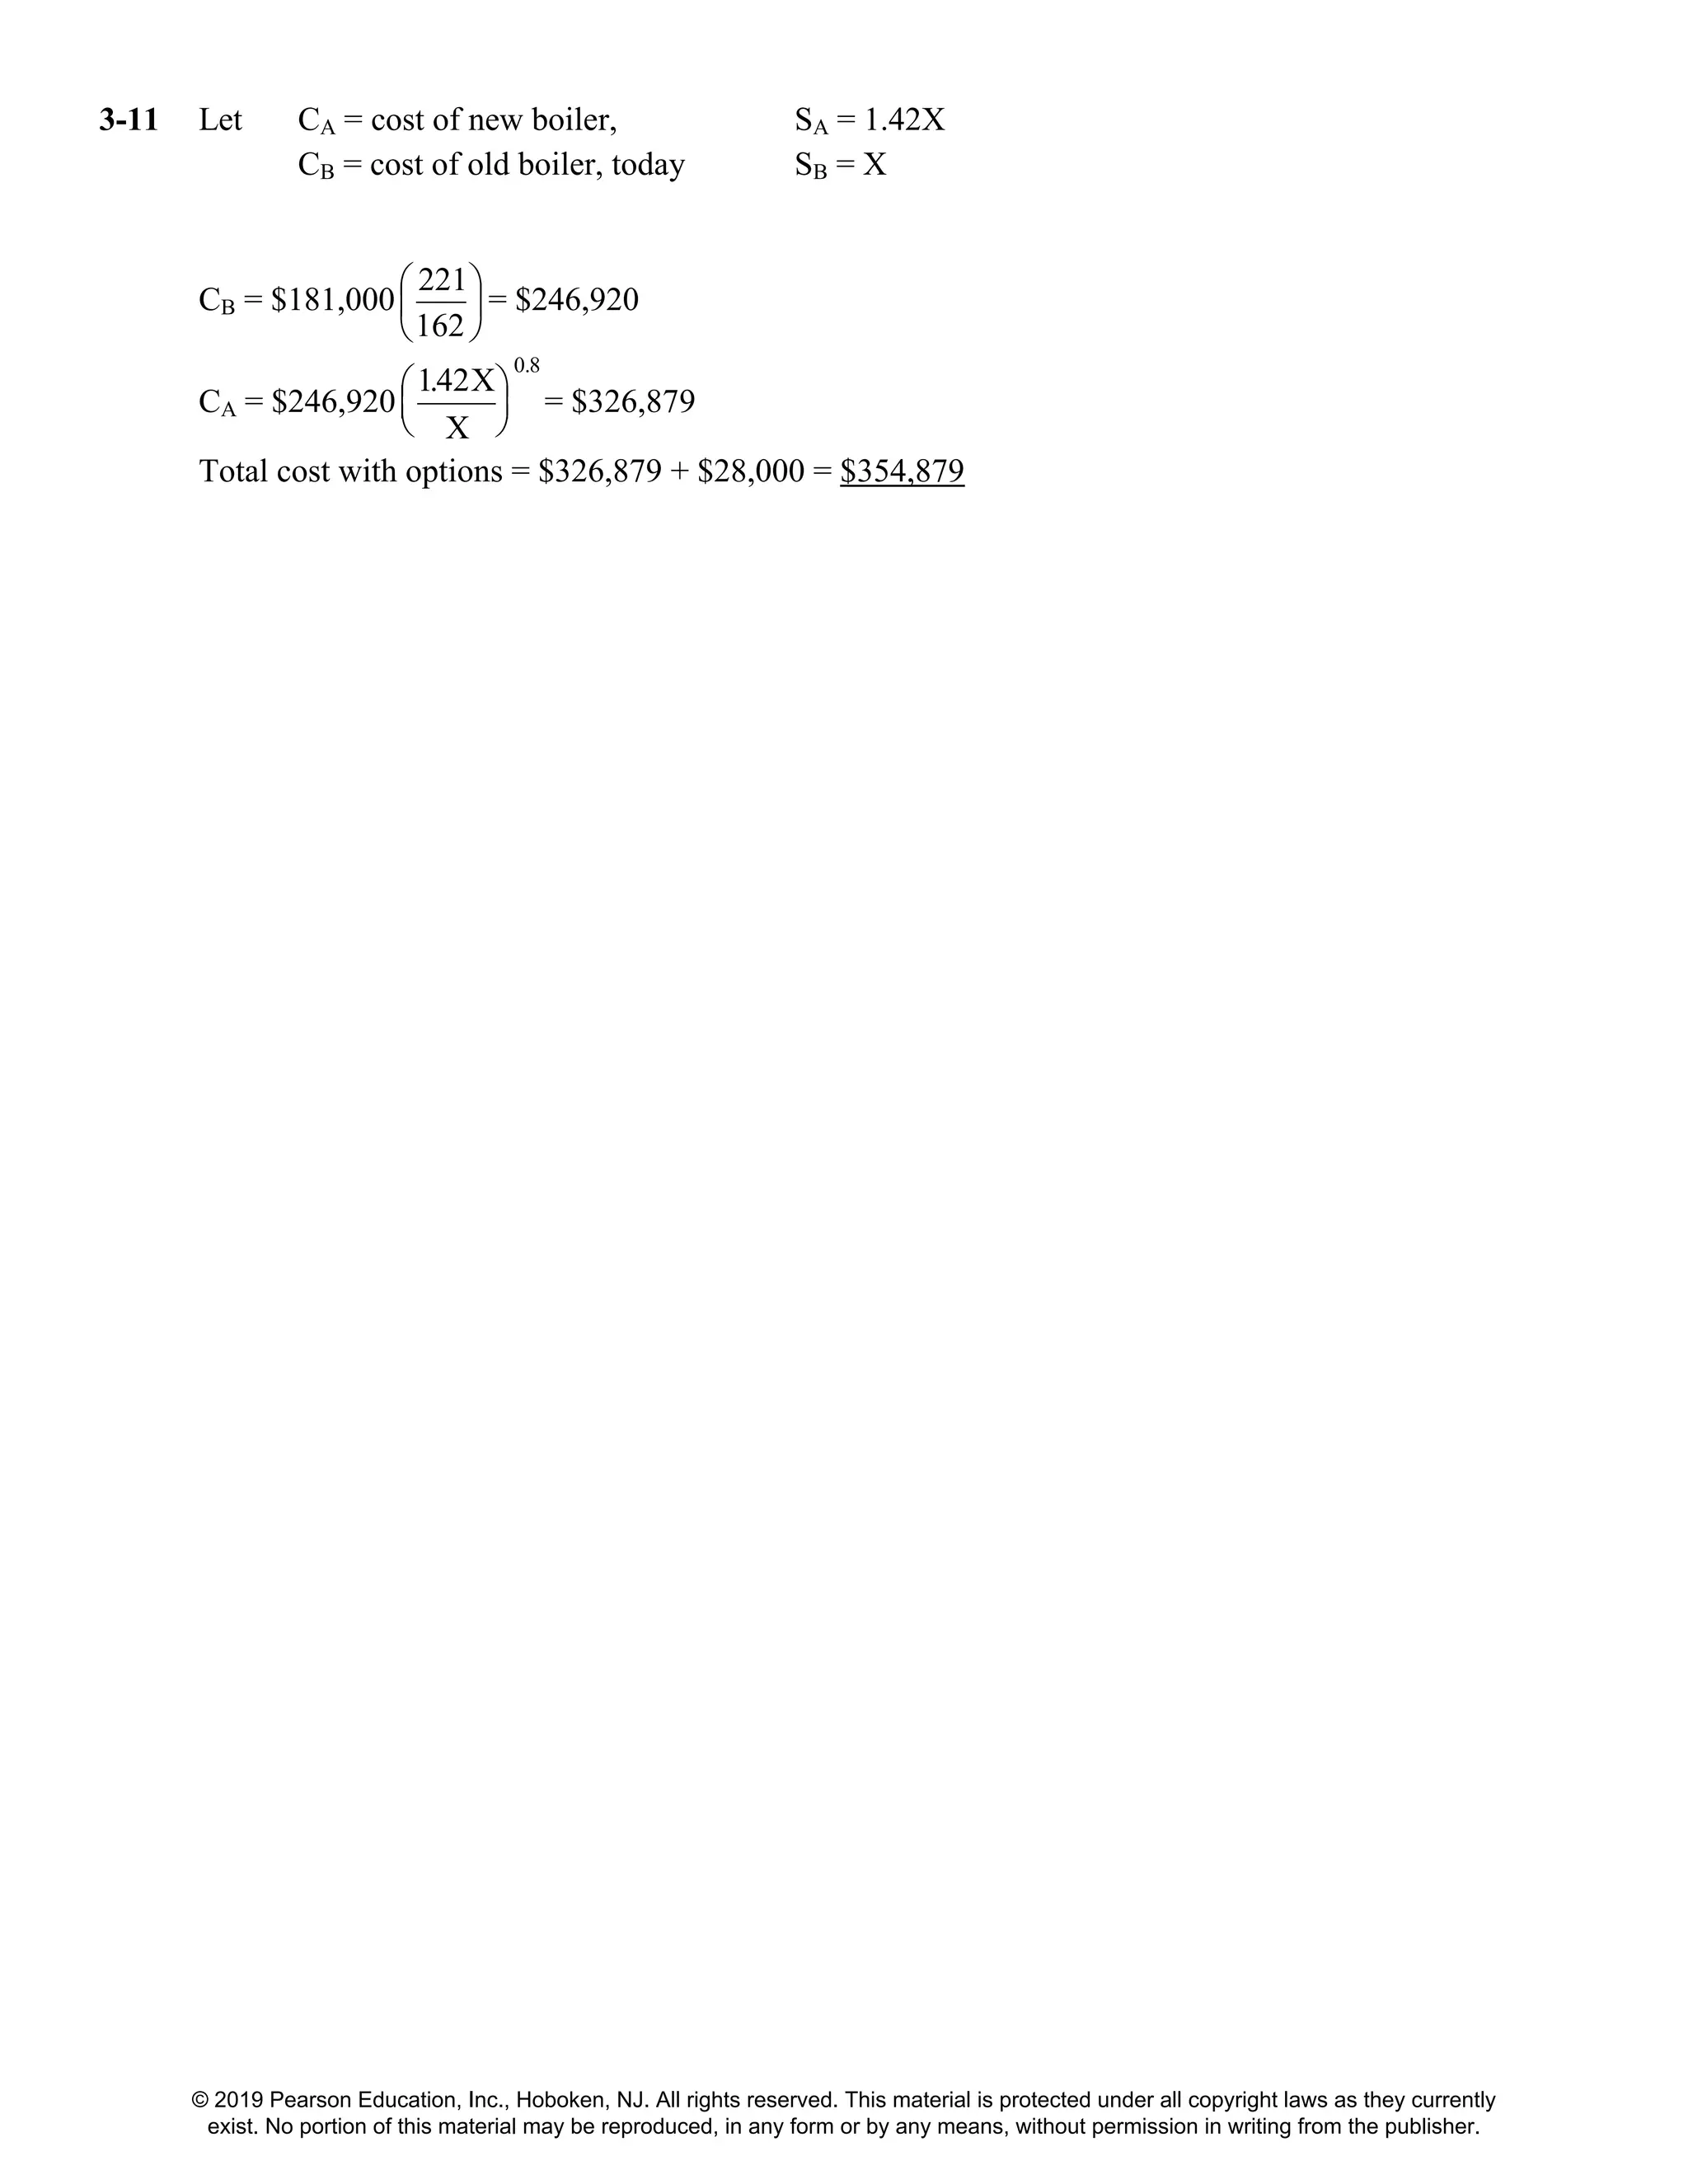
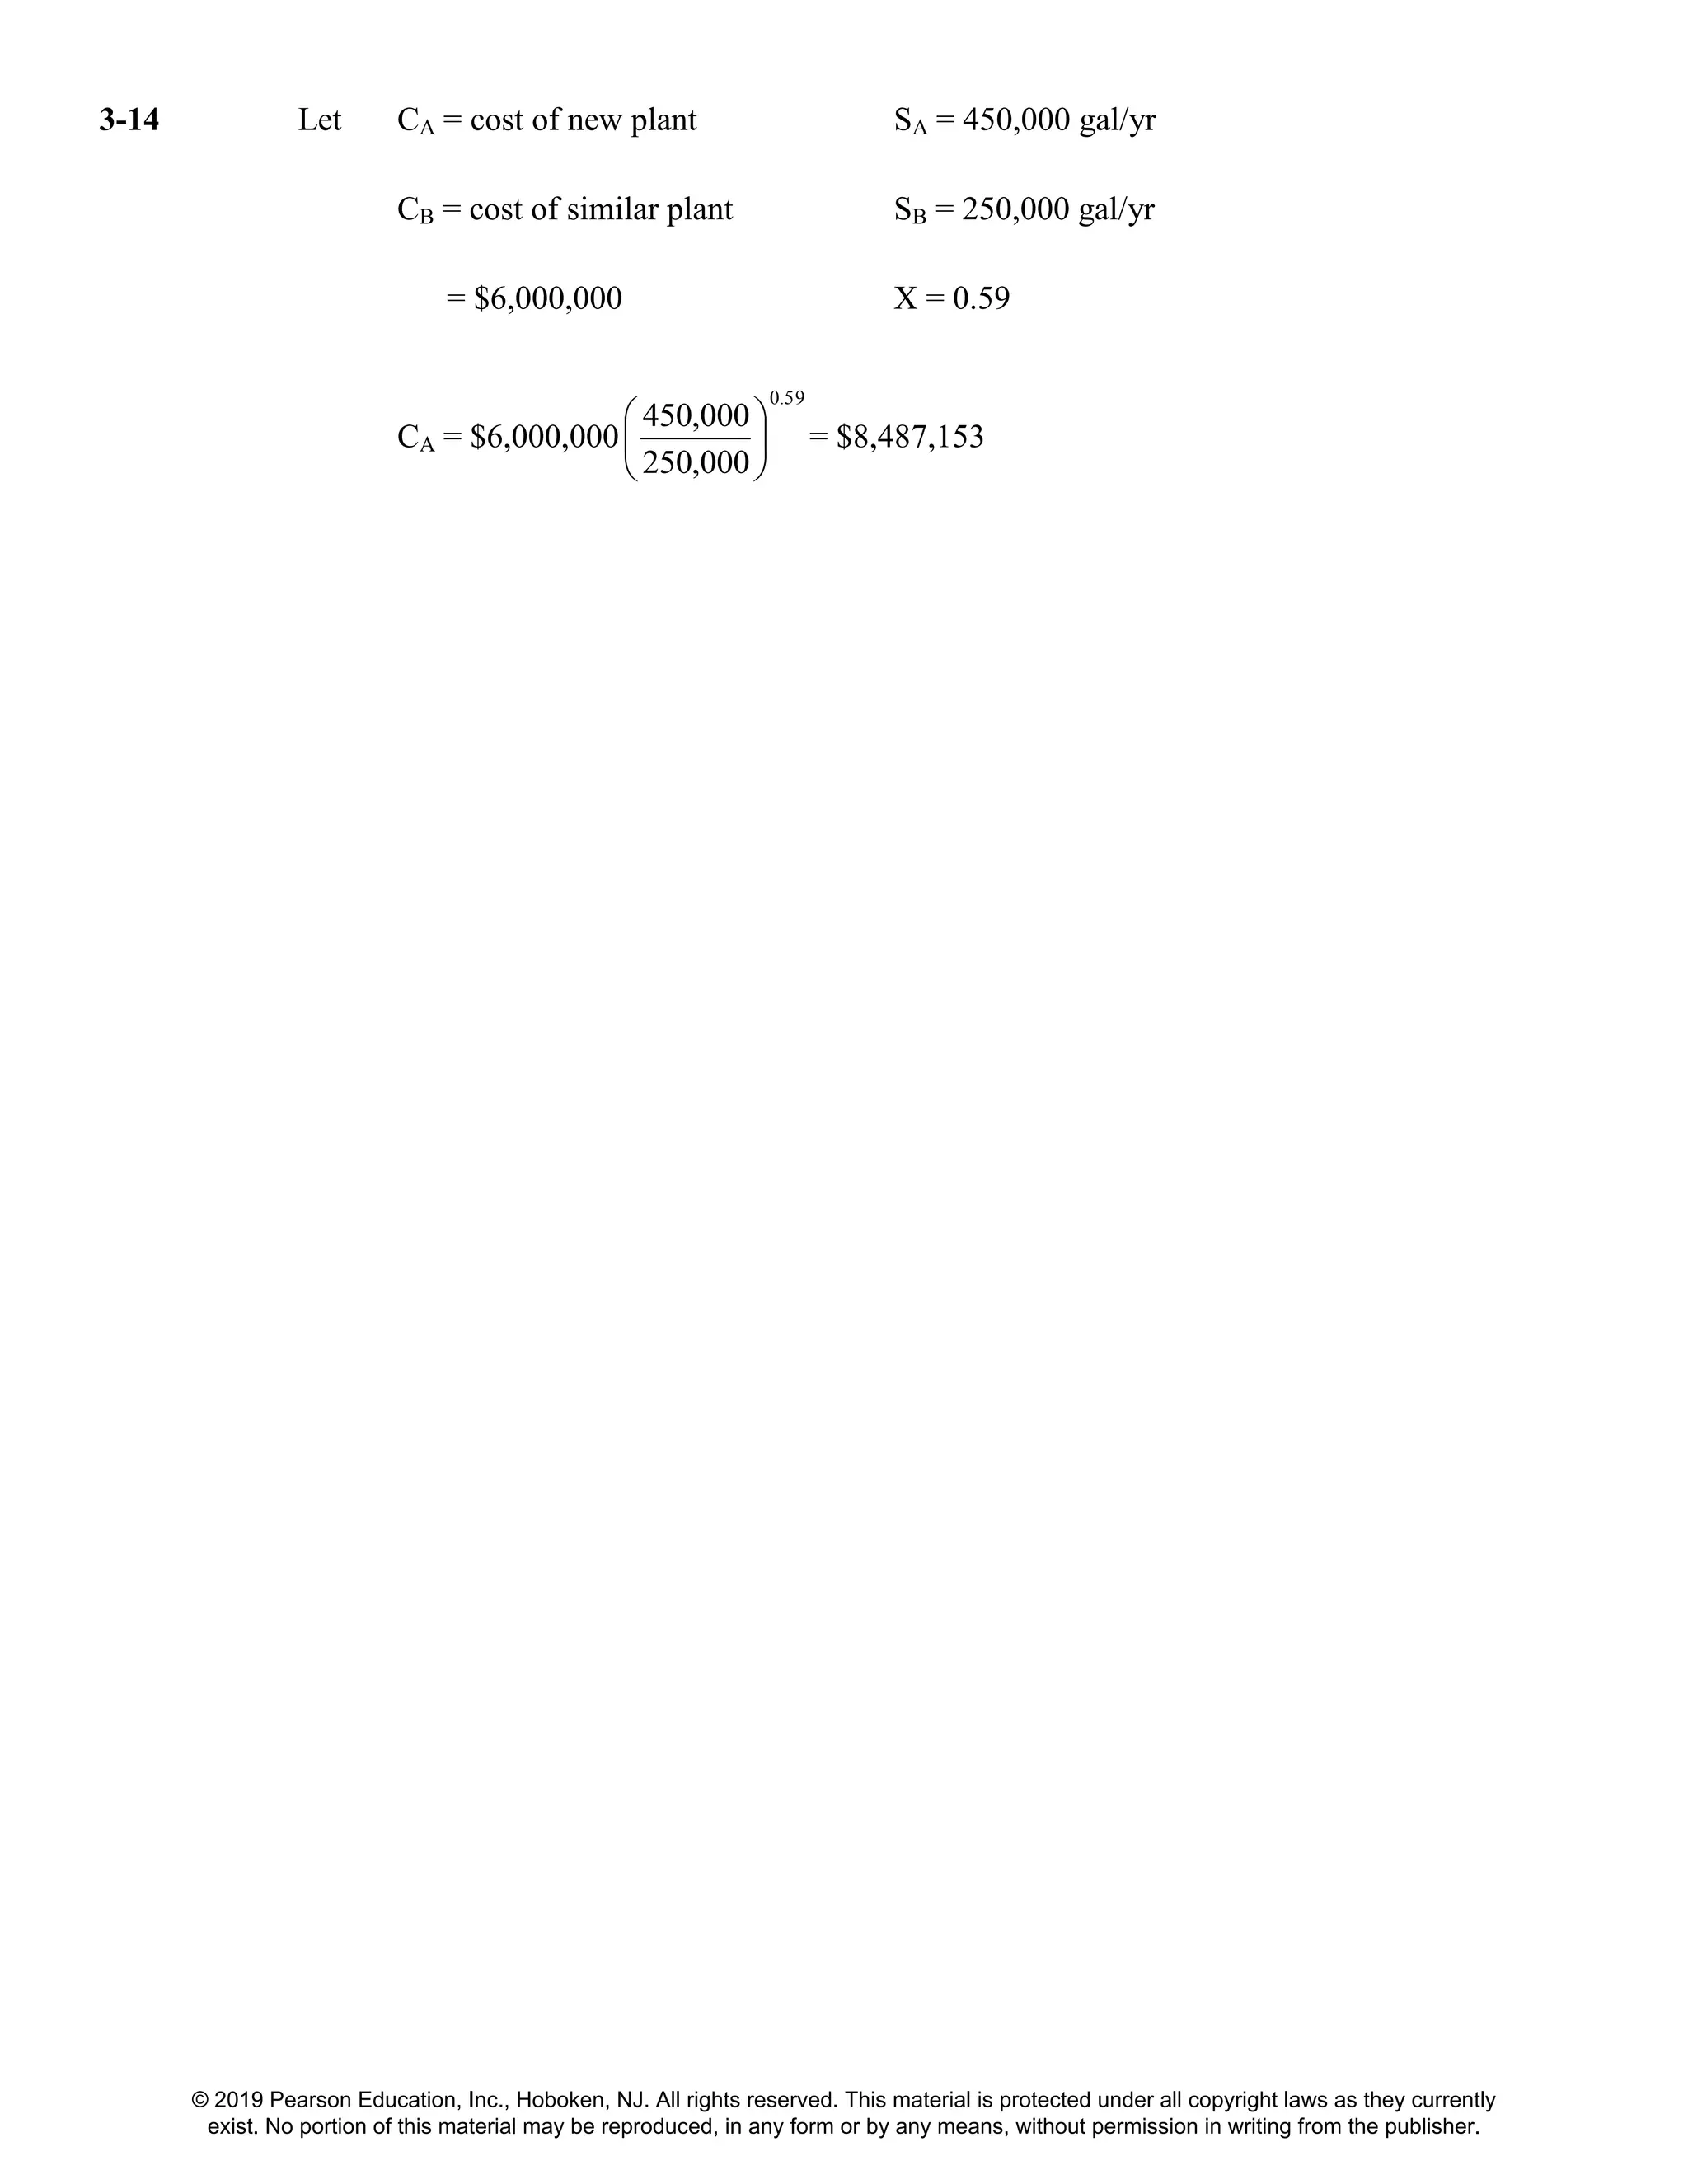
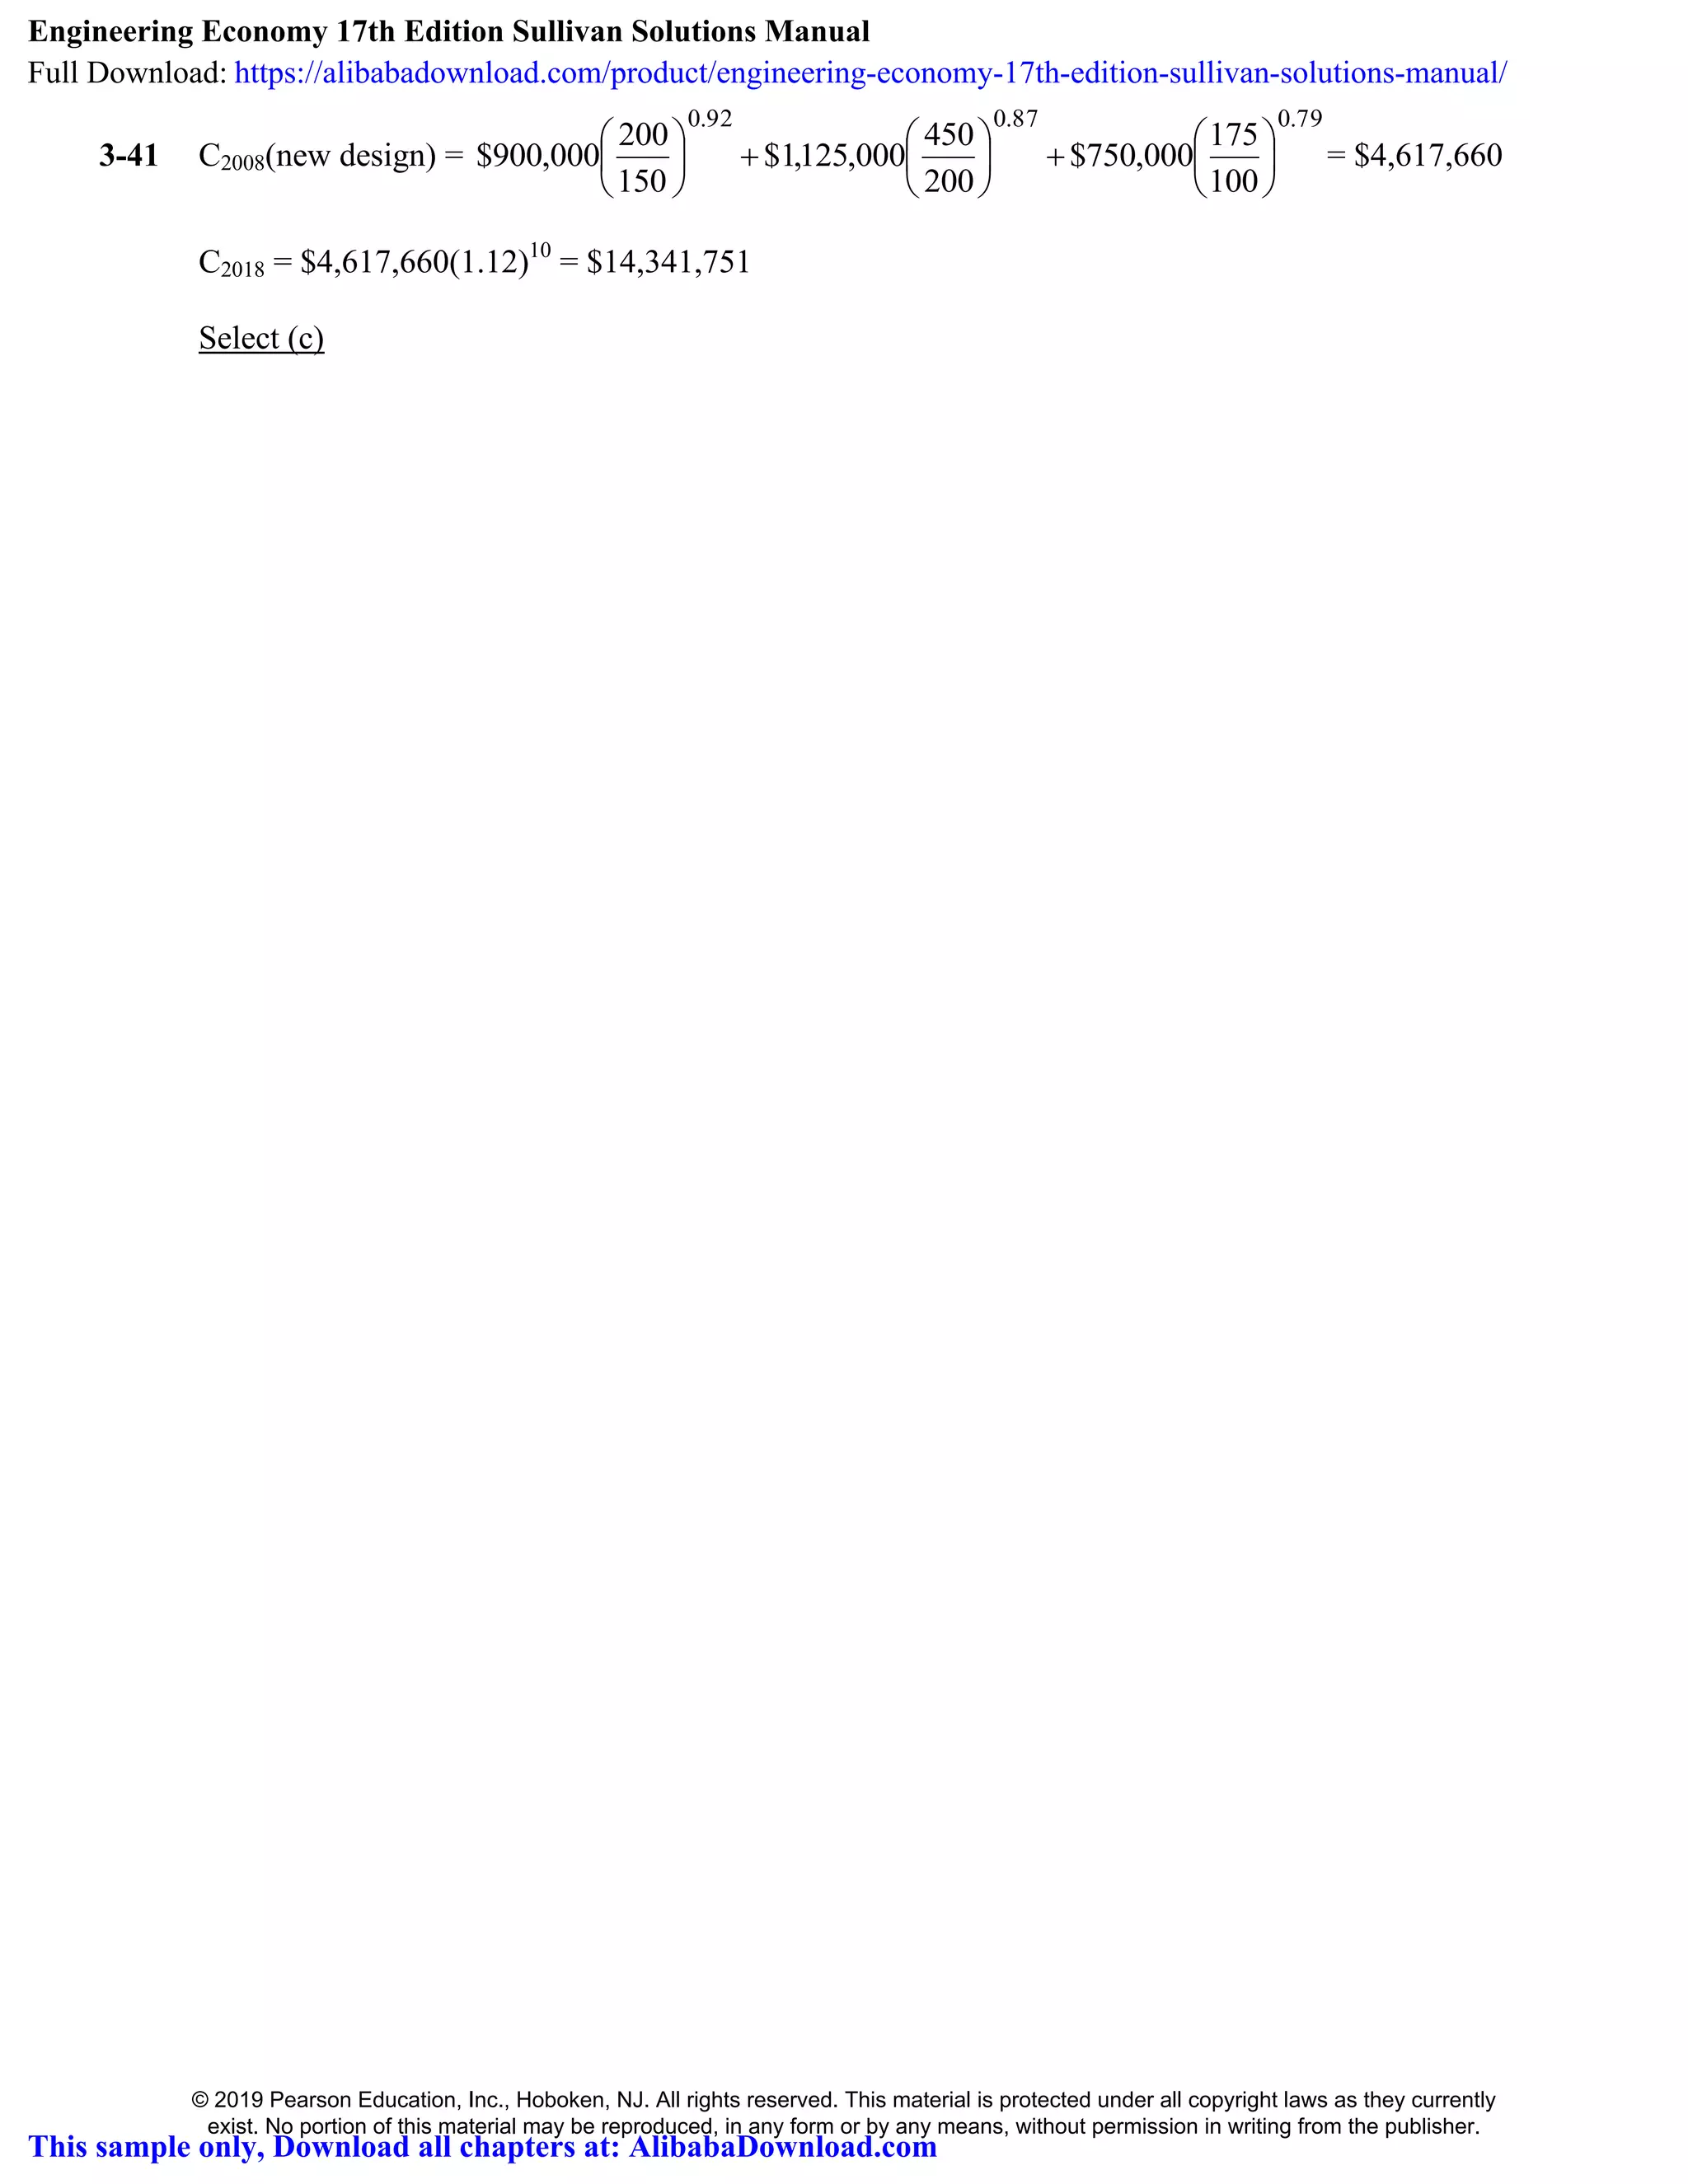
- Using scaling equations to estimate costs of similar projects as sizes/capacities change, such as estimating the cost of a larger solar farm based on the known cost of a smaller one.
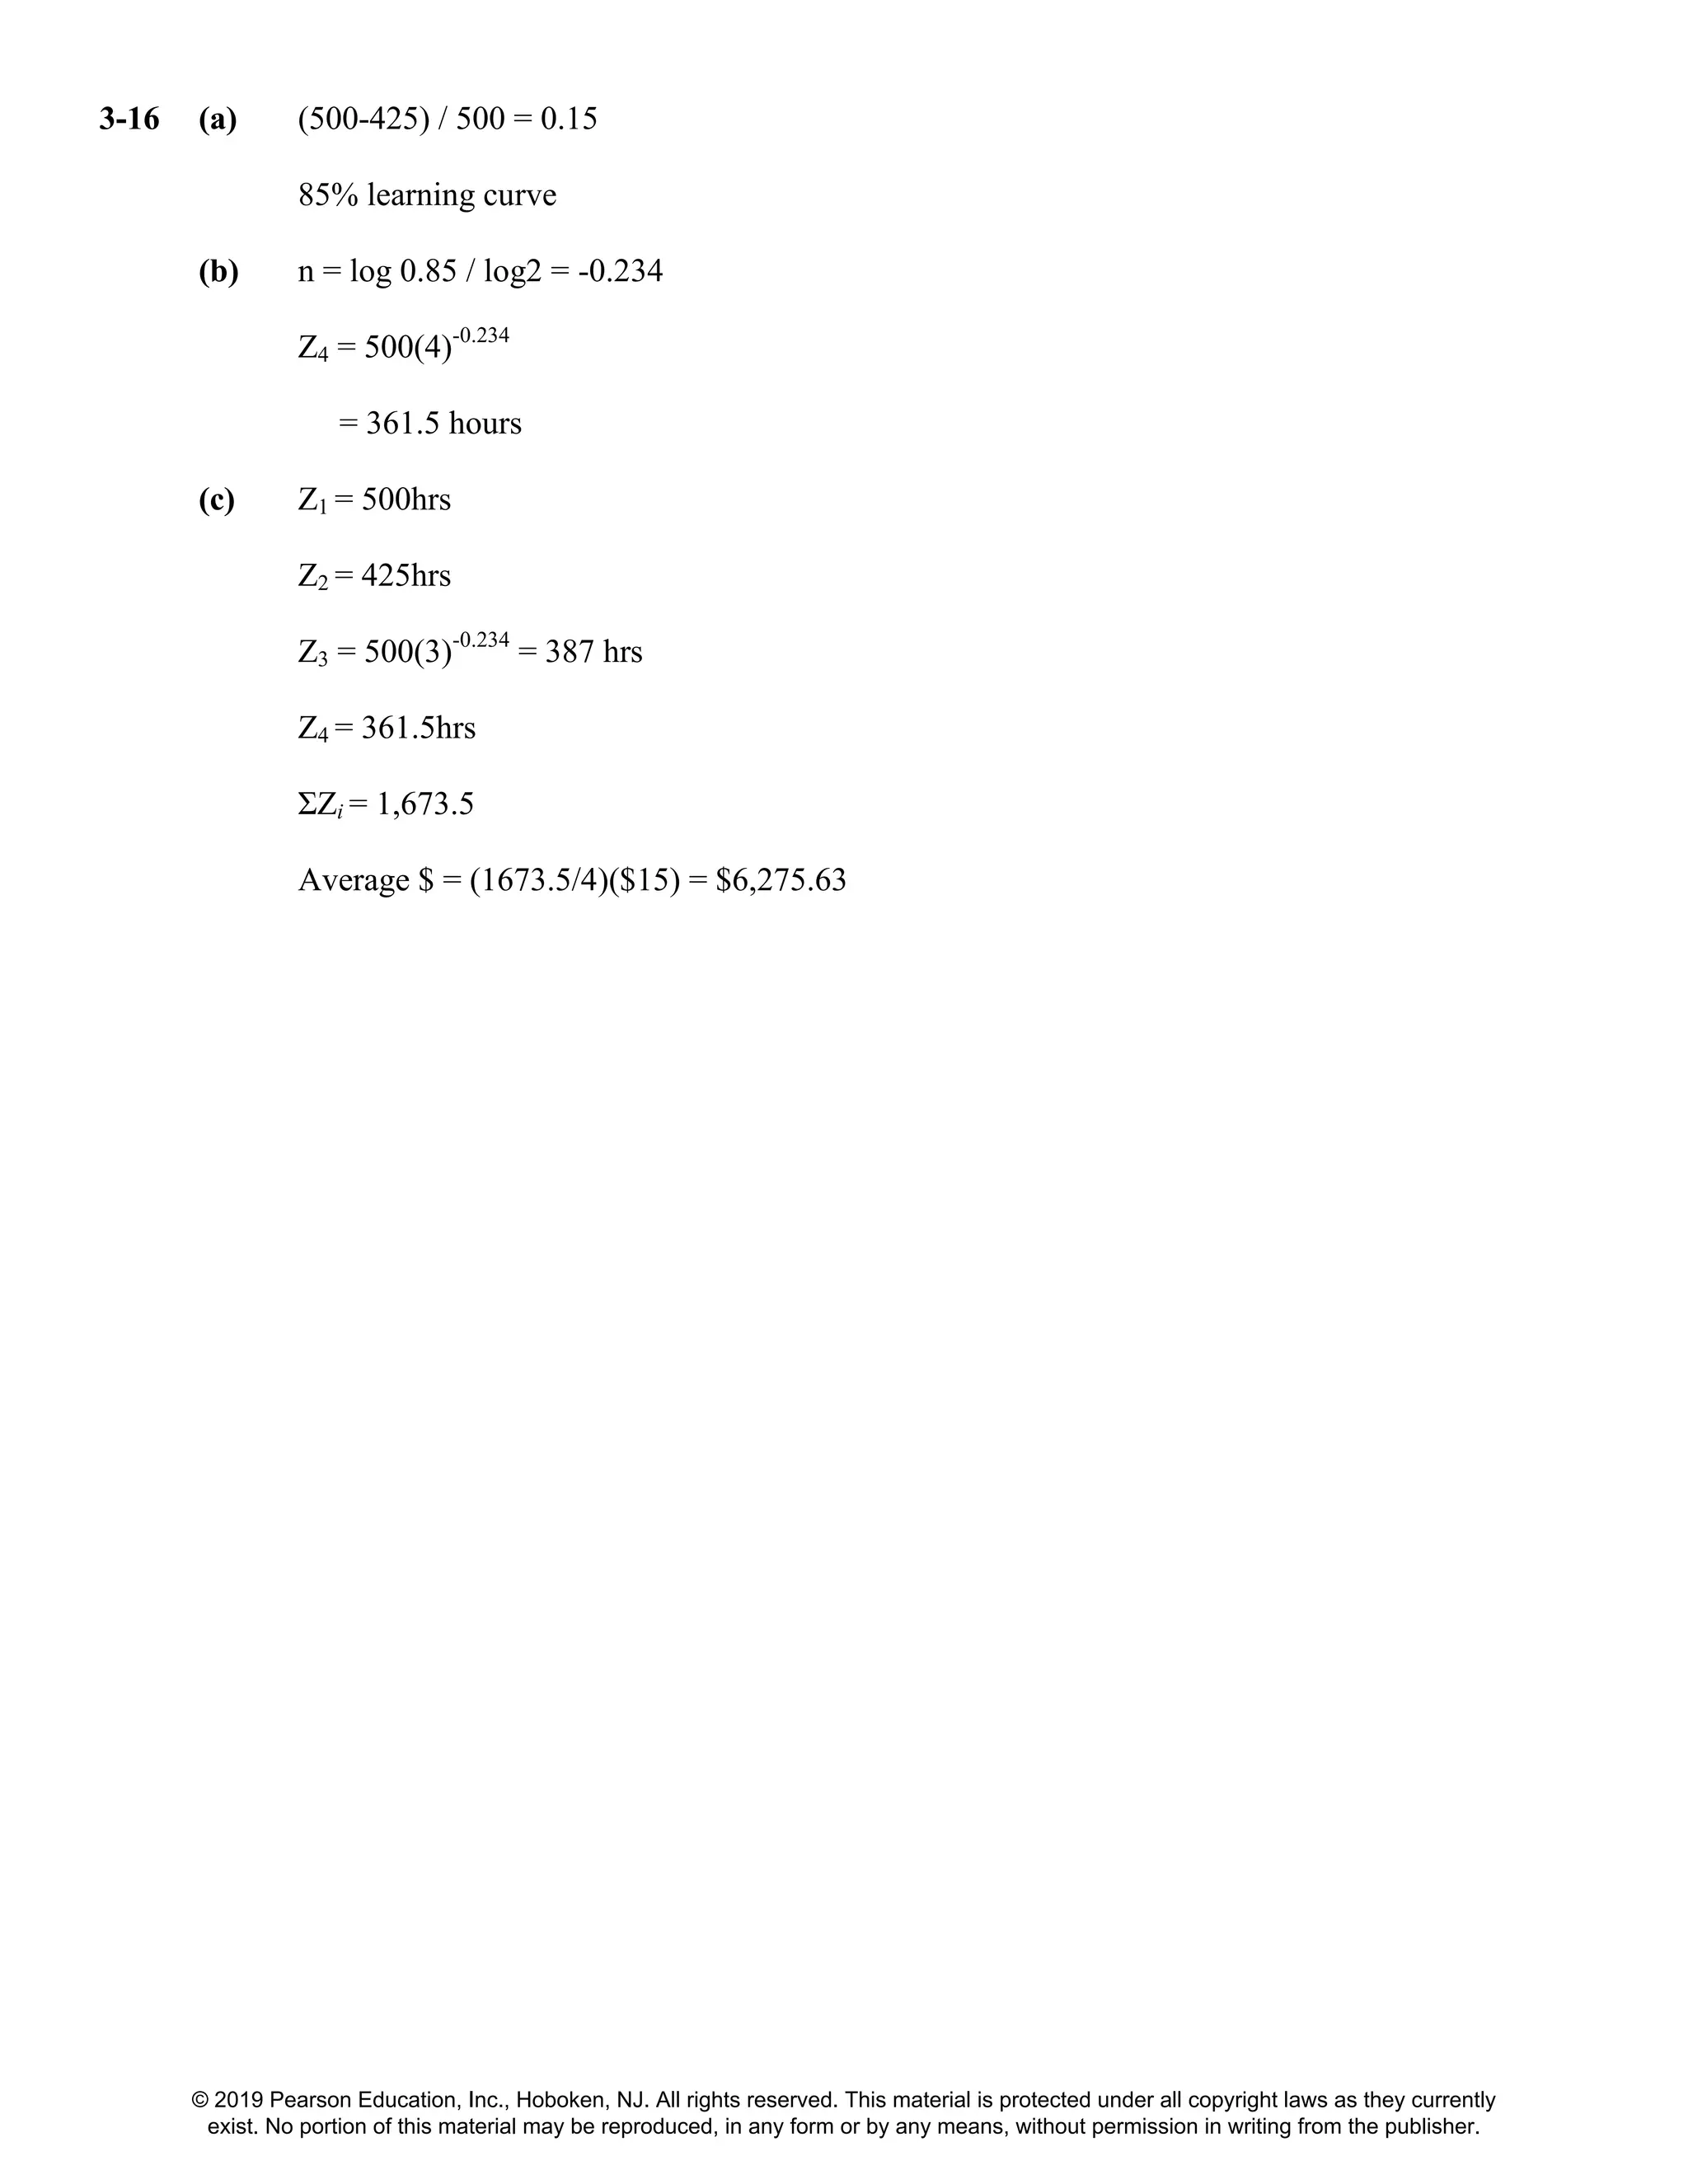
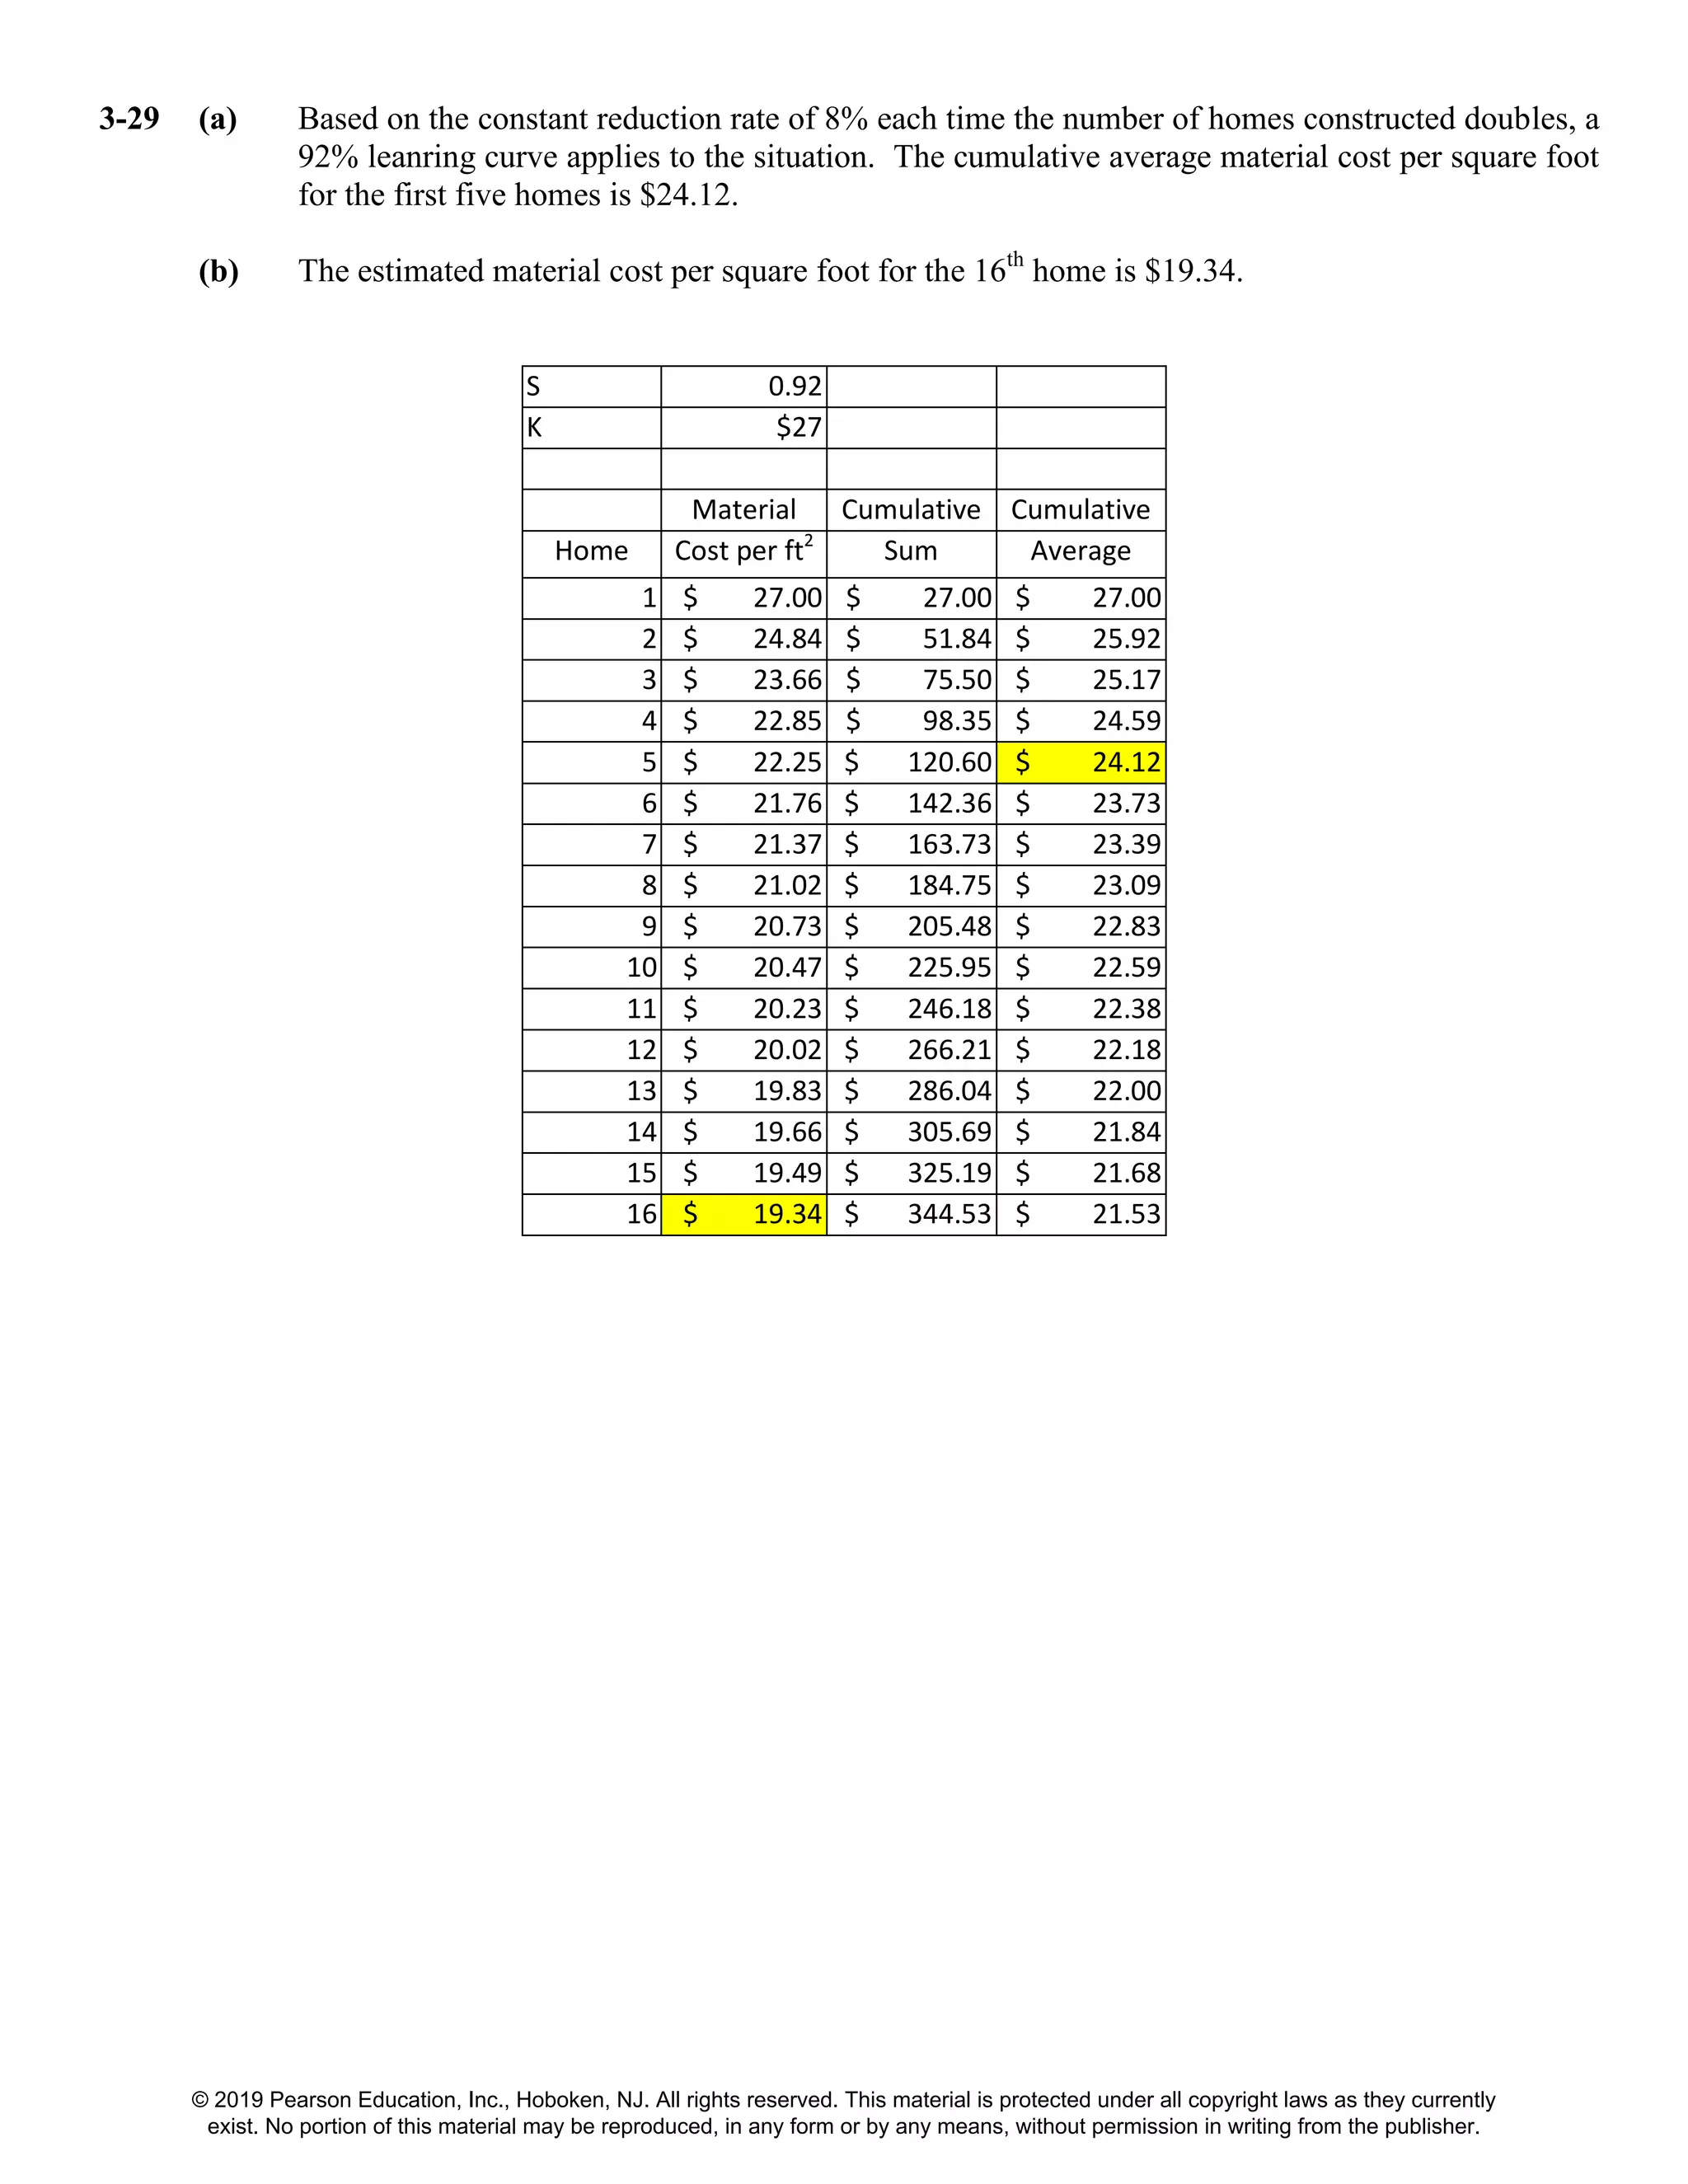
- Applying a learning curve equation to estimate hours and average cost to produce different quantities of a product.
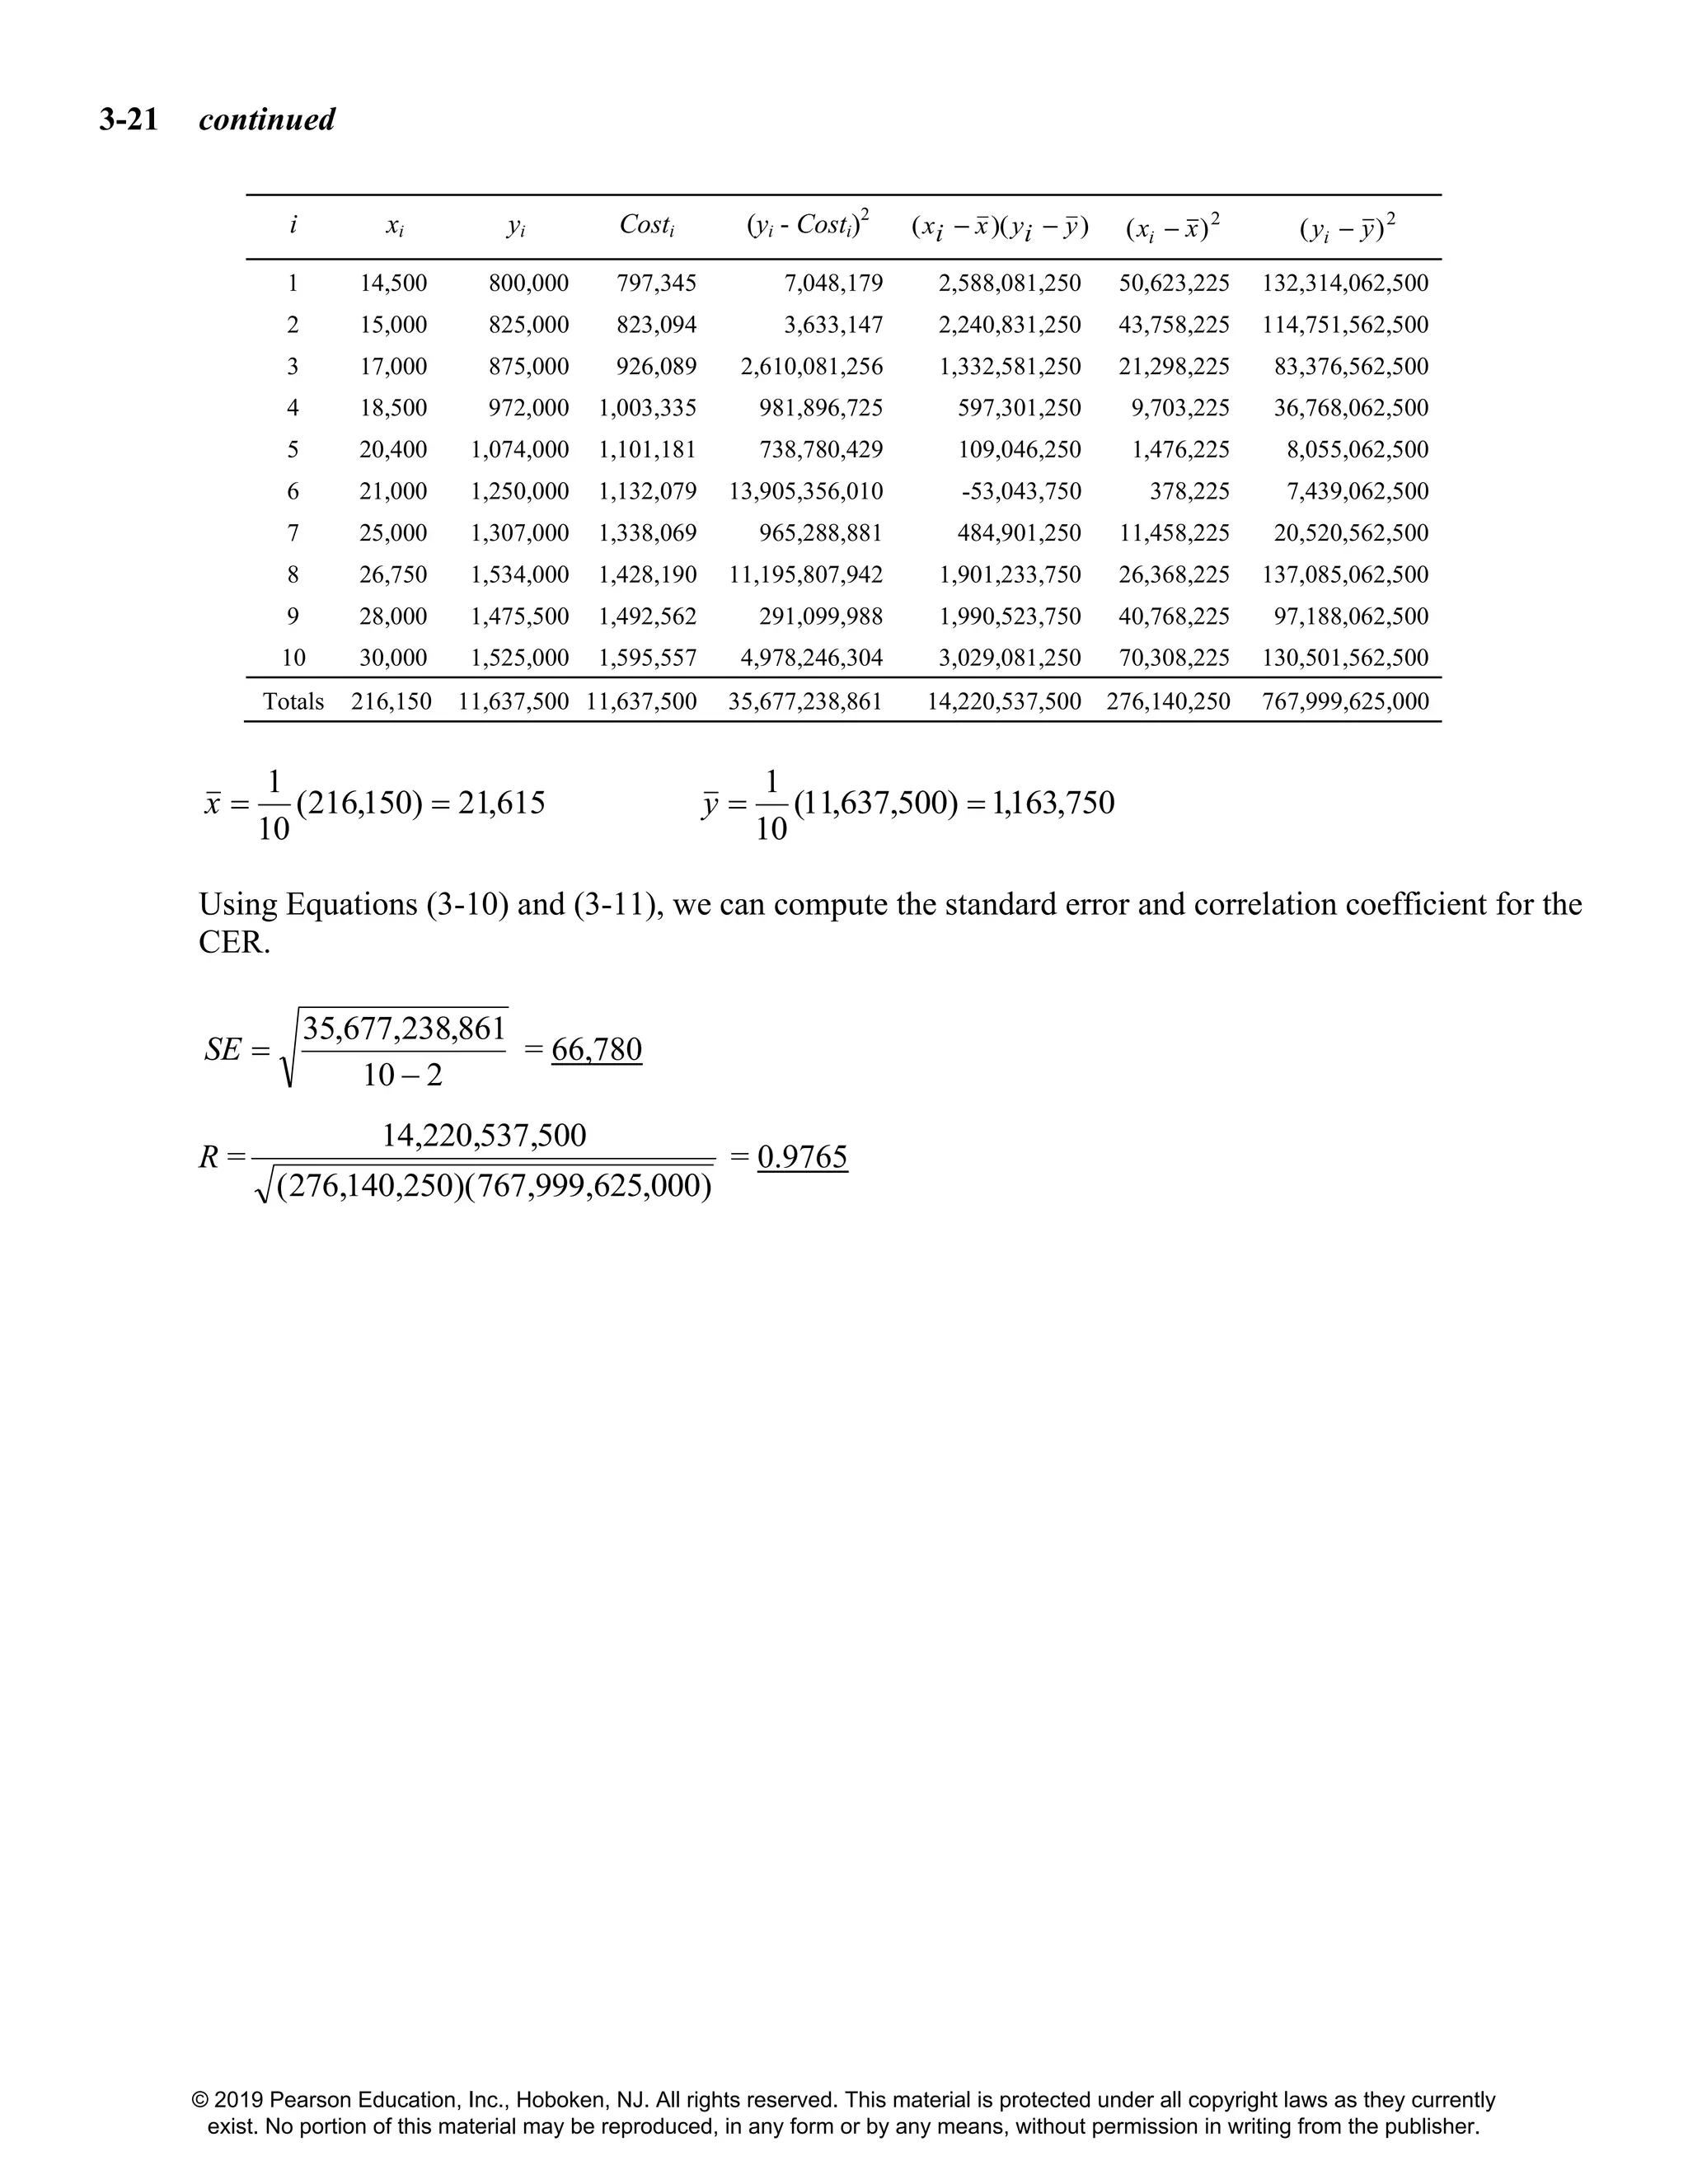
- Performing linear regression analysis on cost data


![3-17 n = log (0.9) / log 2 = -0.152
Z6 = 10 (6)n
= 10 [(6)-0.152
]
= 7.6 hours
© 2019 Pearson Education, Inc., Hoboken, NJ. All rights reserved. This material is protected under all copyright laws as they currently
exist. No portion of this material may be reproduced, in any form or by any means, without permission in writing from the publisher.](https://image.slidesharecdn.com/engineering-economy-17th-edition-sullivan-solutions-manual-191229130031/75/Engineering-Economy-17th-Edition-Sullivan-Solutions-Manual-17-2048.jpg)
![3-18 n = log (0.85) / log2 = -0.2345
Cx = Tx / x so (x) Cx = Tx , or Tx = 5(15.882 hrs.) = 79.41 hours
We know that Tx = K [1-0.2345
+ 2-0.2345
+ 3-0.2345
+ 4-0.2345
+ 5-0.2345
]
so 79.41 = 4.031 K , or K = 19.70 hours
Now with equation 3-5 we can determine Z20:
Z20 = 19.70 (20-0.2345
) = 9.76 hours
© 2019 Pearson Education, Inc., Hoboken, NJ. All rights reserved. This material is protected under all copyright laws as they currently
exist. No portion of this material may be reproduced, in any form or by any means, without permission in writing from the publisher.](https://image.slidesharecdn.com/engineering-economy-17th-edition-sullivan-solutions-manual-191229130031/75/Engineering-Economy-17th-Edition-Sullivan-Solutions-Manual-18-2048.jpg)
![3-19 (a) ∑x = 687
∑y = 2,559
∑xy = 442,844
∑x2
= 118,831
𝑥̅ = 687/4 = 171.75
𝑦̅ = 2,559/4 = 639.75
𝑏̂ = [4(442,844) – 687(2,559)] / [4(118,831) – 6872
] = 3.977
𝑎̂ = [2,559 – 3.977(687)] / 4 = -43.308
∴ 𝑦̂ = -43.308 + 3.977(x)
(b) 𝑦̂ = -43.308 + 3.977(170)
𝑦̂ = $632.78
© 2019 Pearson Education, Inc., Hoboken, NJ. All rights reserved. This material is protected under all copyright laws as they currently
exist. No portion of this material may be reproduced, in any form or by any means, without permission in writing from the publisher.](https://image.slidesharecdn.com/engineering-economy-17th-edition-sullivan-solutions-manual-191229130031/75/Engineering-Economy-17th-Edition-Sullivan-Solutions-Manual-19-2048.jpg)
![3-20 ∑x = 1,732
∑y = 3,532
∑xy = 644,176
∑x2
= 325,586
b = [644,176 – 173.2(3,532)] / [325,586 – 173.2(1,732)] = 1.2668
a = 353.2 – 1.2668(173.2) = 133.79
So y = 133.79 + 1.2668x
When x = 198,
y = 133.79 + 1.2668(198) = 384.6 (call it 385 units per quarter)
© 2019 Pearson Education, Inc., Hoboken, NJ. All rights reserved. This material is protected under all copyright laws as they currently
exist. No portion of this material may be reproduced, in any form or by any means, without permission in writing from the publisher.](https://image.slidesharecdn.com/engineering-economy-17th-edition-sullivan-solutions-manual-191229130031/75/Engineering-Economy-17th-Edition-Sullivan-Solutions-Manual-20-2048.jpg)


![3-35 Profit = Revenue – Cost
$25,000 = ($20.00/unit)(x) – [($21.00/unit)(.2 hours/unit)(x) + ($4.00/unit)(x)
+ (1.2)($21.00/unit)(.2 hours/unit)(x) + ($1.20/unit)(x)]
$25,000 = 5.56x; x = 4,497 units
© 2019 Pearson Education, Inc., Hoboken, NJ. All rights reserved. This material is protected under all copyright laws as they currently
exist. No portion of this material may be reproduced, in any form or by any means, without permission in writing from the publisher.](https://image.slidesharecdn.com/engineering-economy-17th-edition-sullivan-solutions-manual-191229130031/75/Engineering-Economy-17th-Edition-Sullivan-Solutions-Manual-36-2048.jpg)


![[W f stoecker]_refrigeration_and_a_ir_conditioning_(book_zz.org)](https://cdn.slidesharecdn.com/ss_thumbnails/wfstoeckerrefrigerationandairconditioningbookzz-161019162540-thumbnail.jpg?width=640&height=640&fit=bounds)


![Trigonometry [QEE-R 2012]](https://cdn.slidesharecdn.com/ss_thumbnails/qeereviewproblemswithsoln-120412063344-phpapp02-thumbnail.jpg?width=640&height=640&fit=bounds)