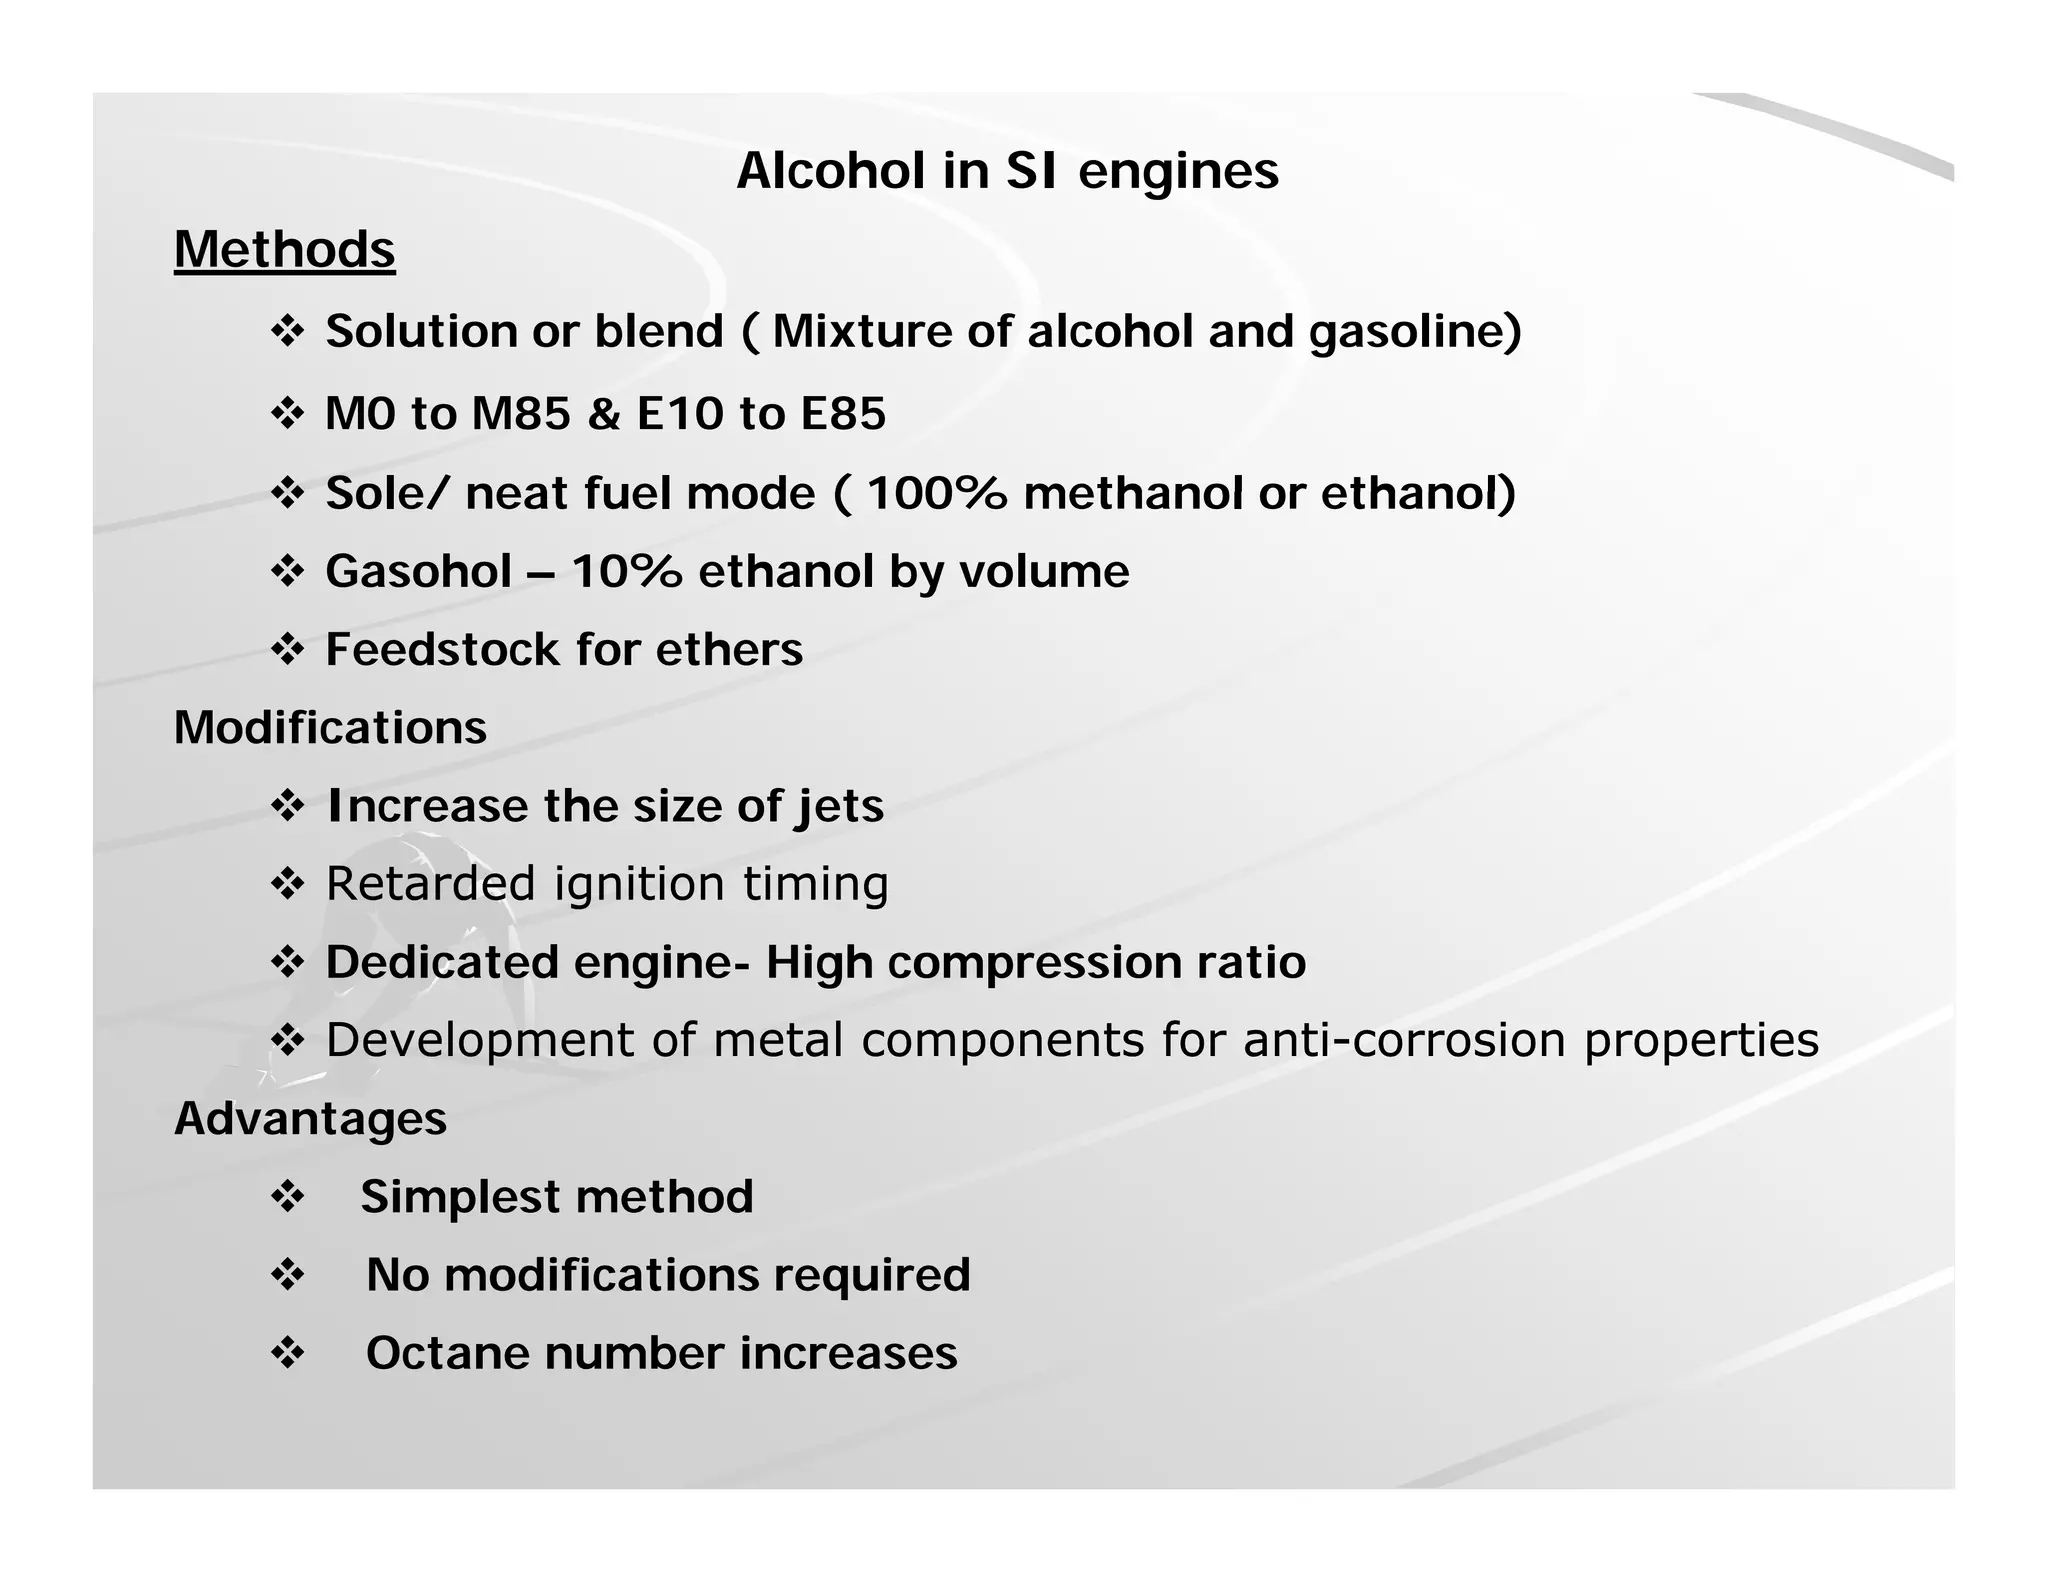
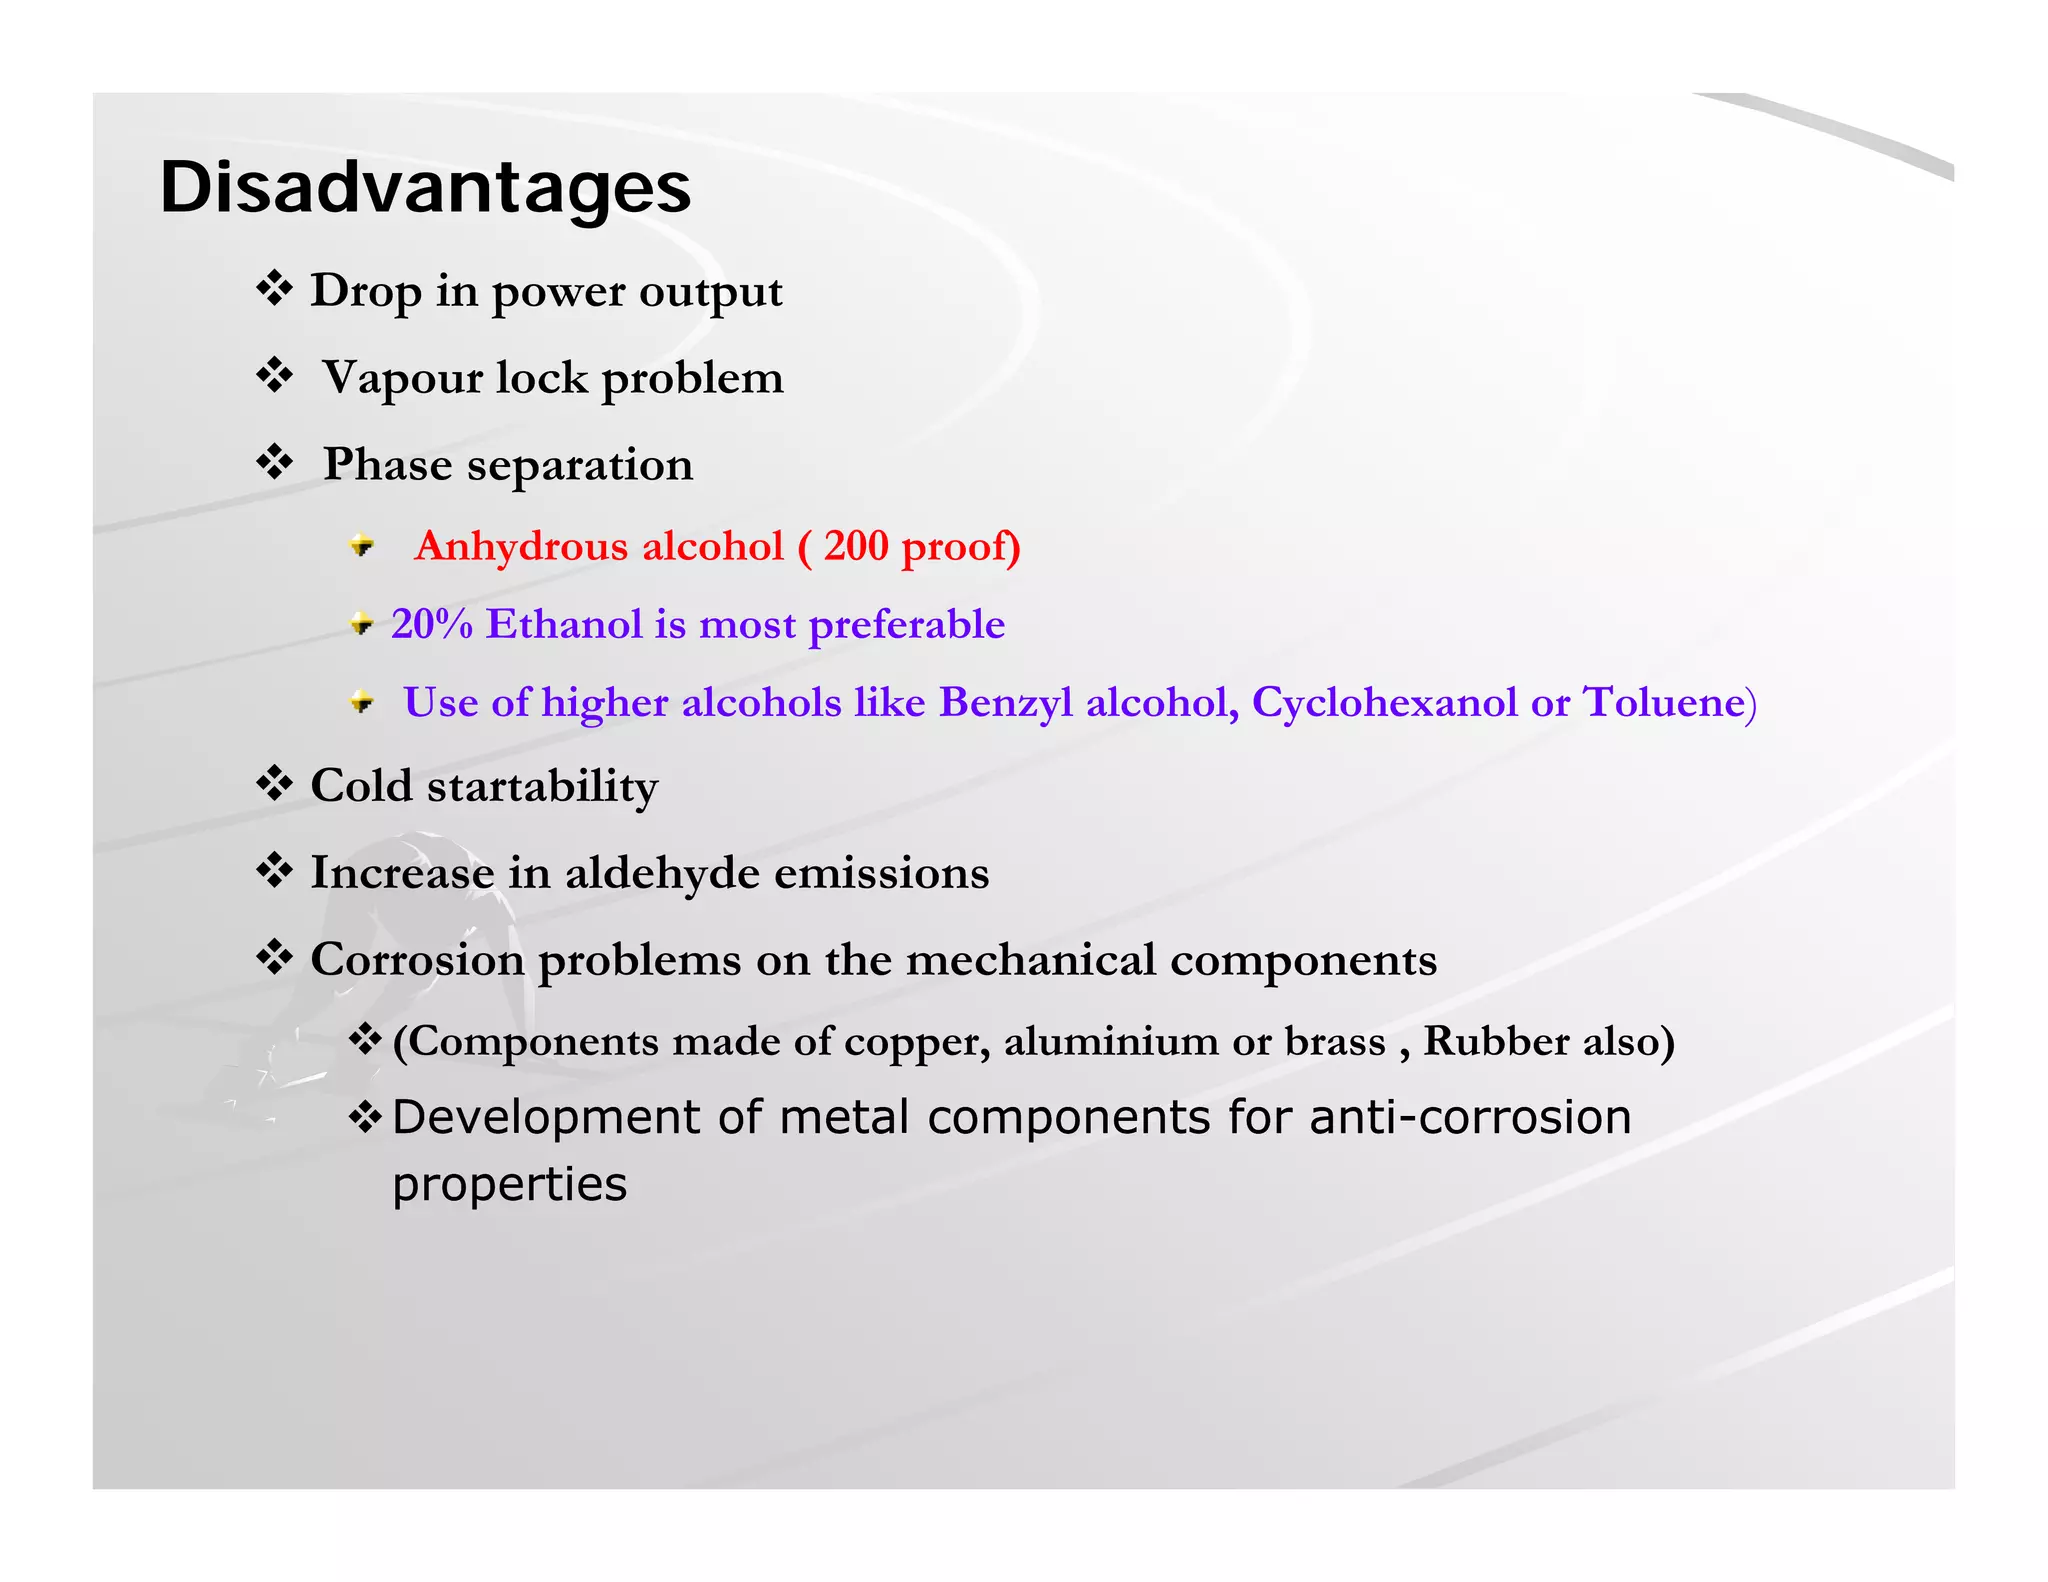
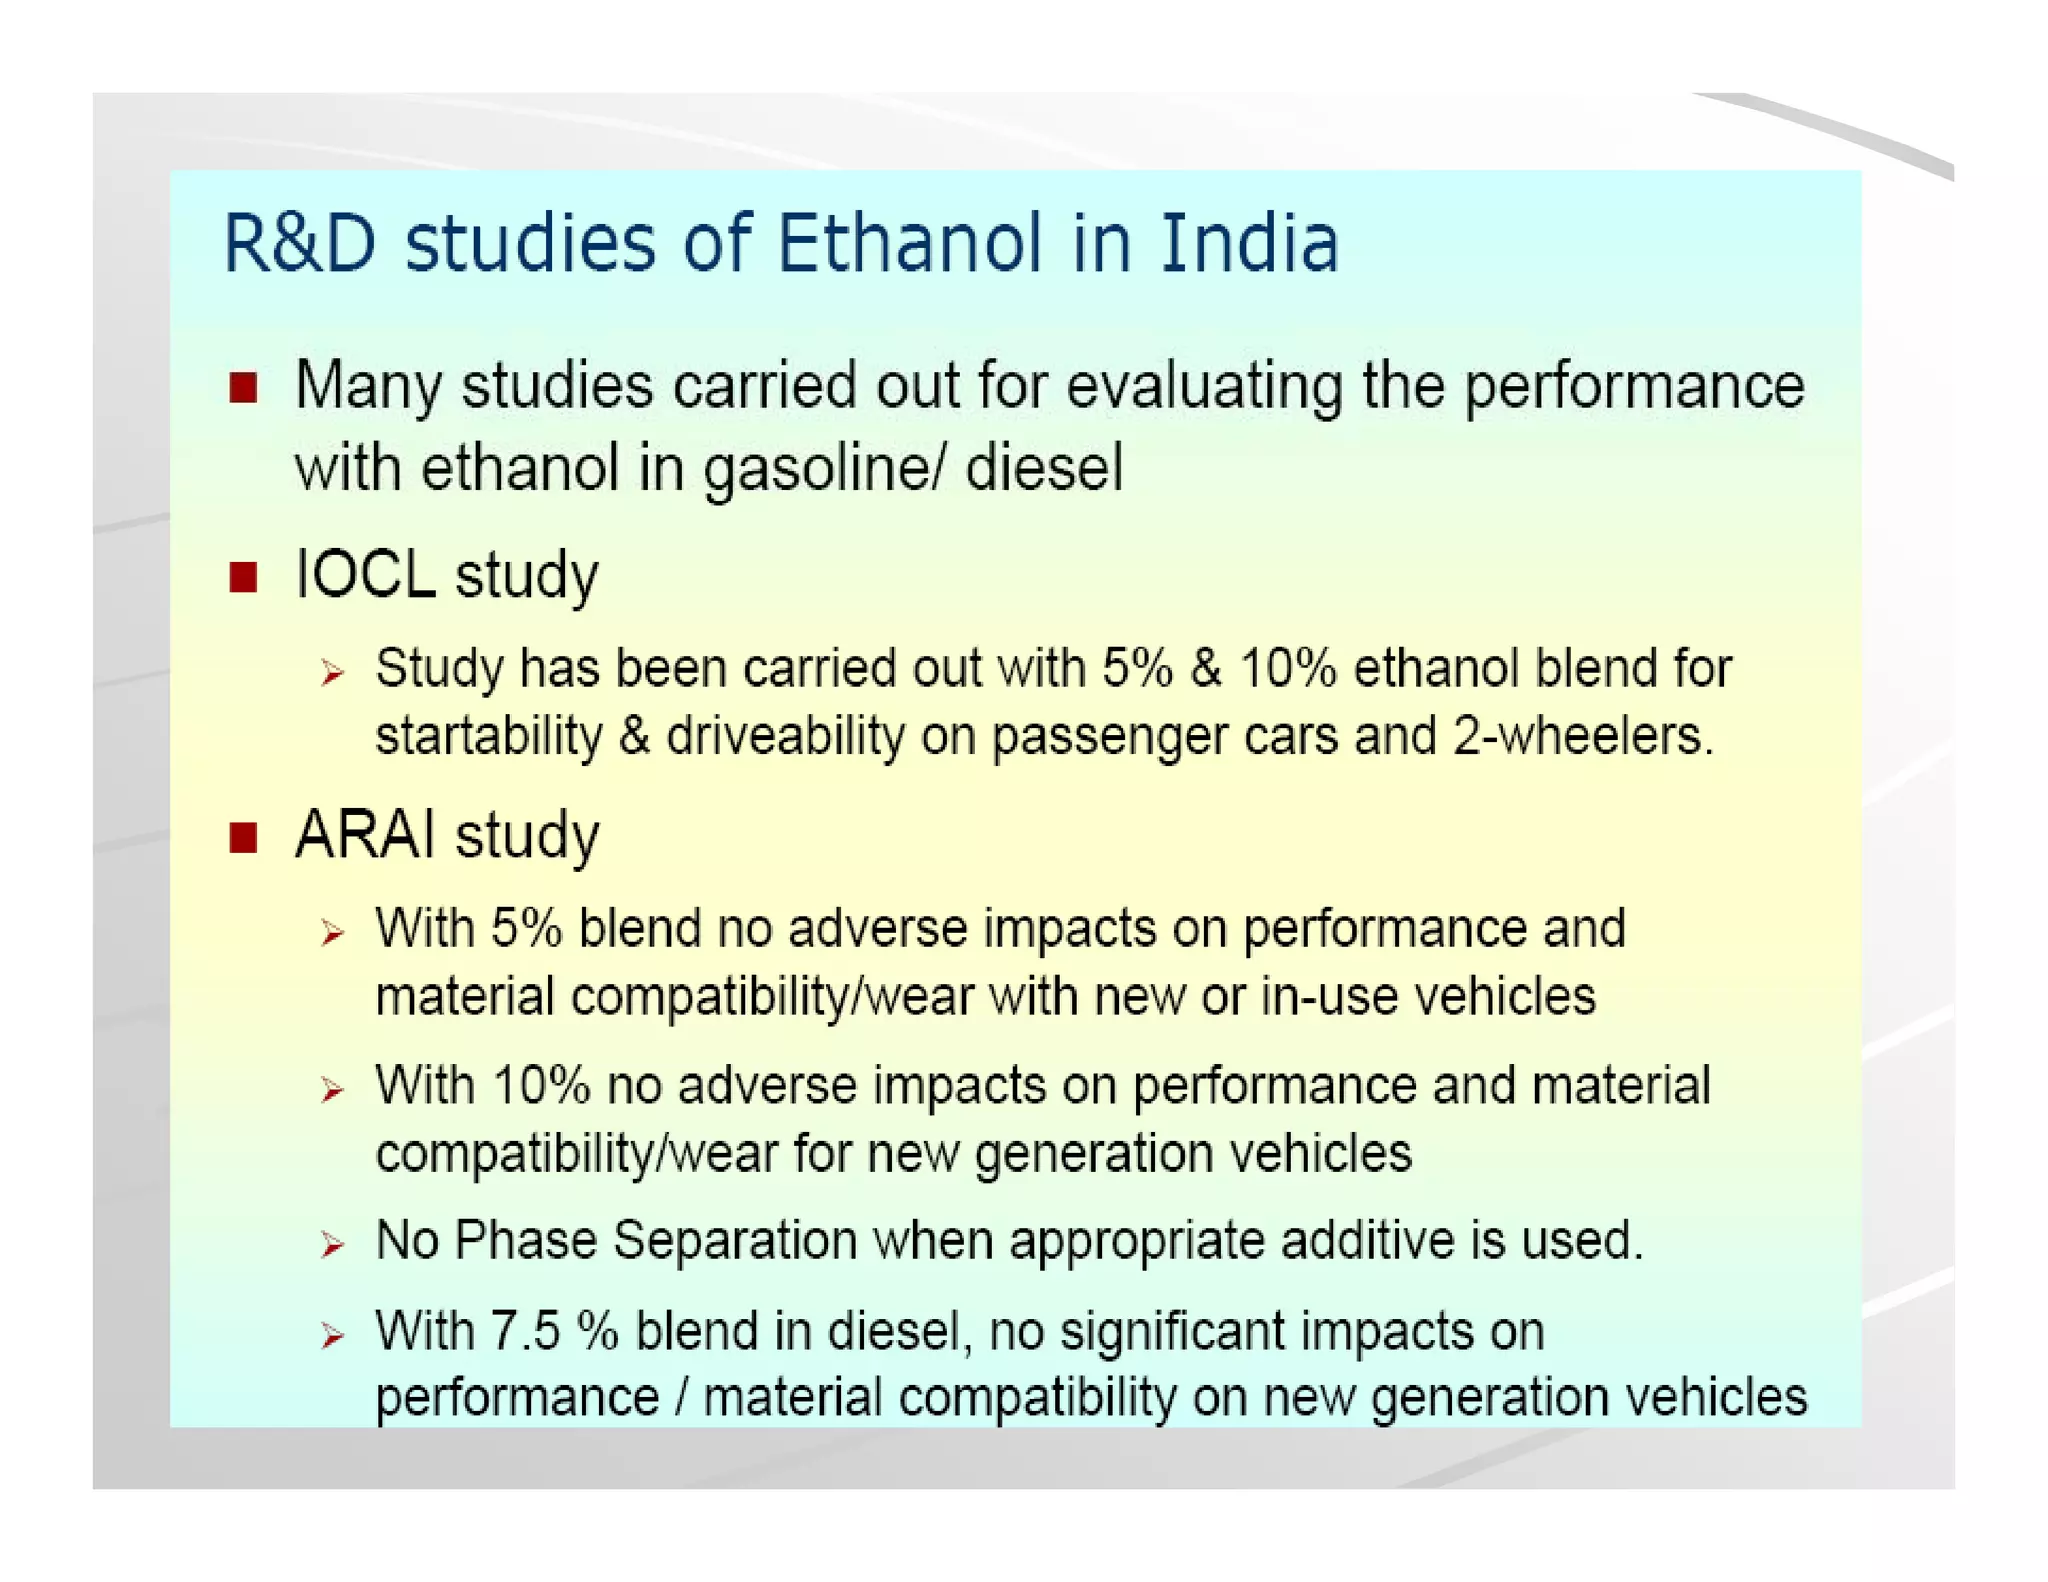
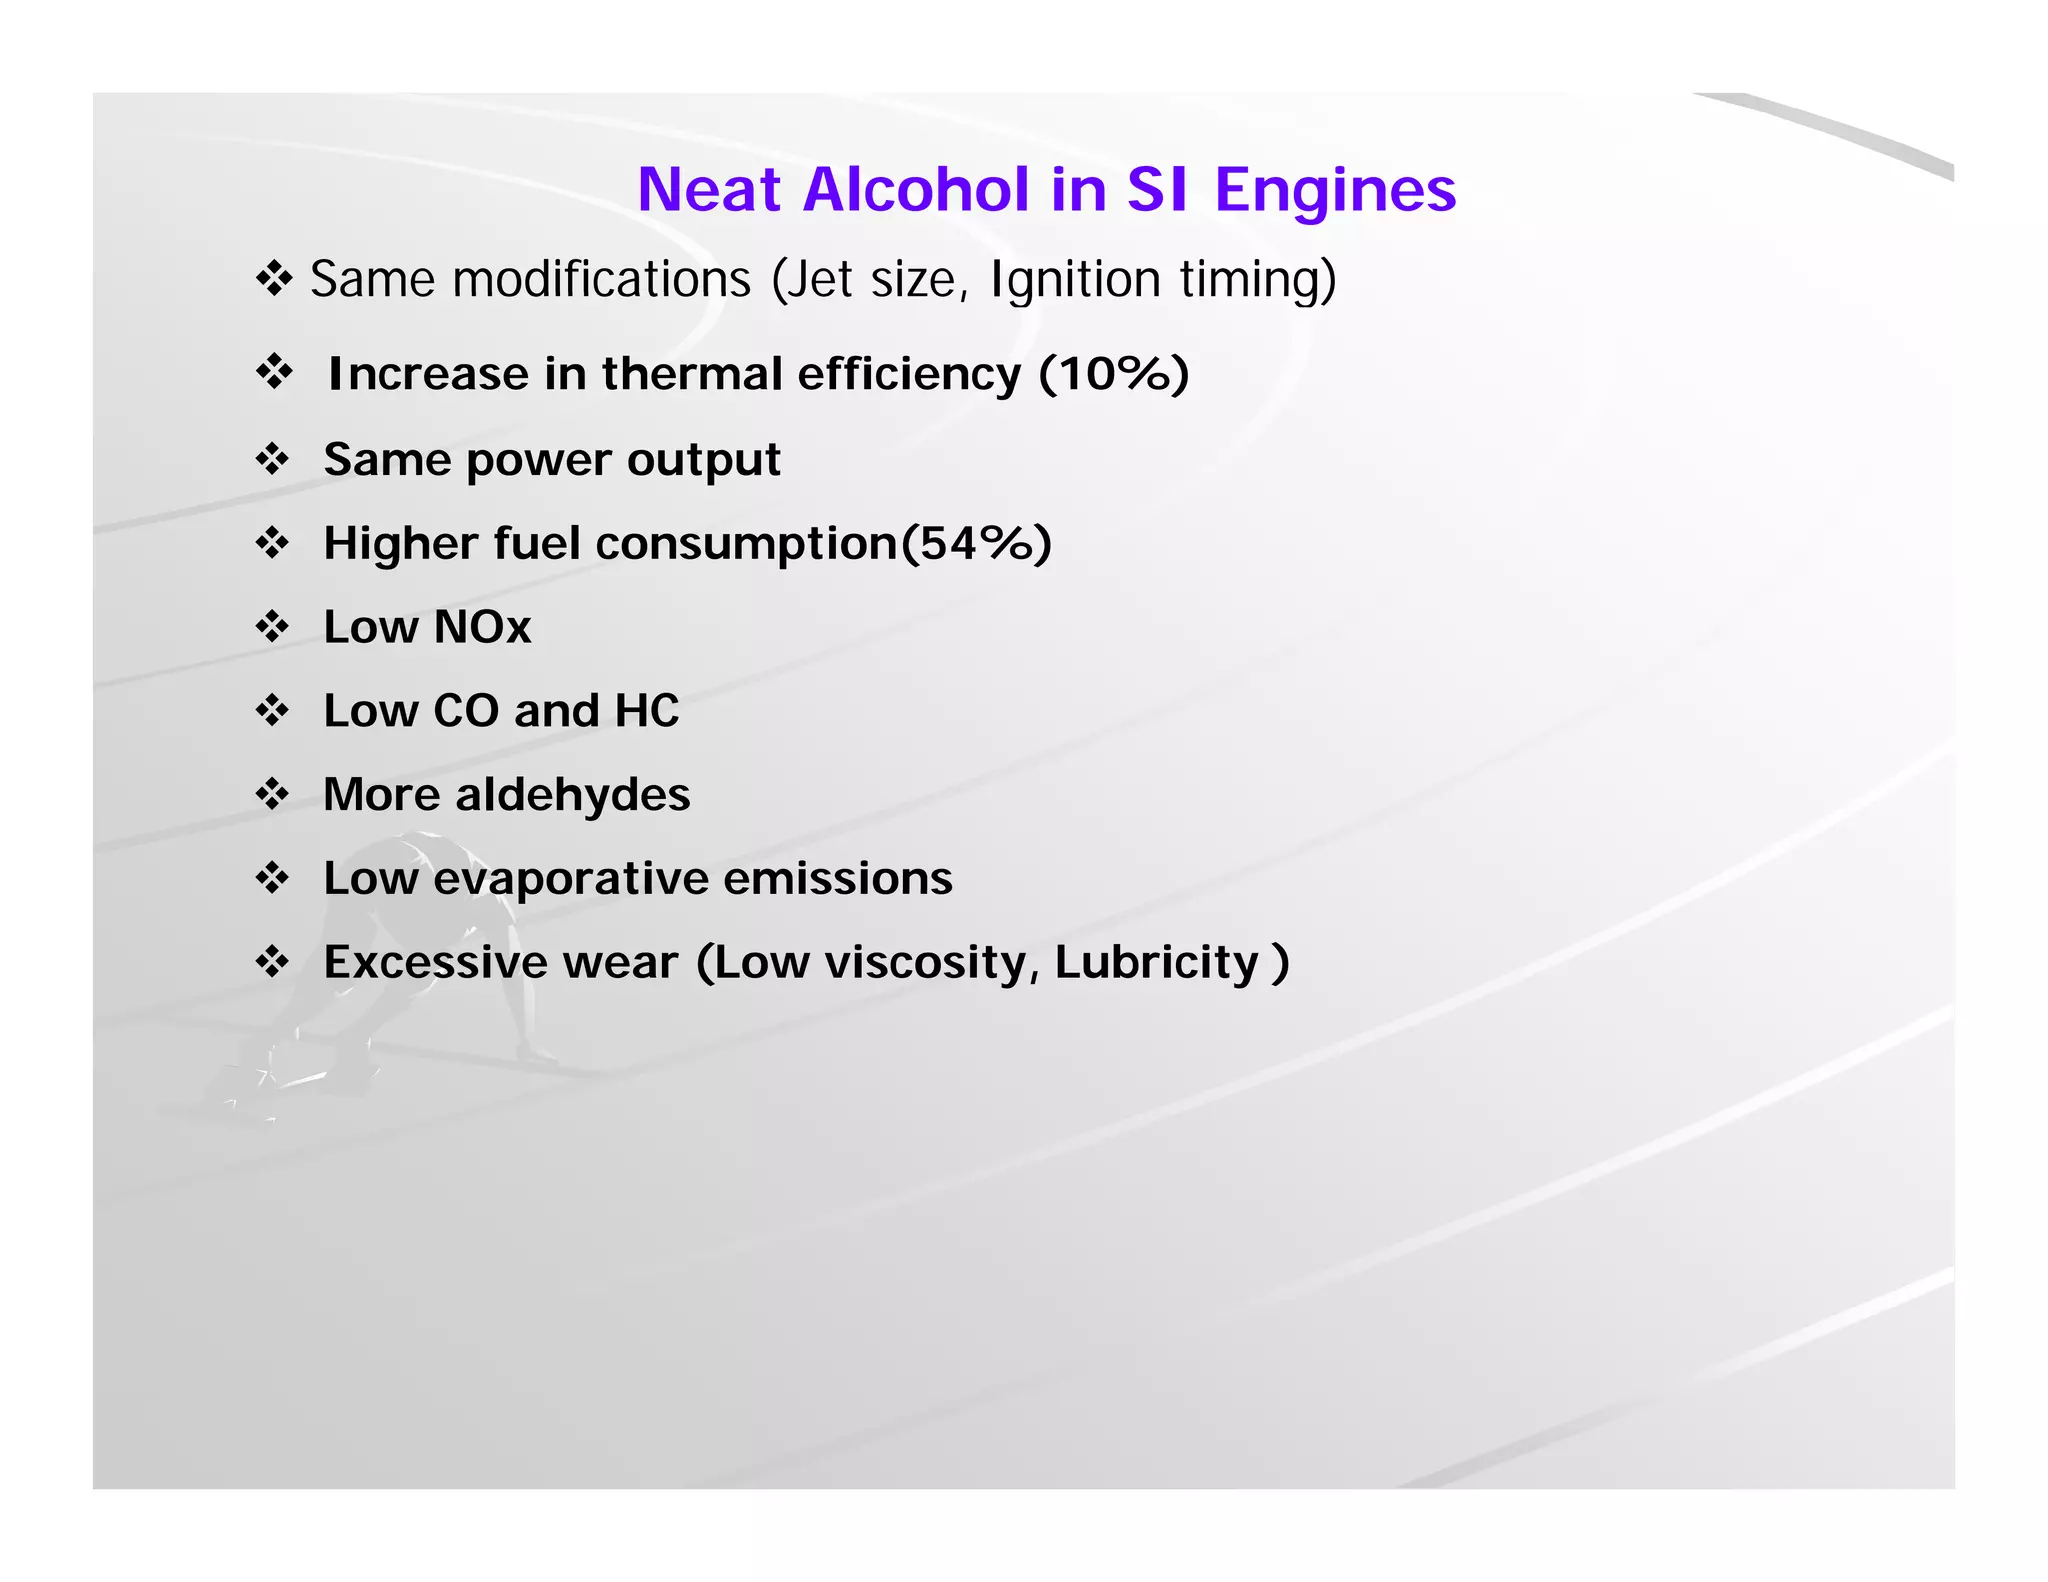
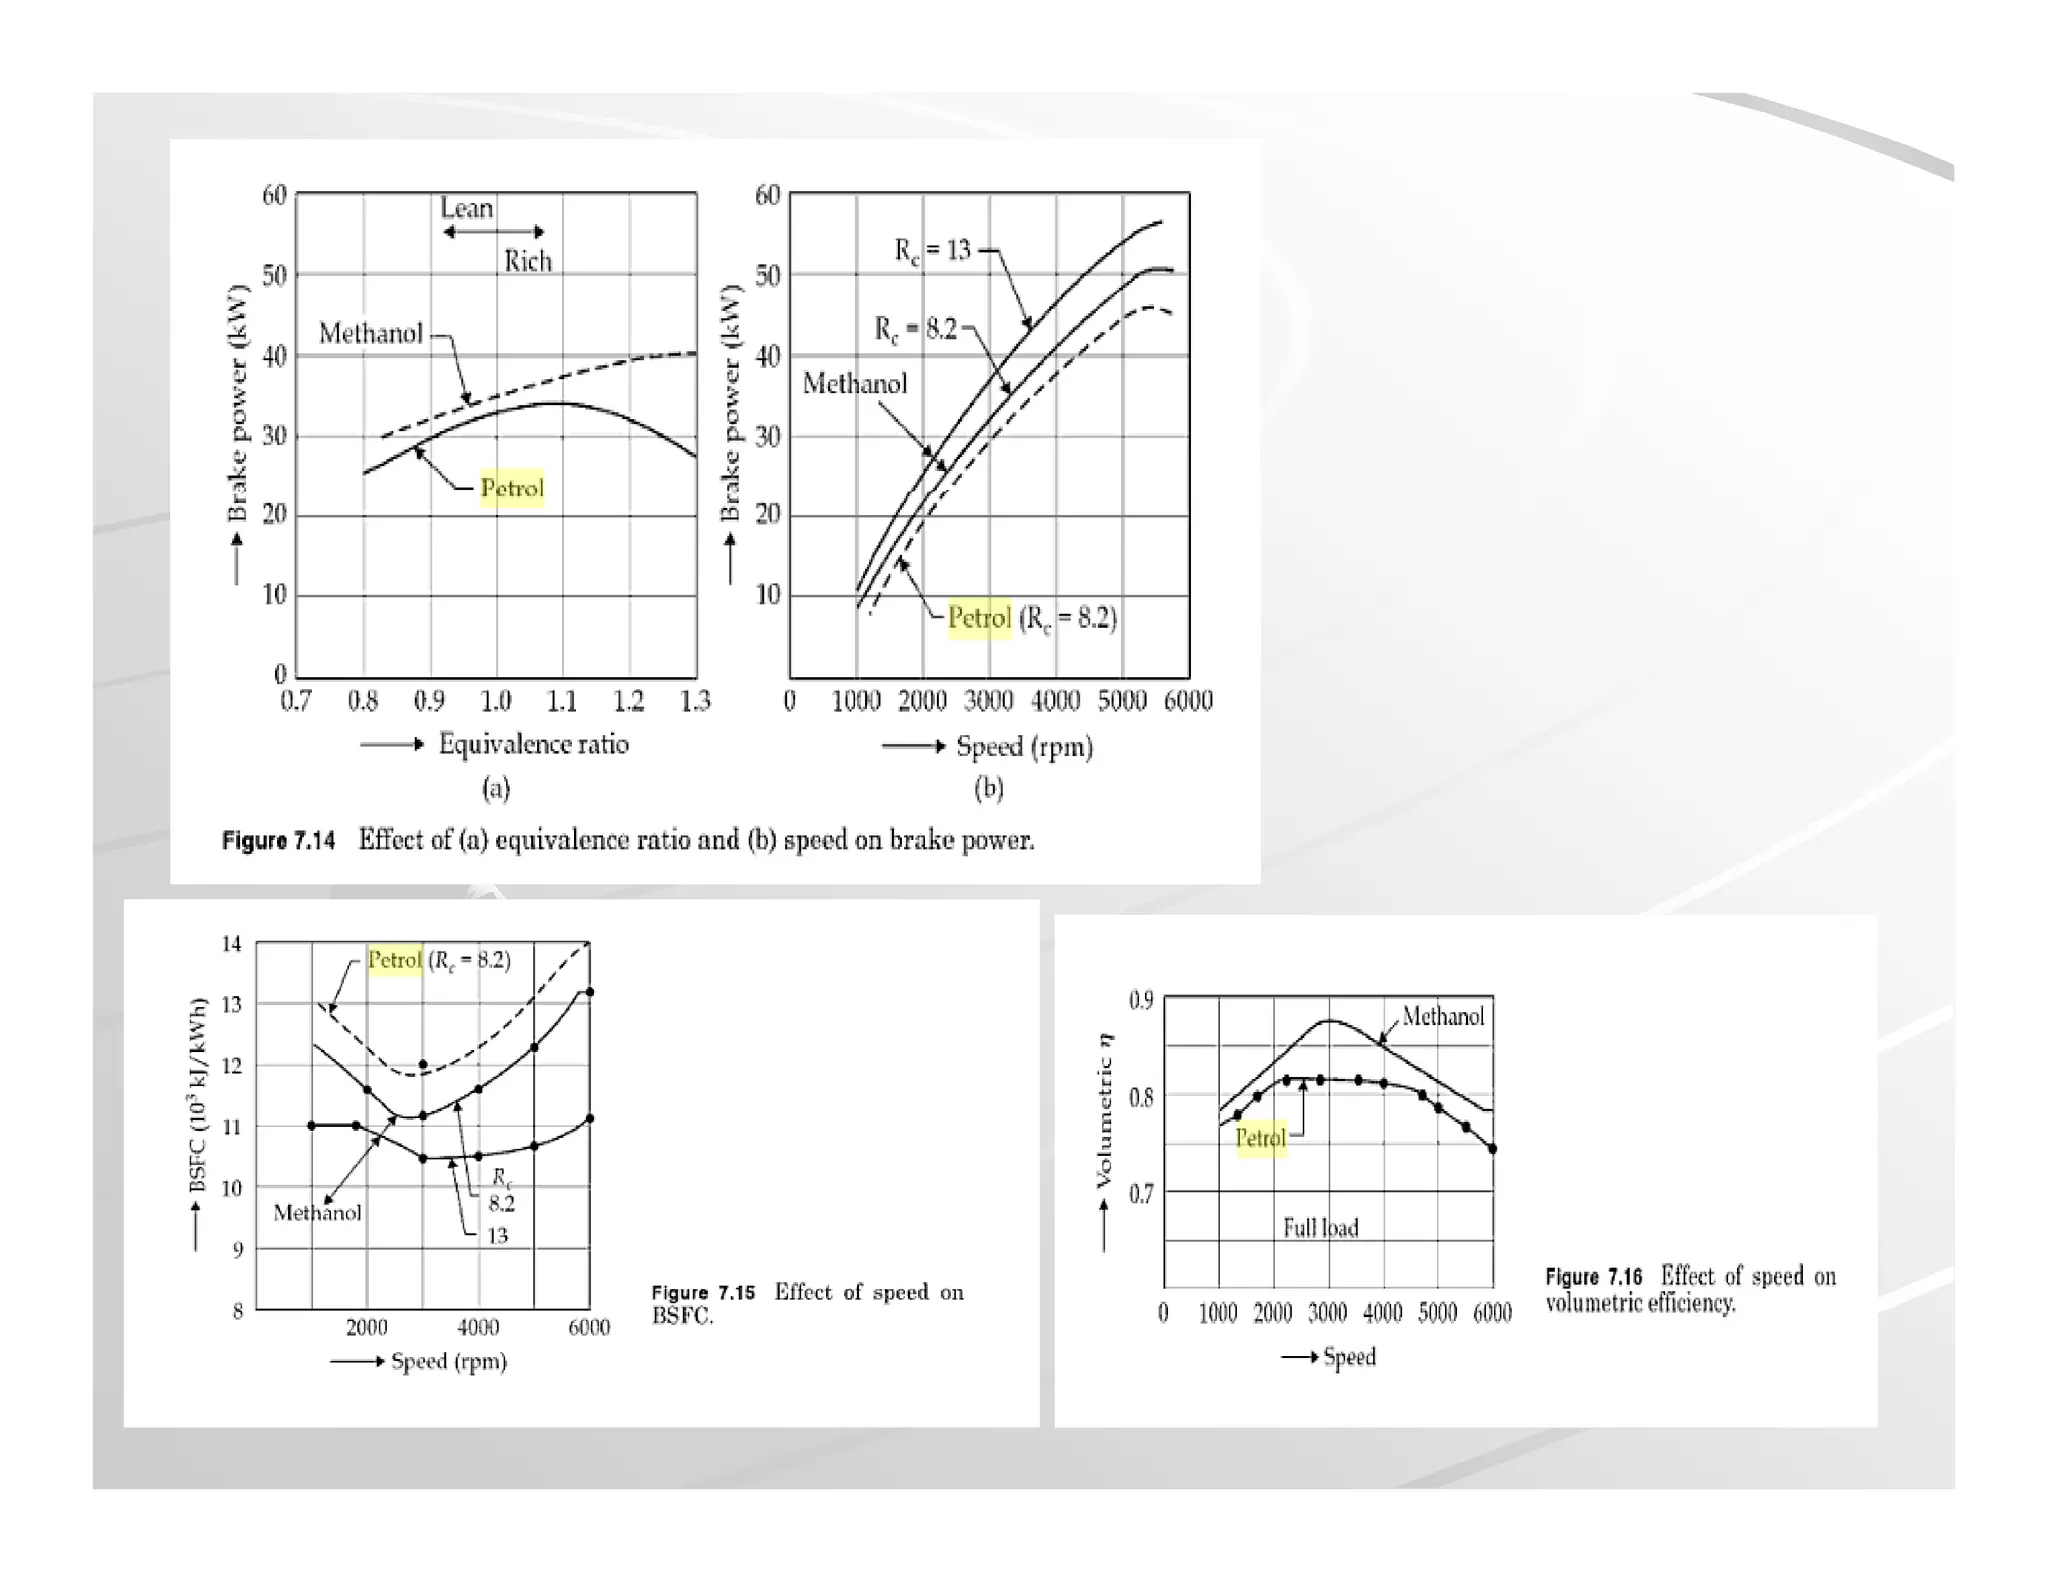
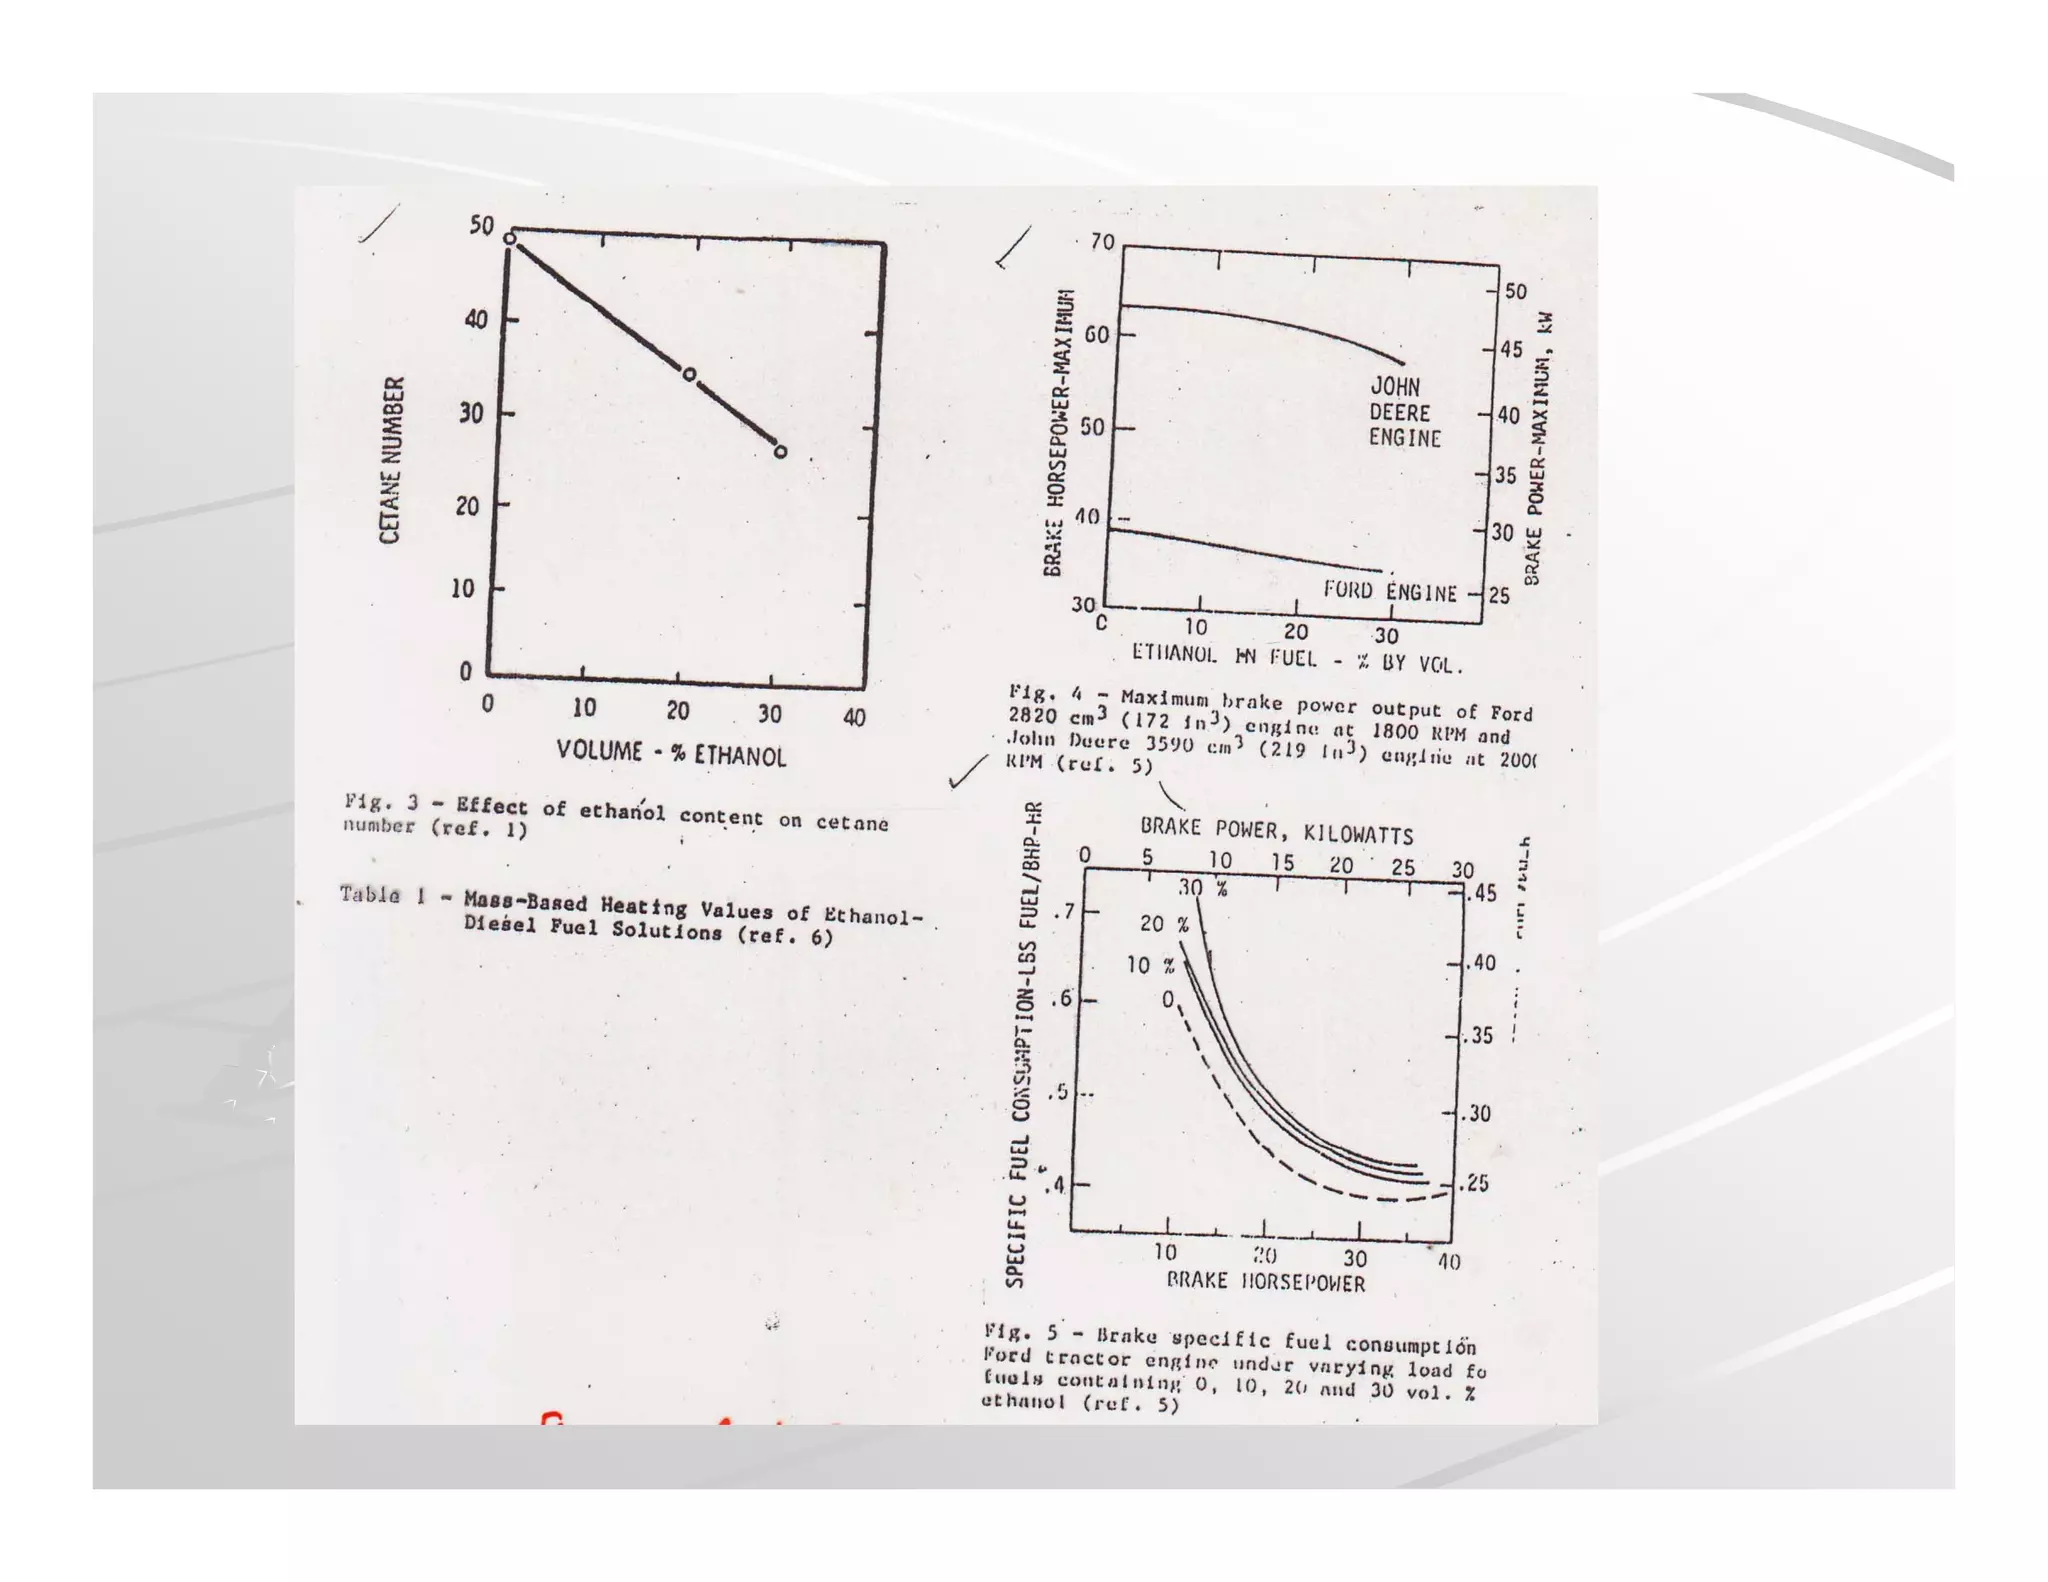
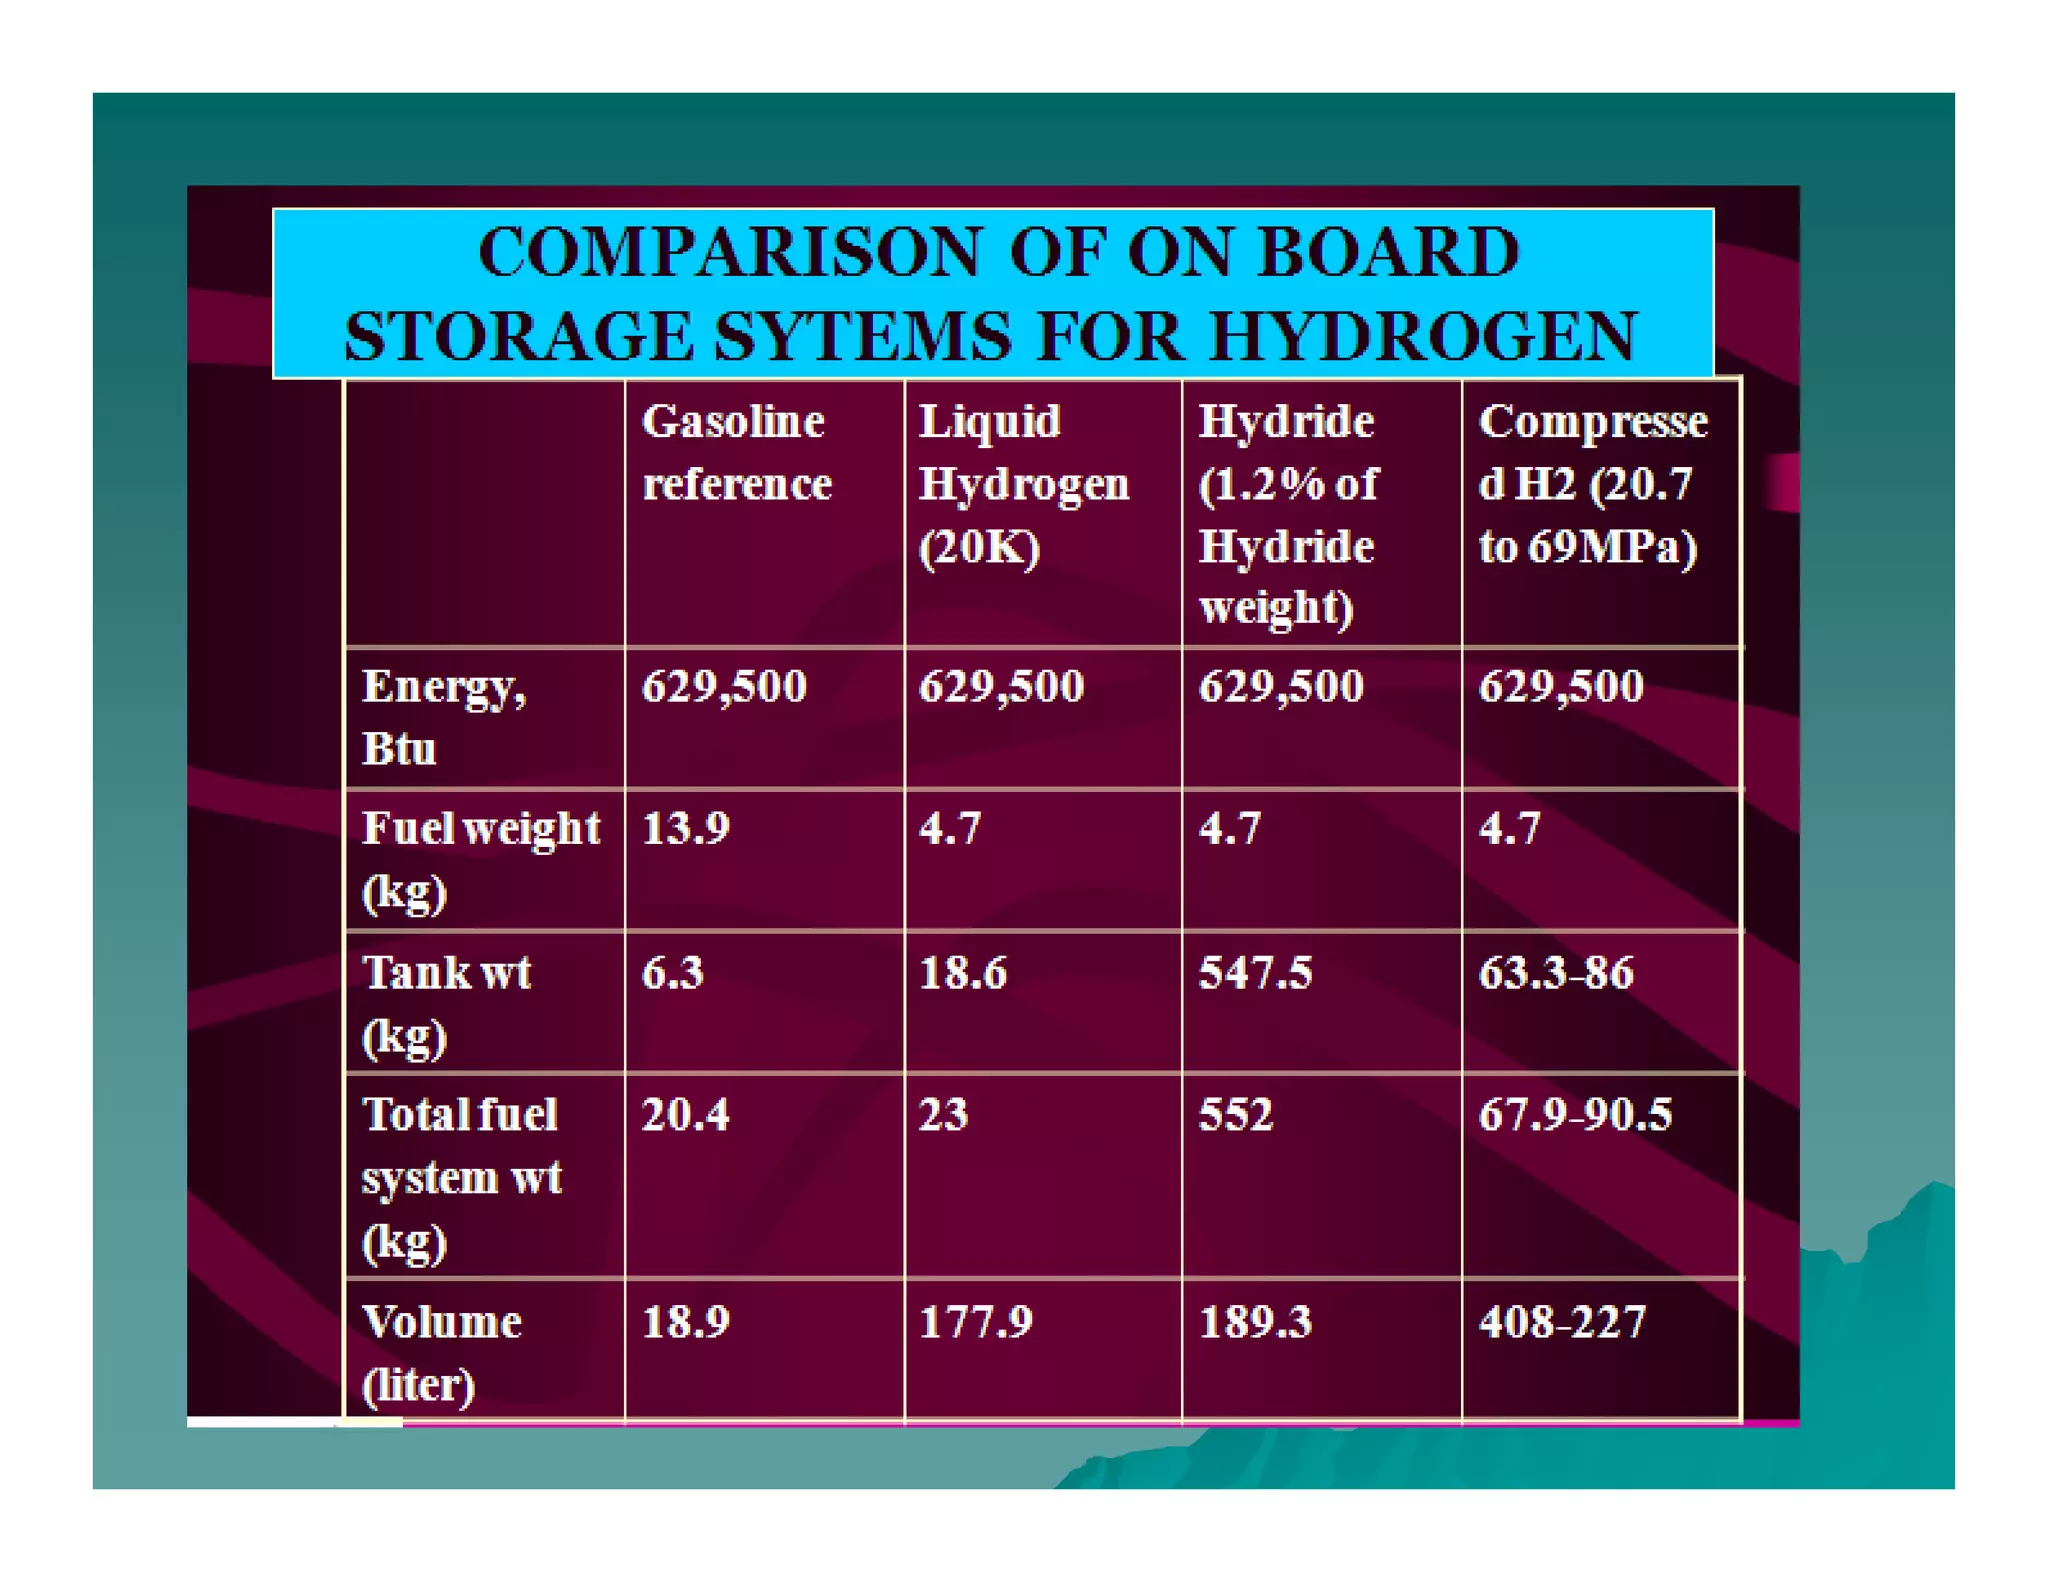
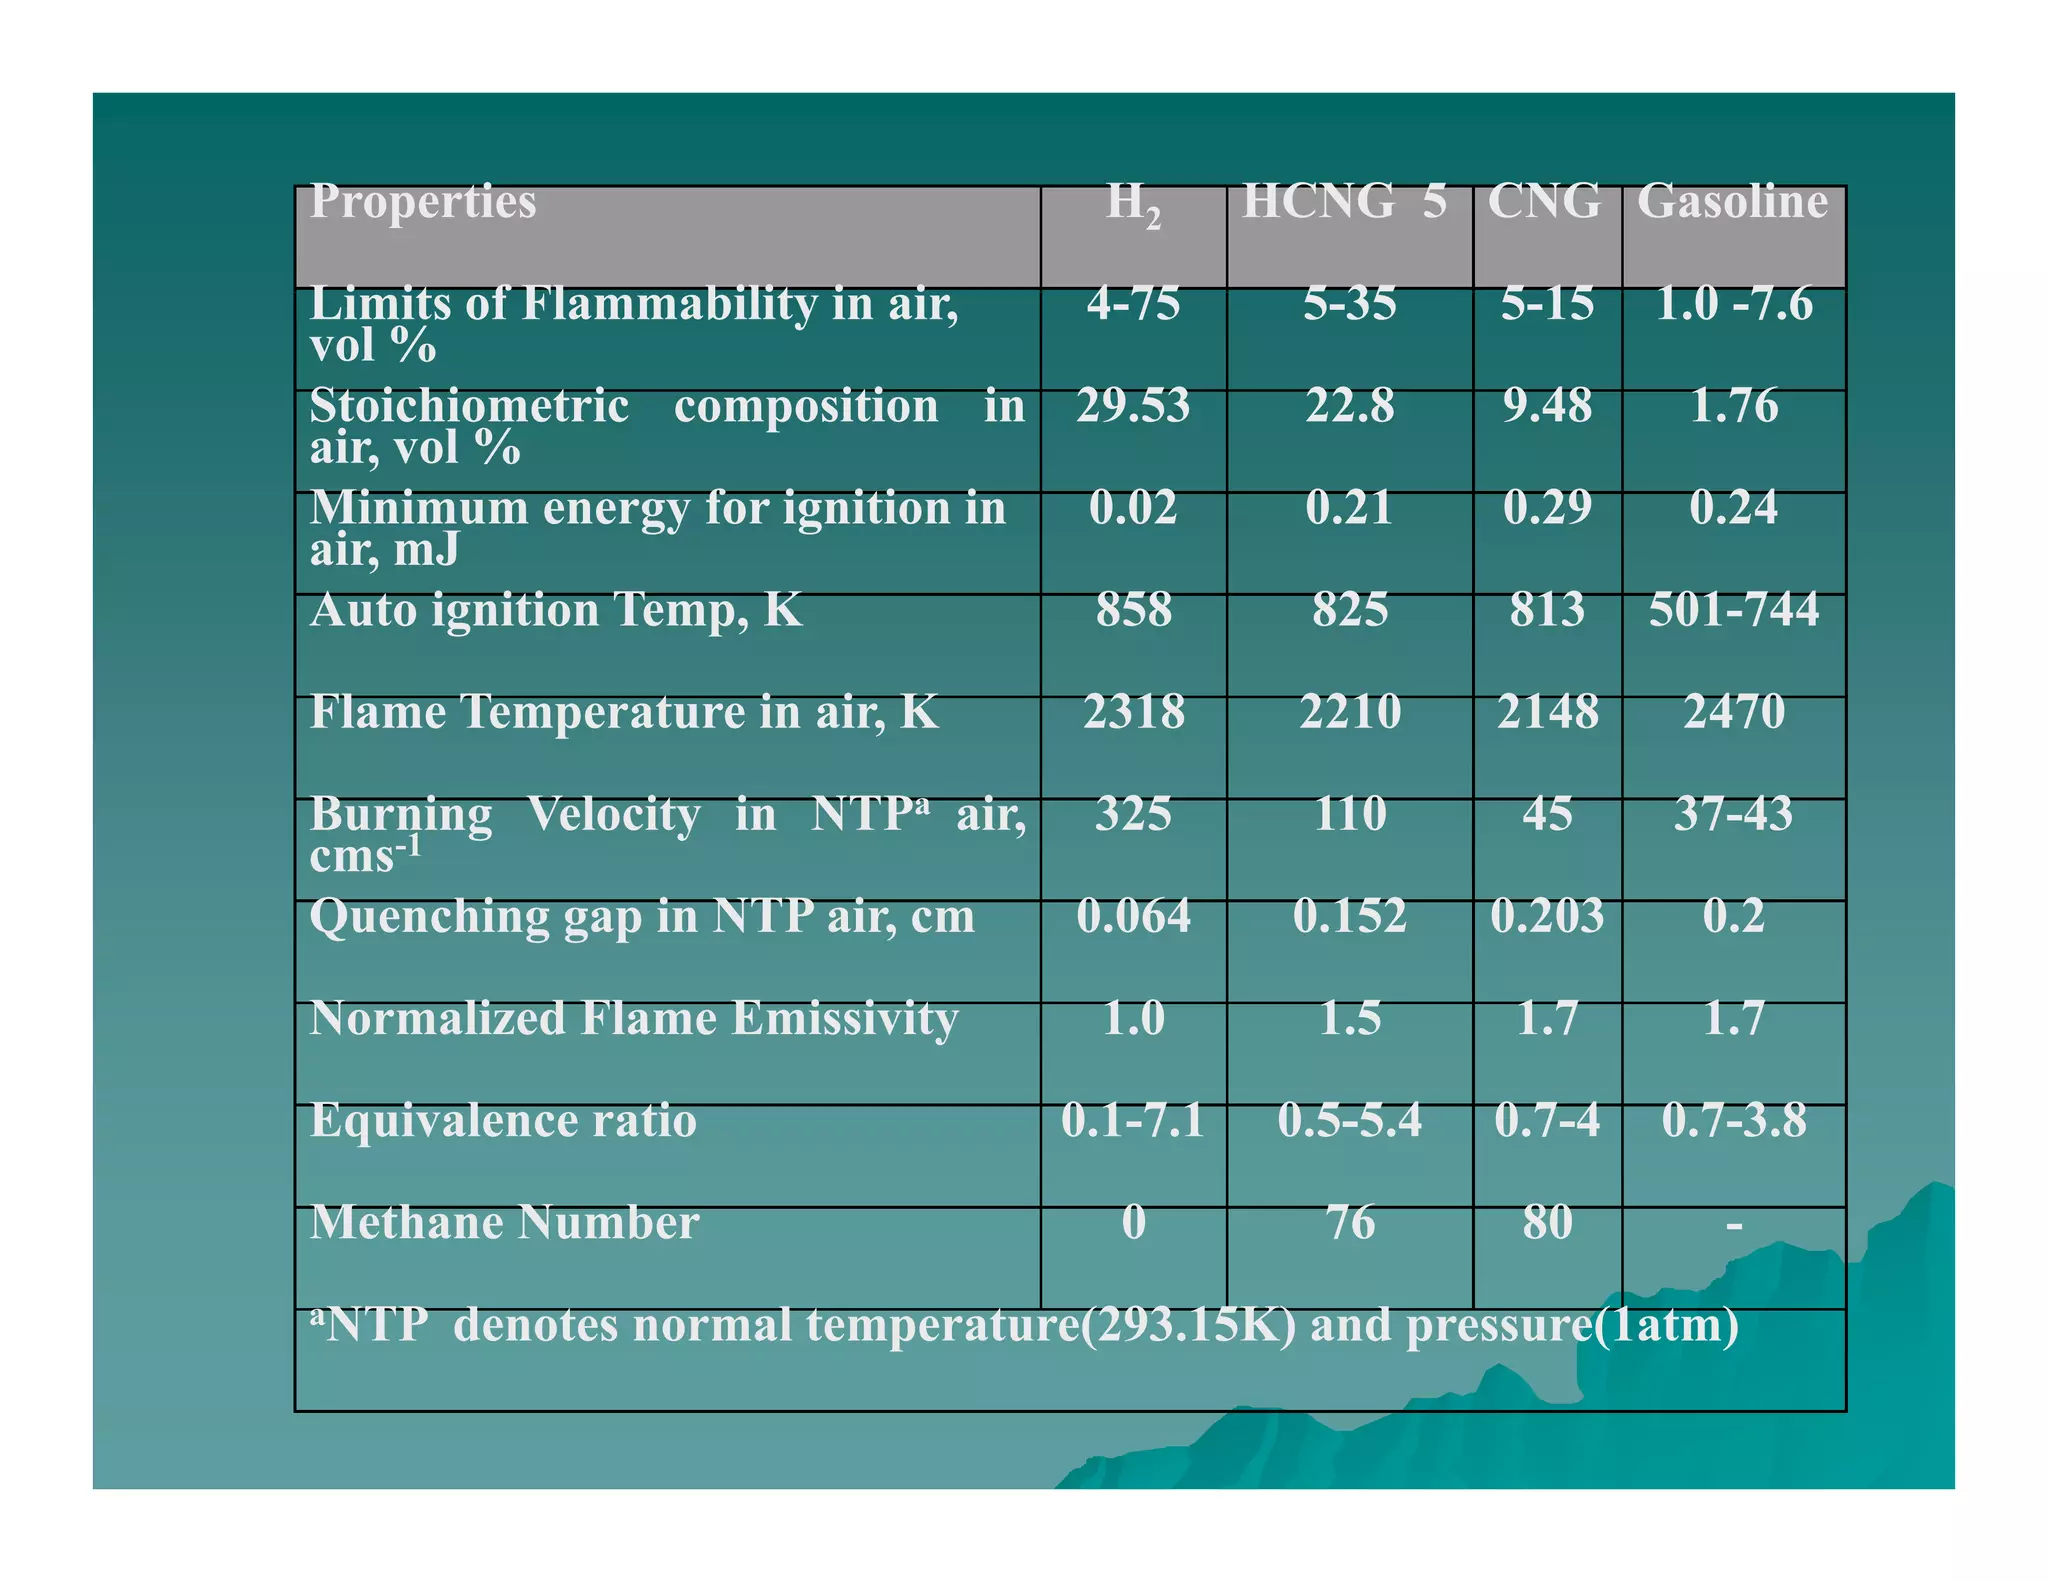
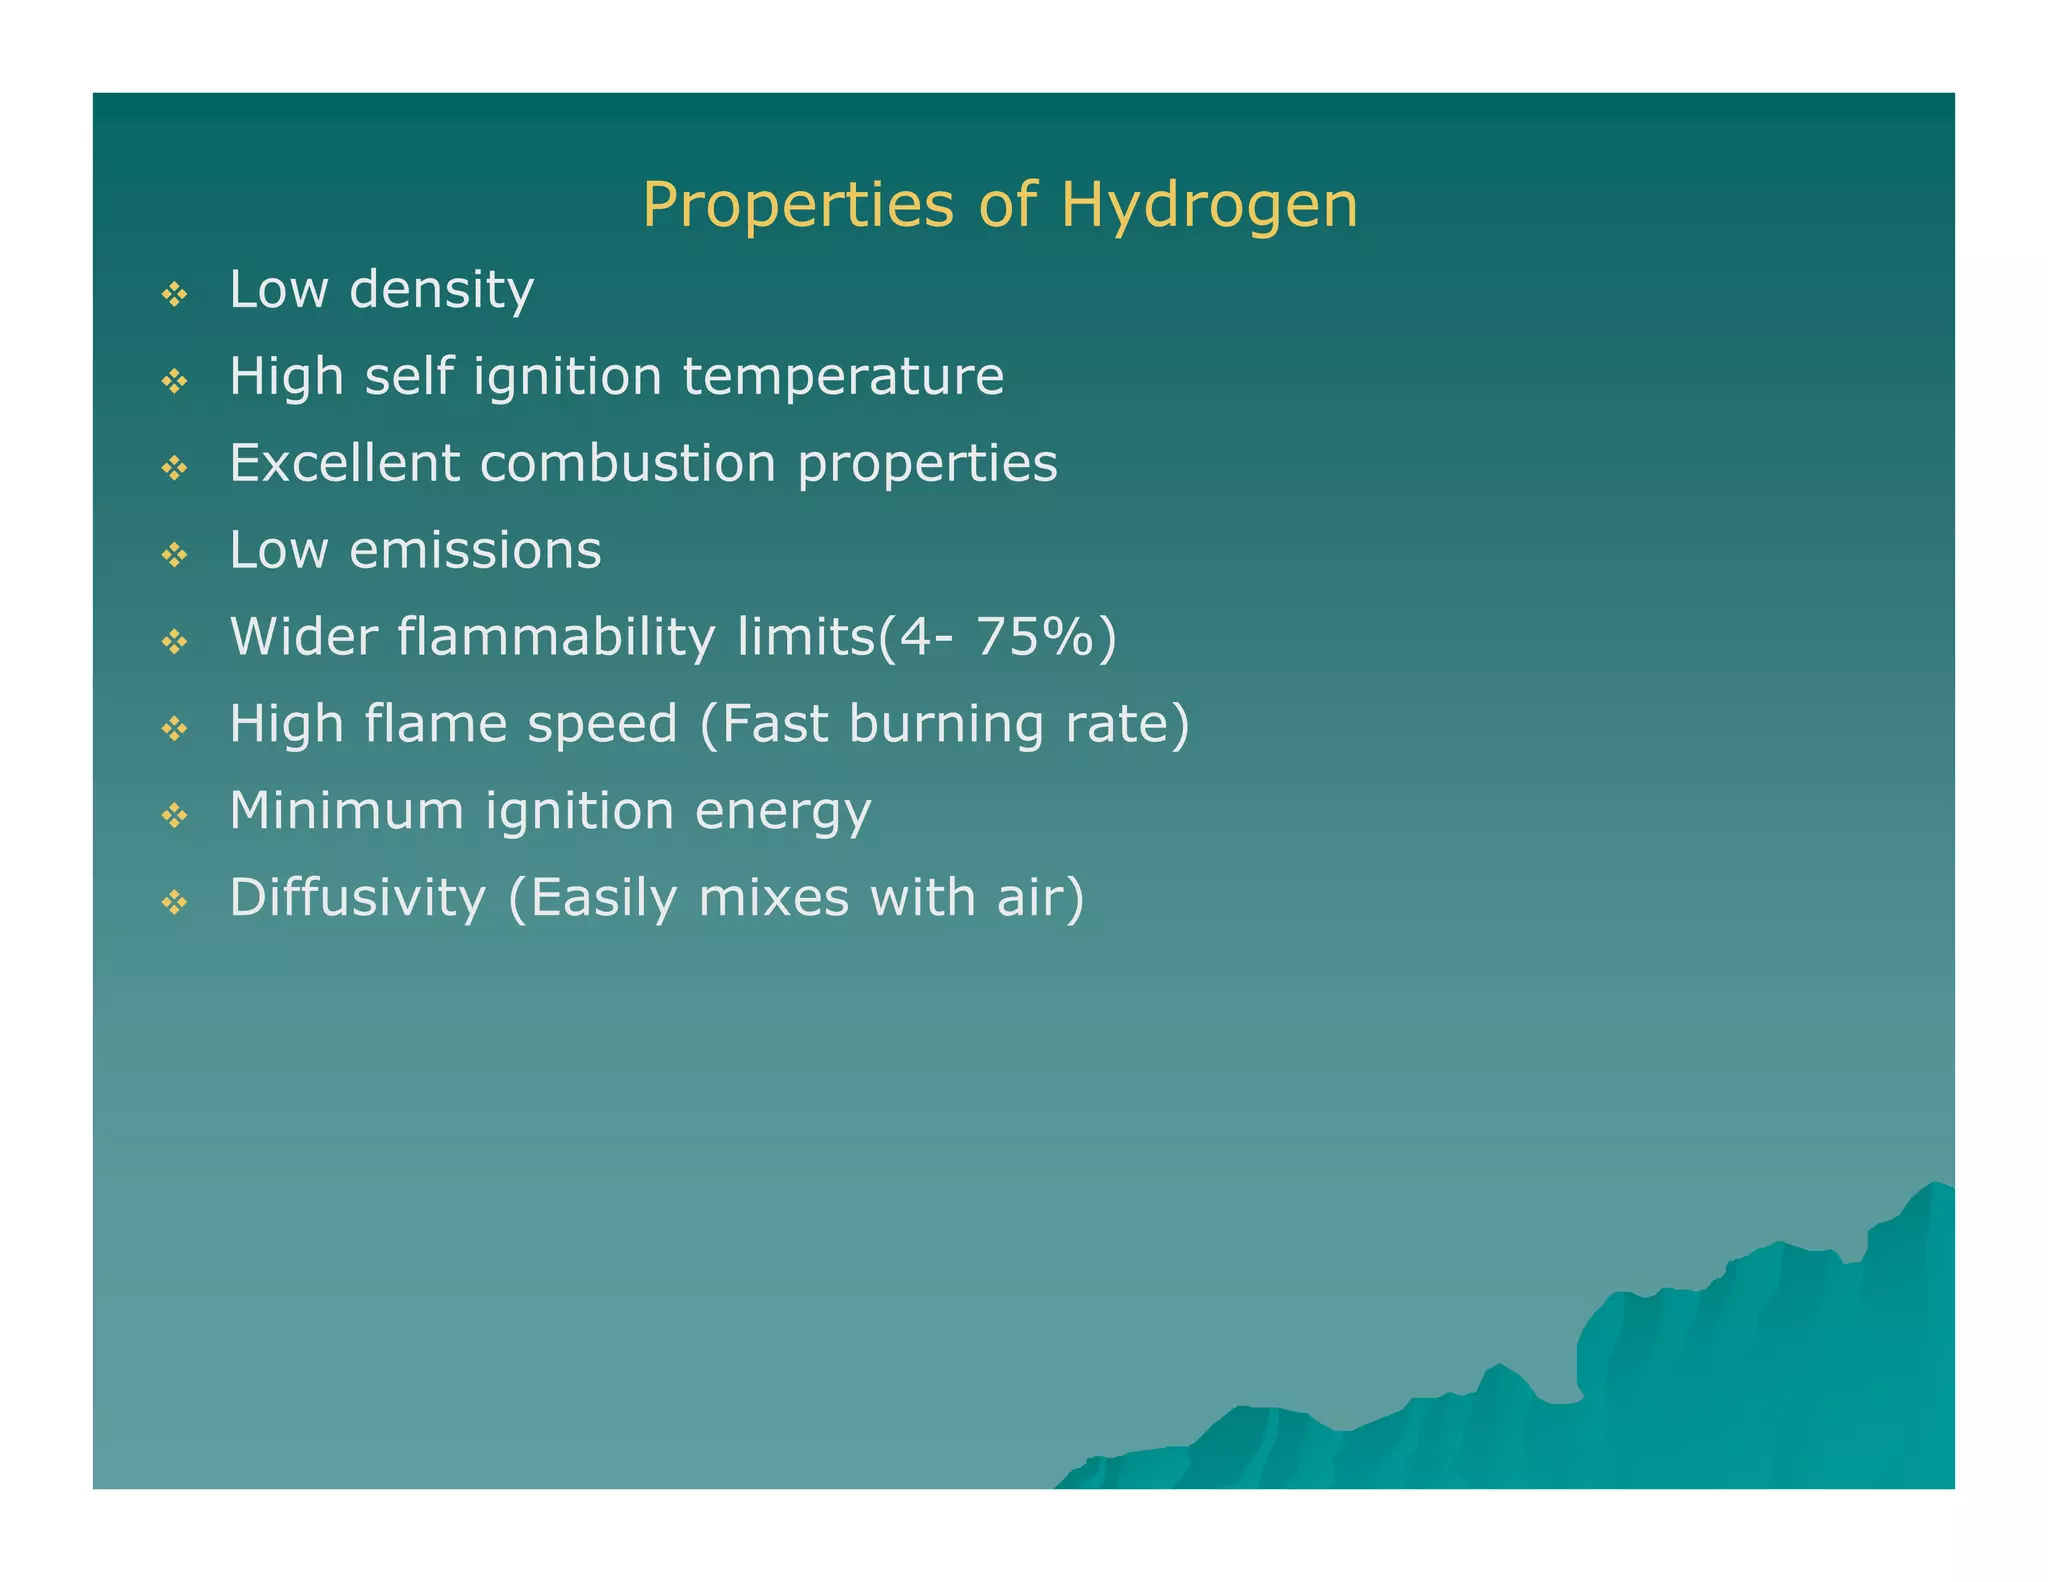
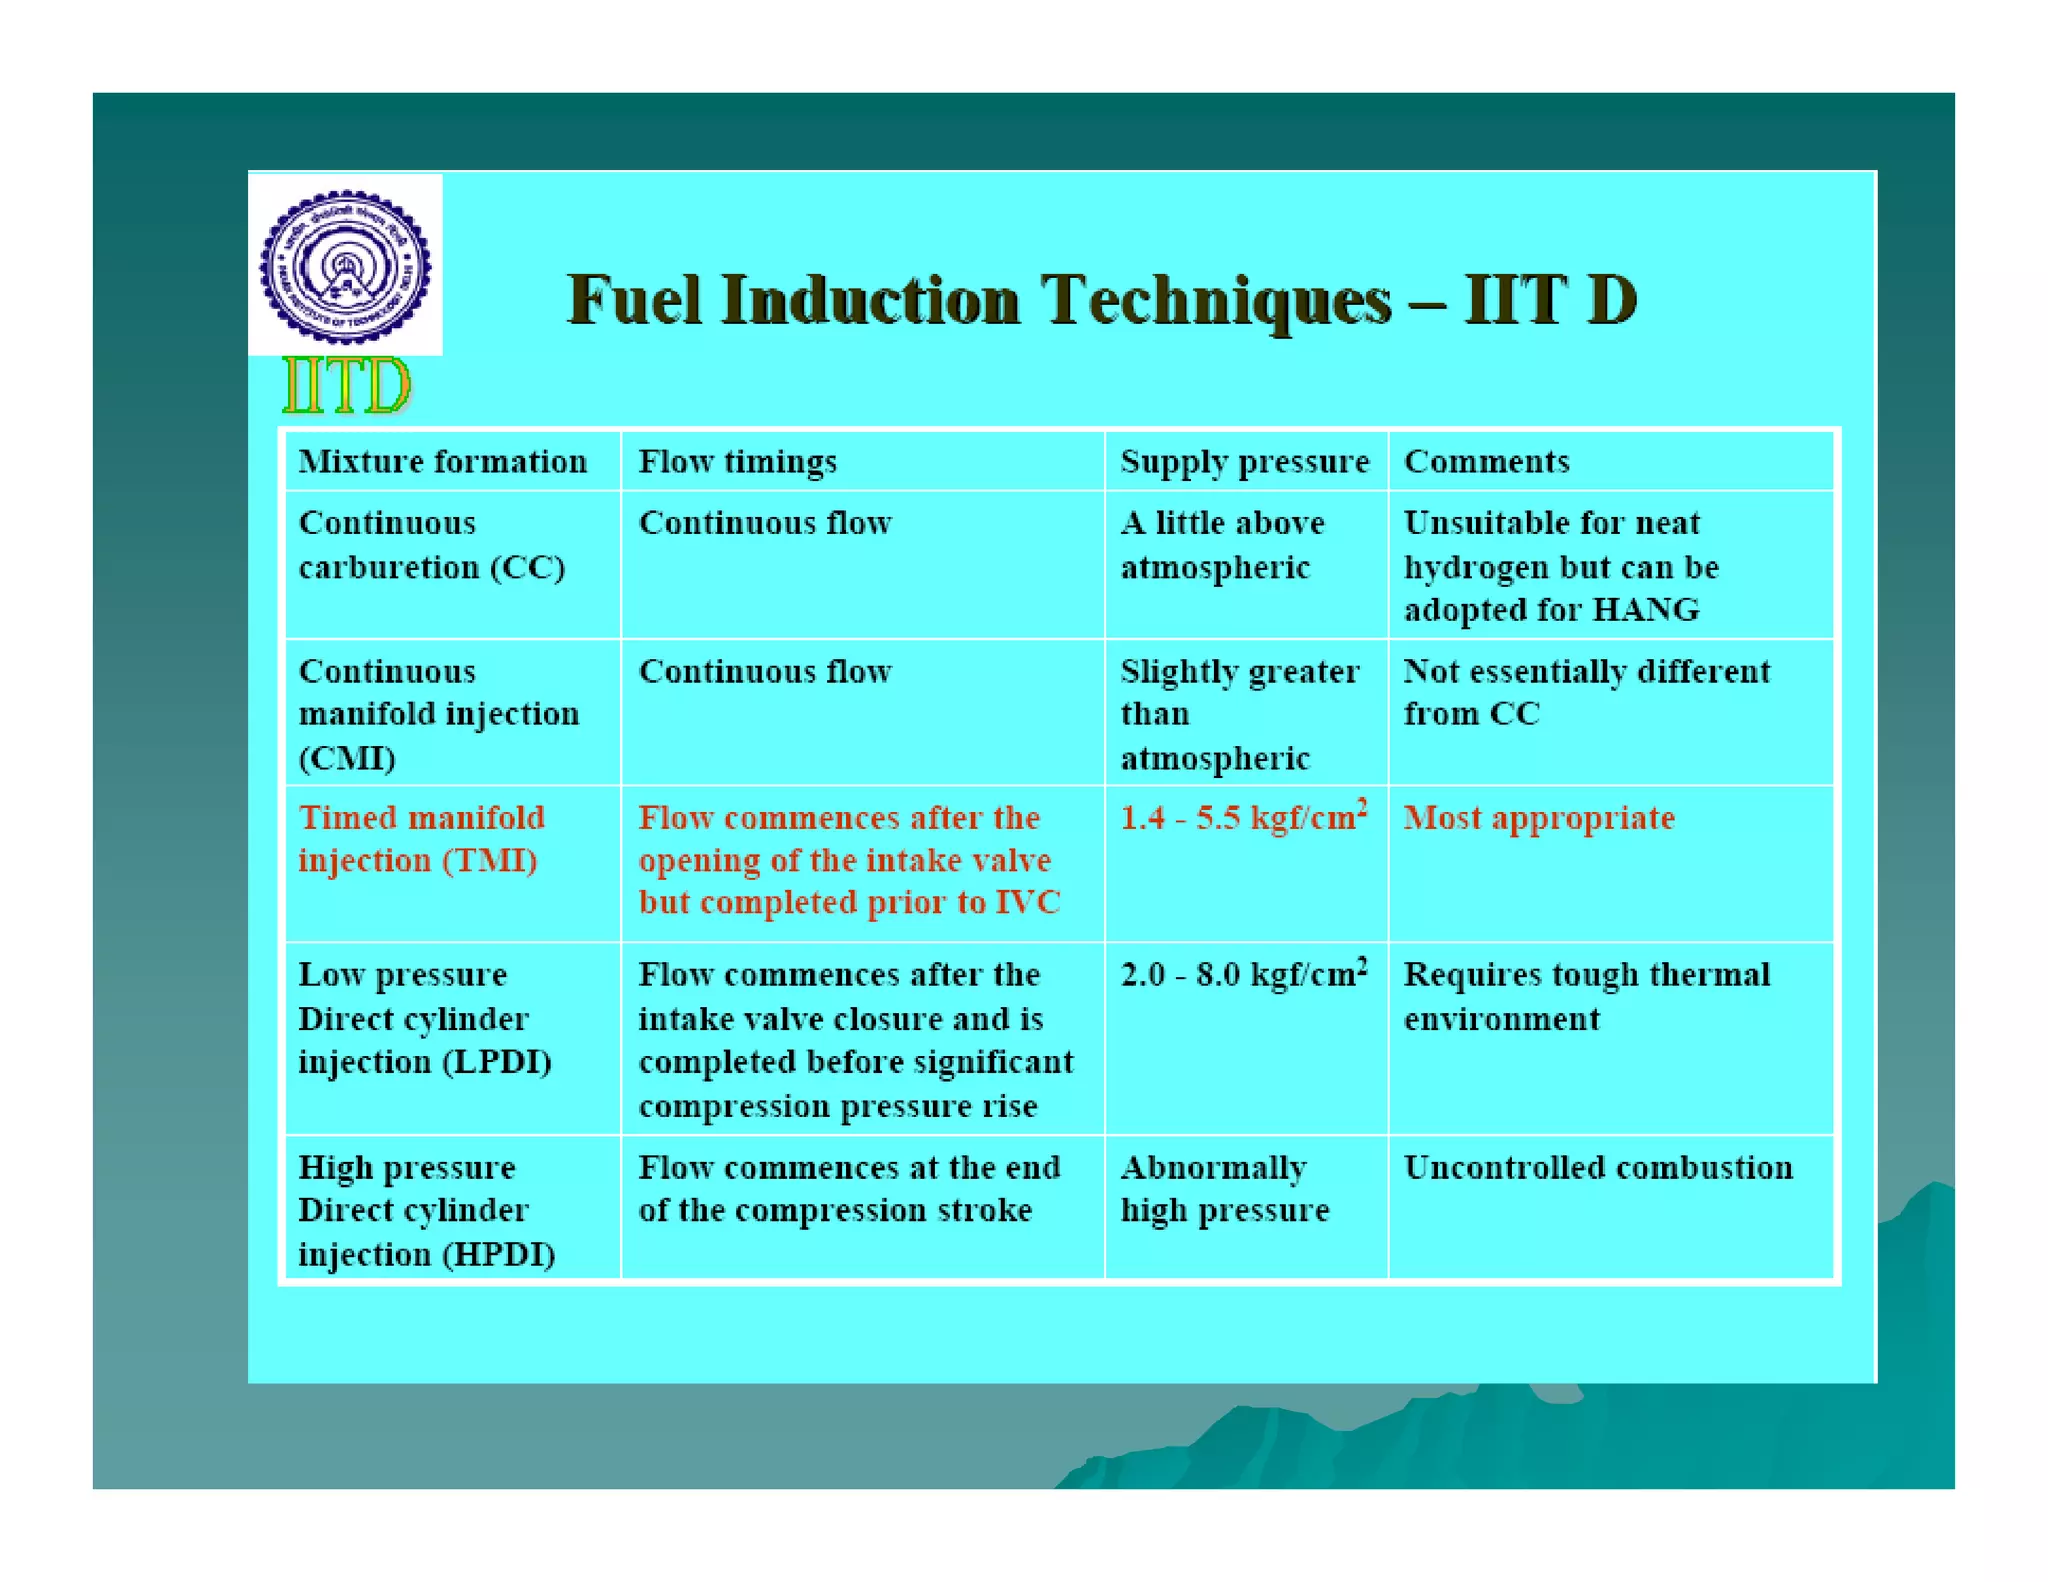
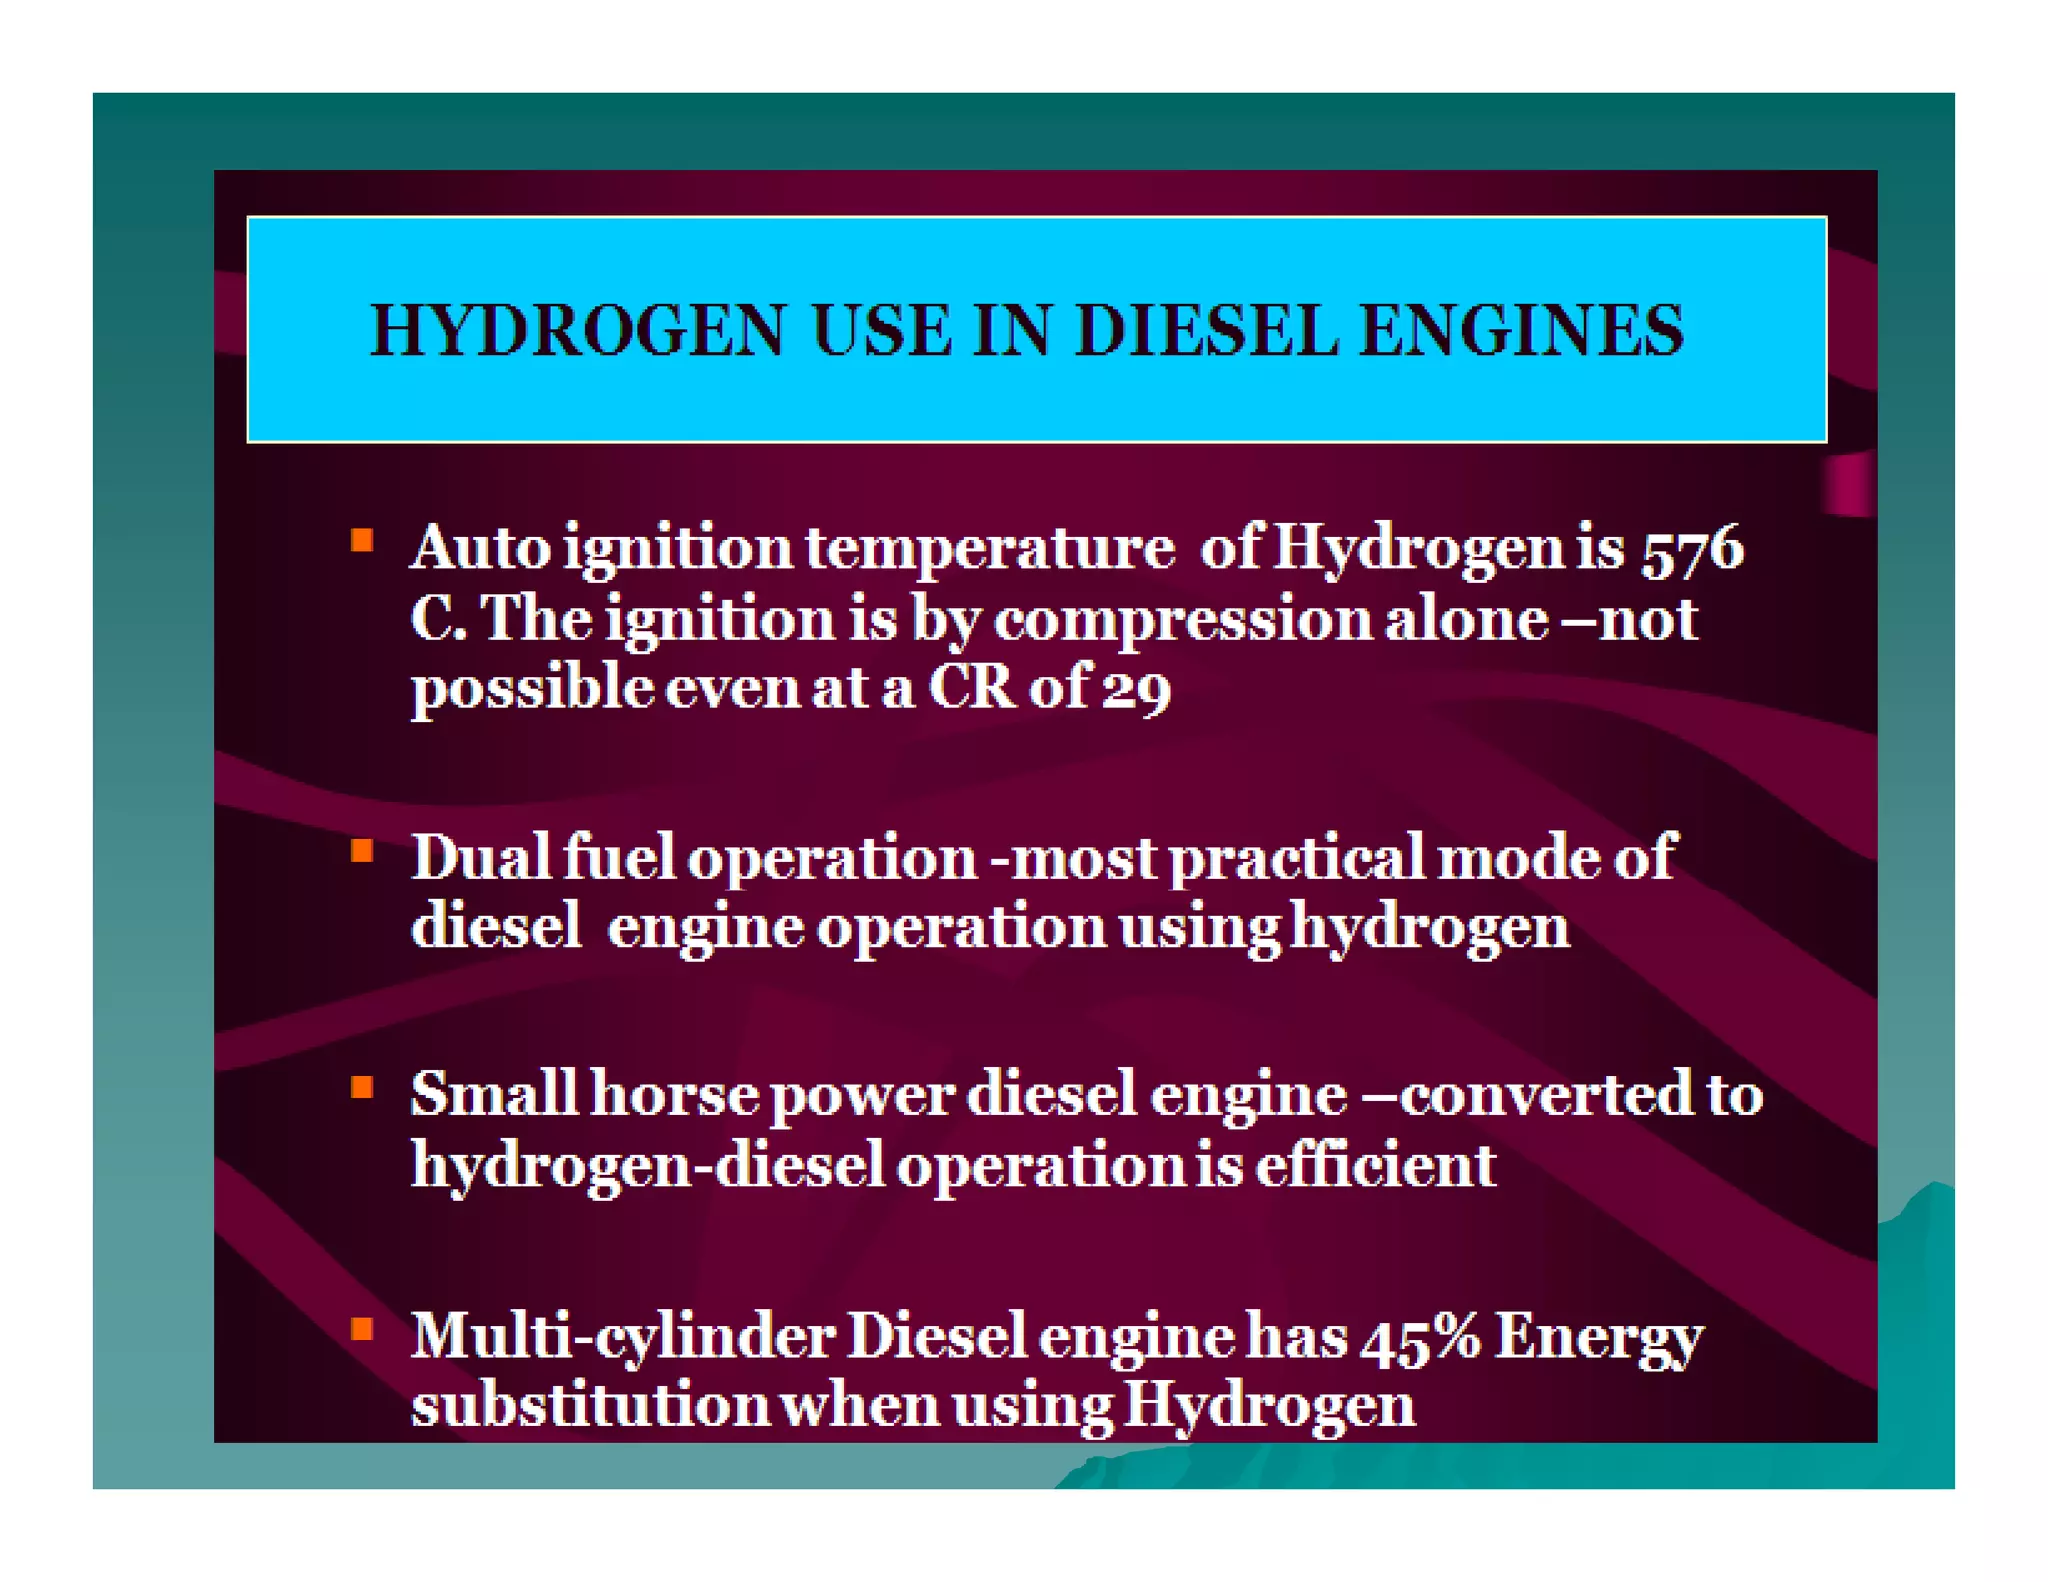
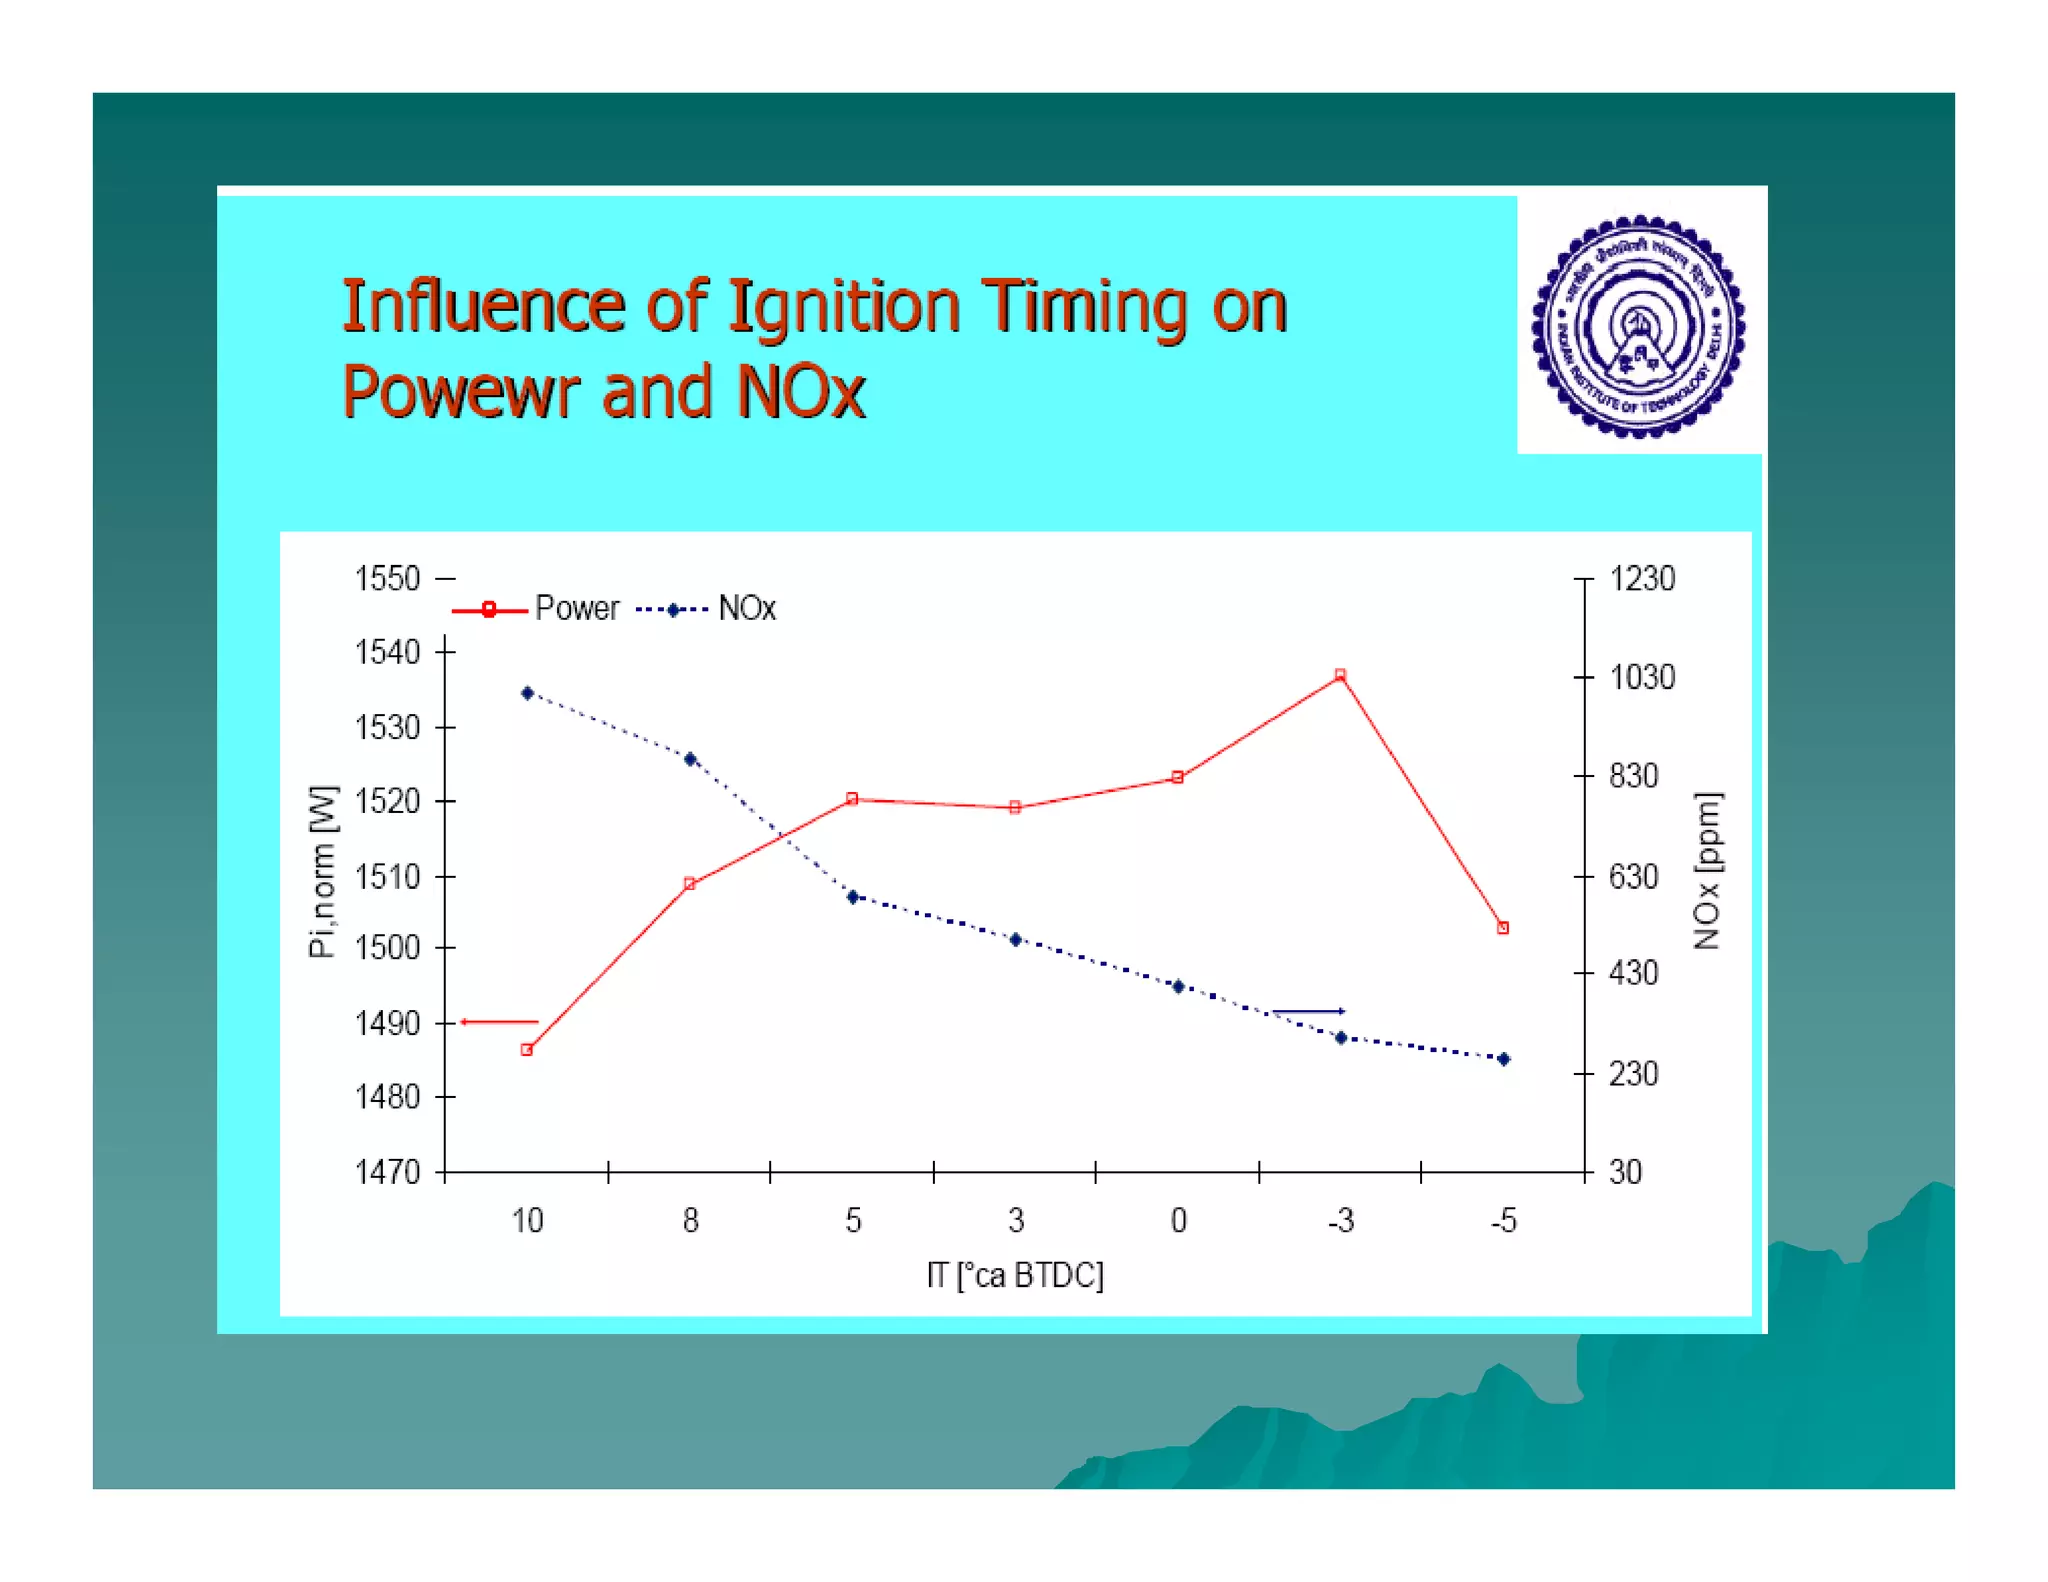
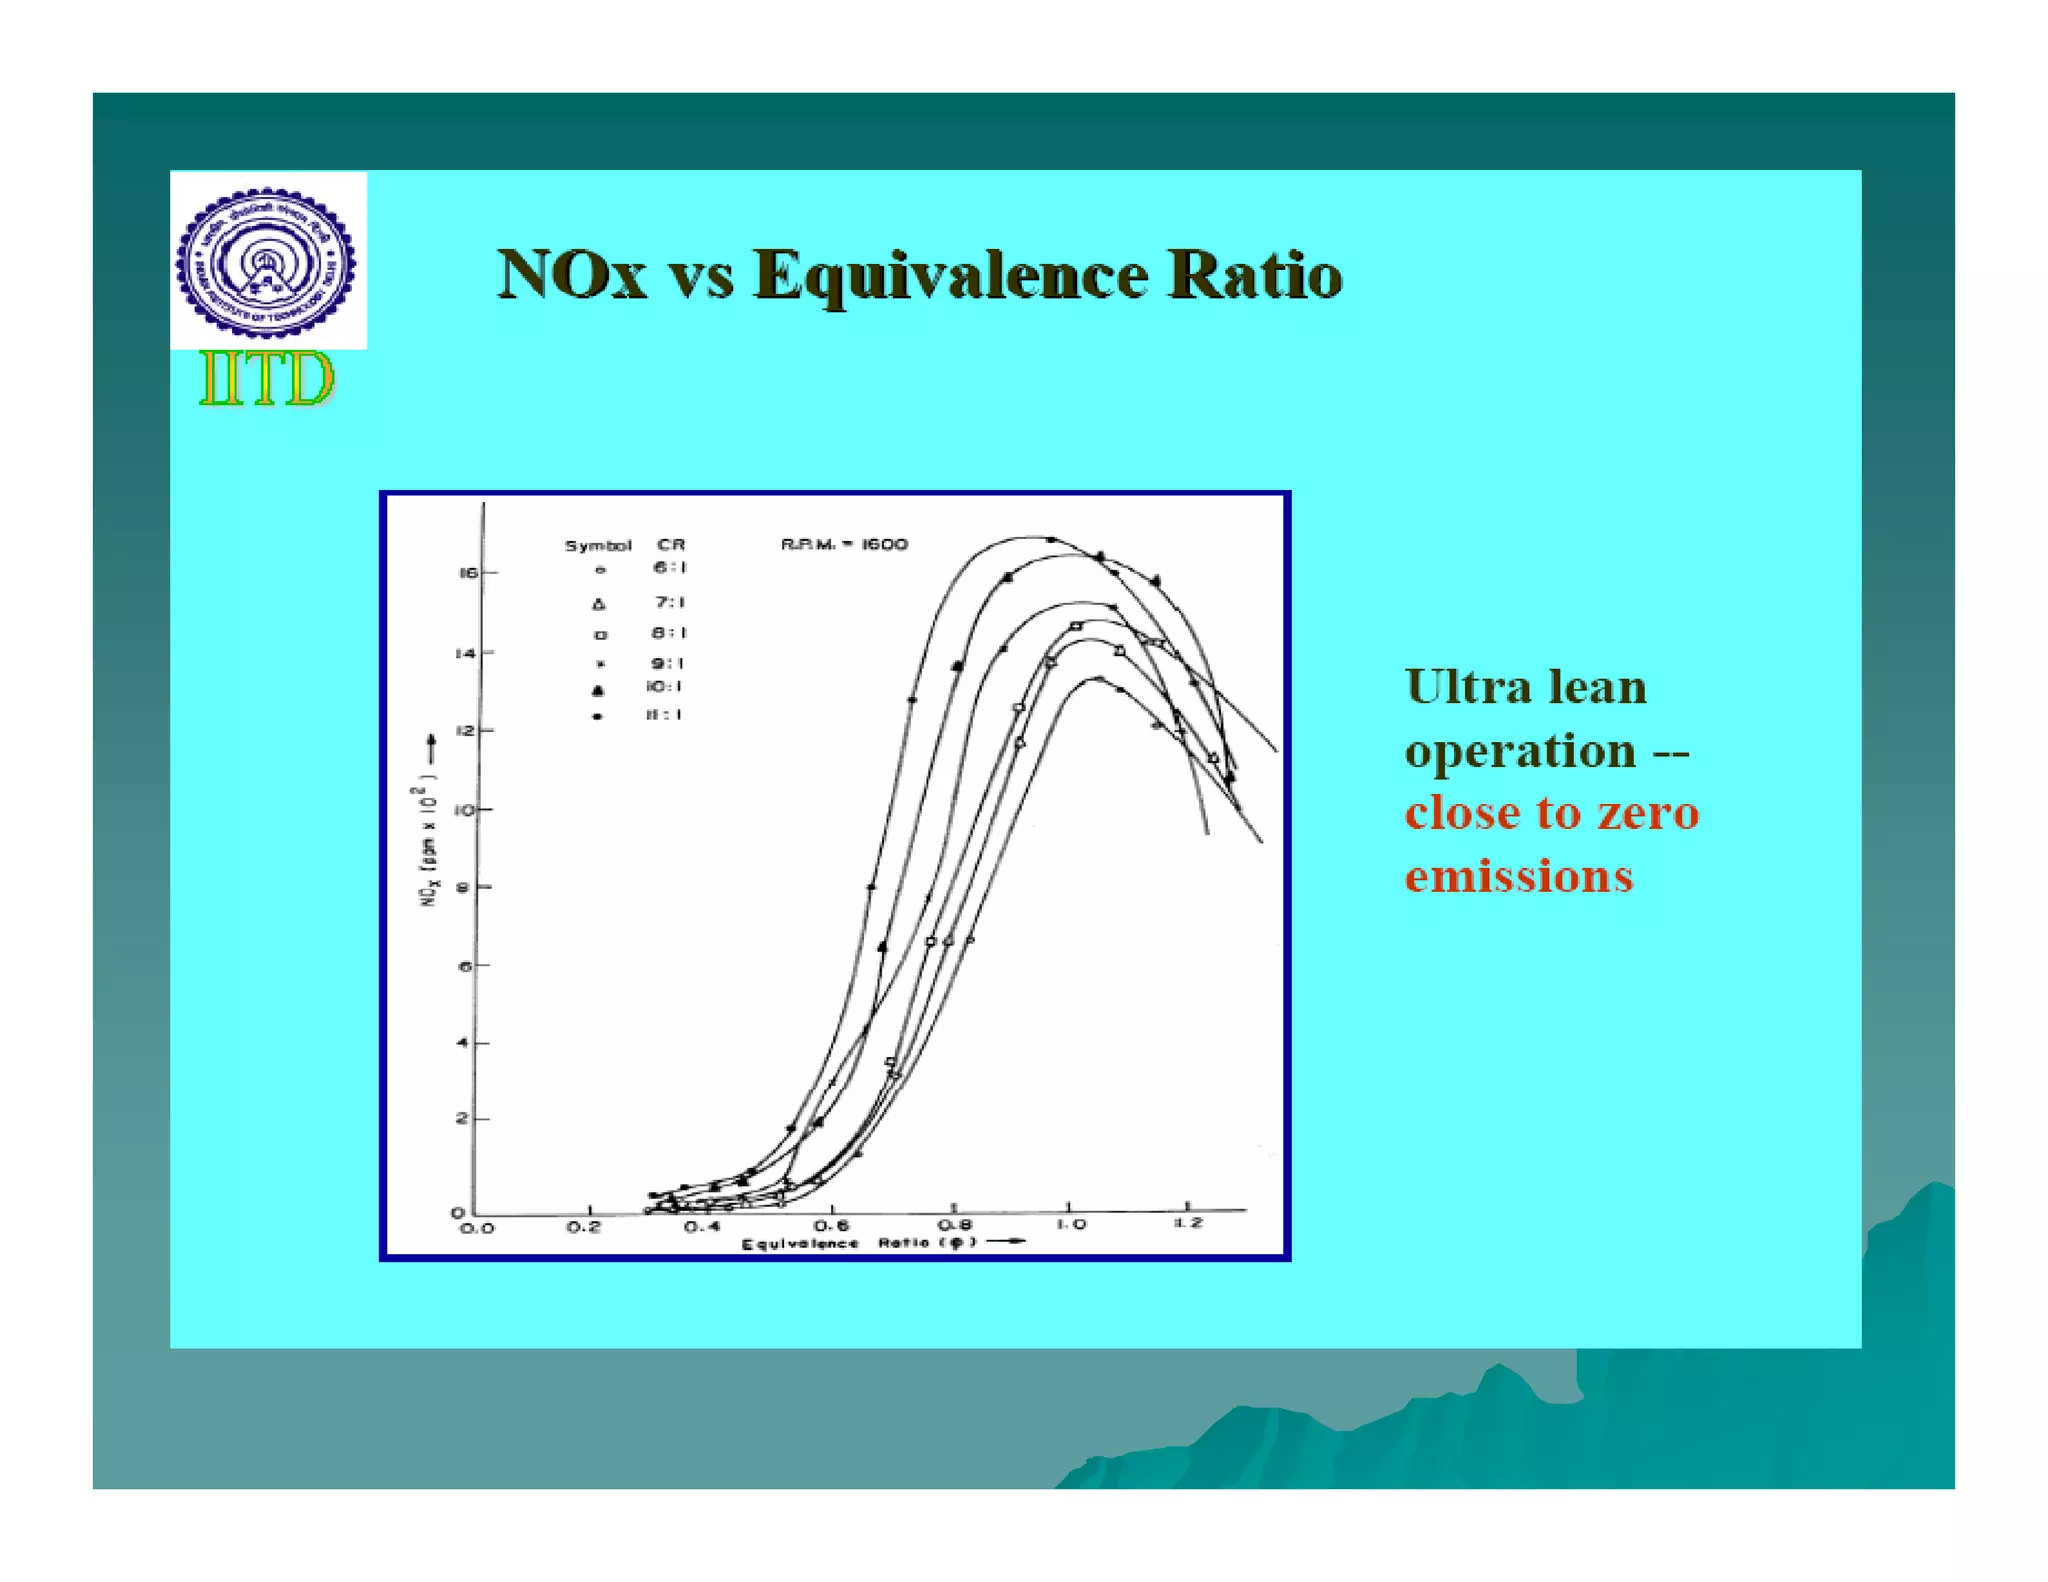
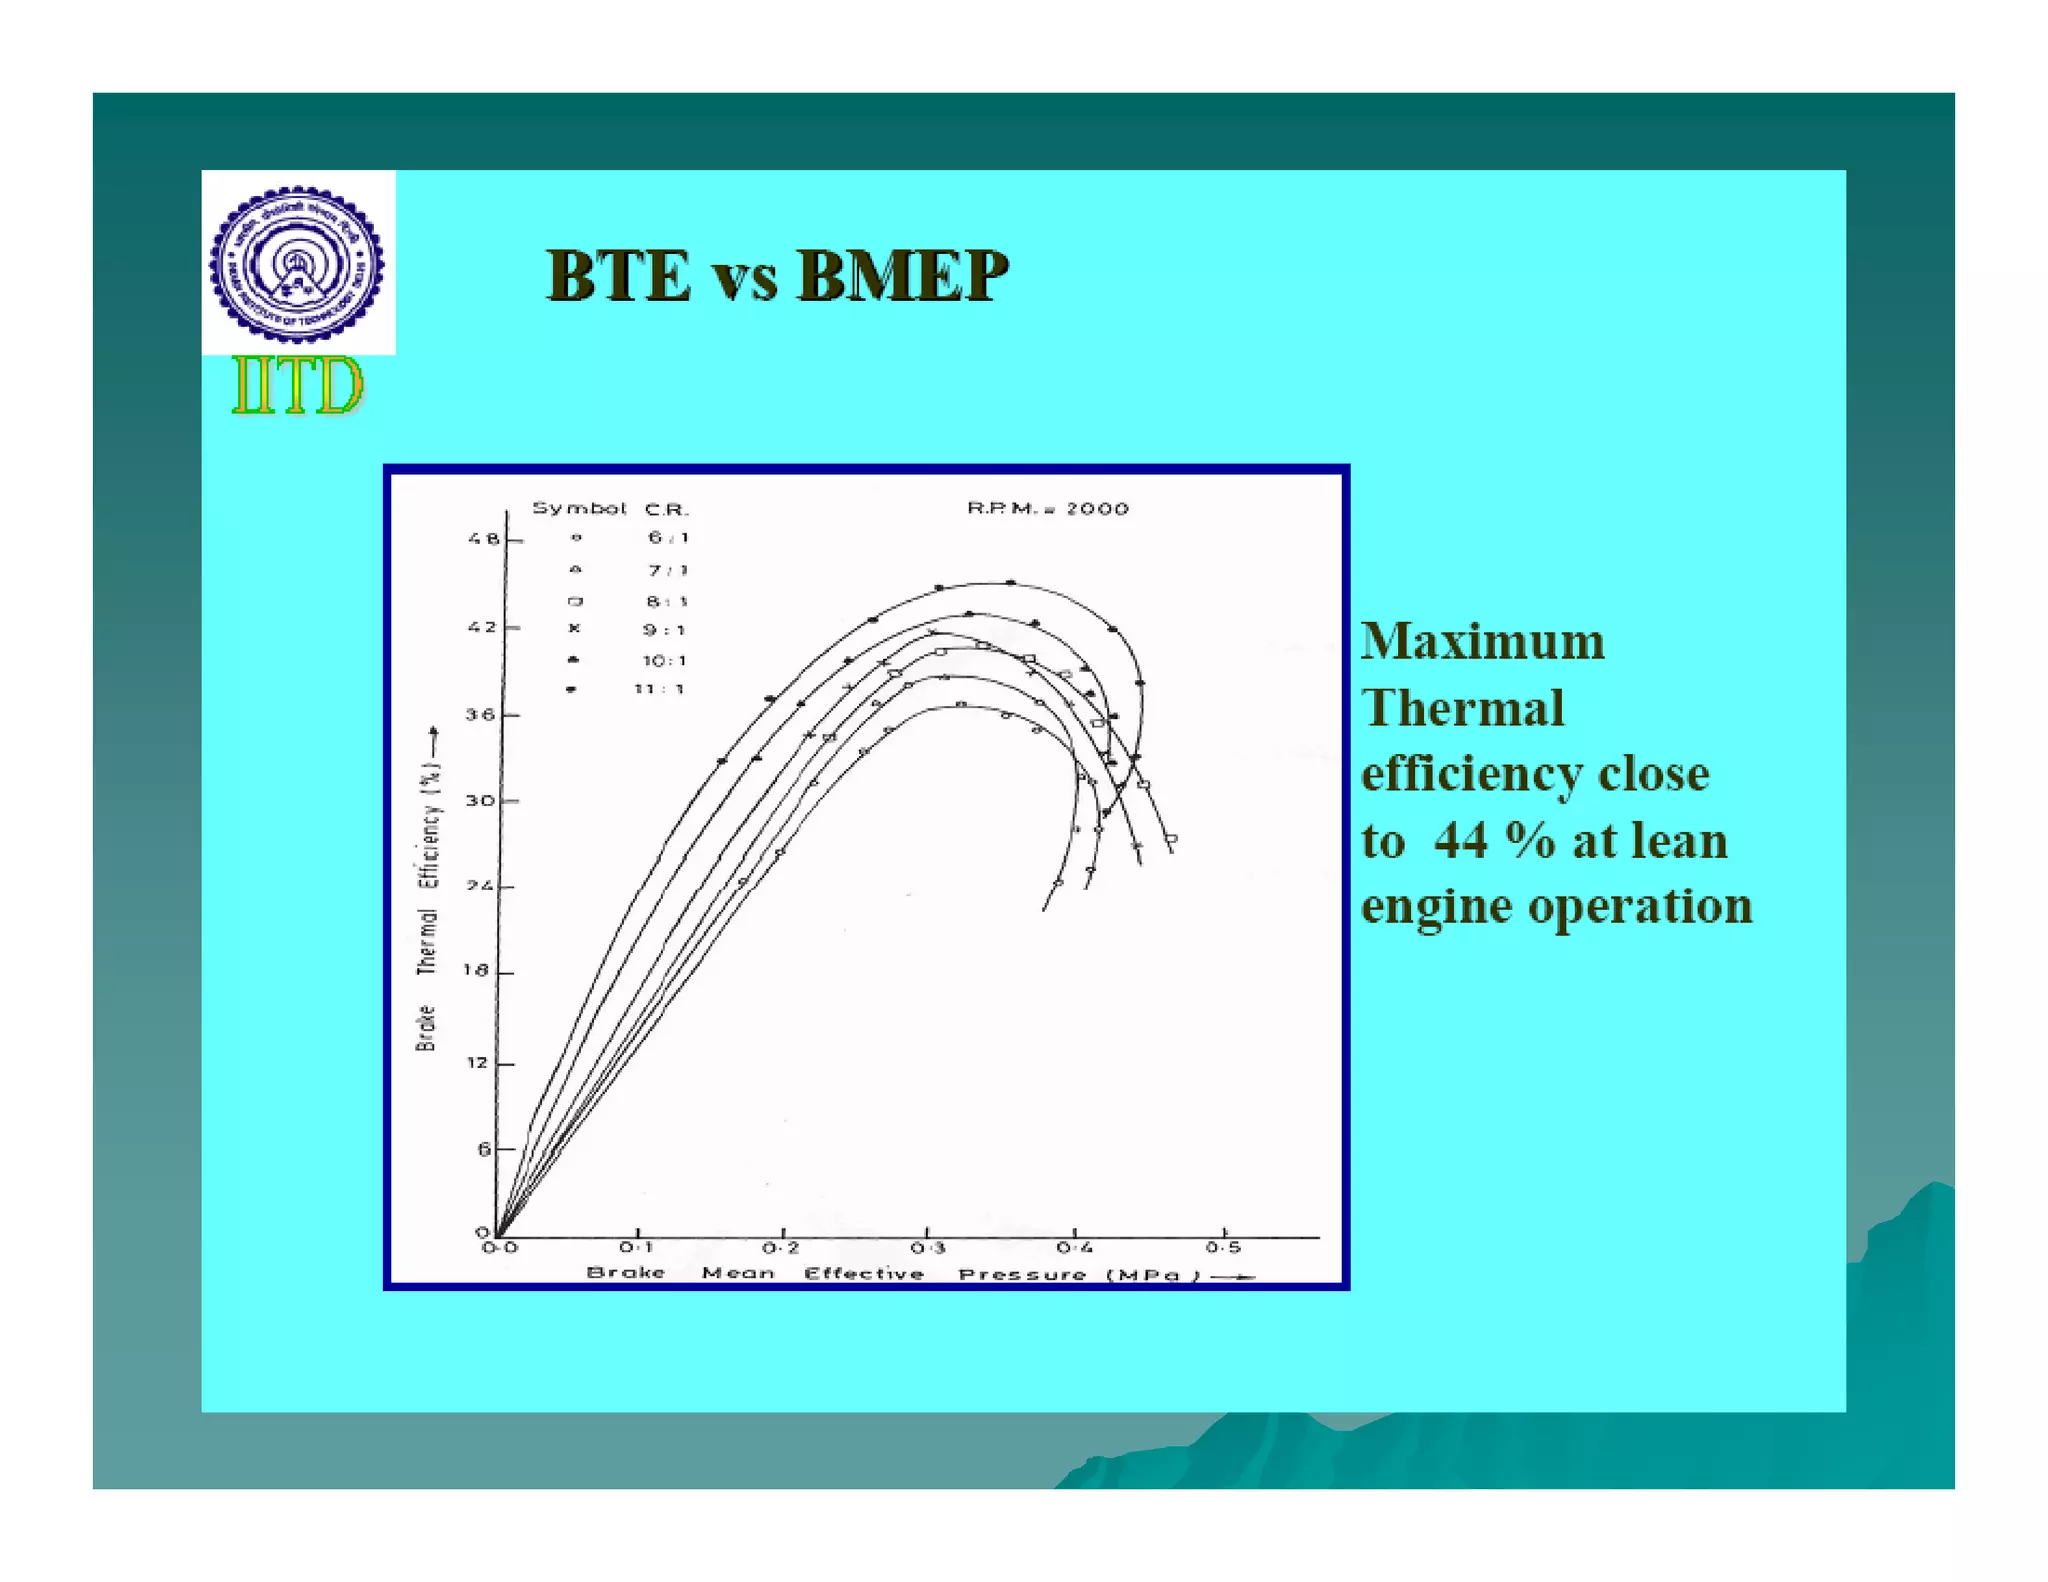
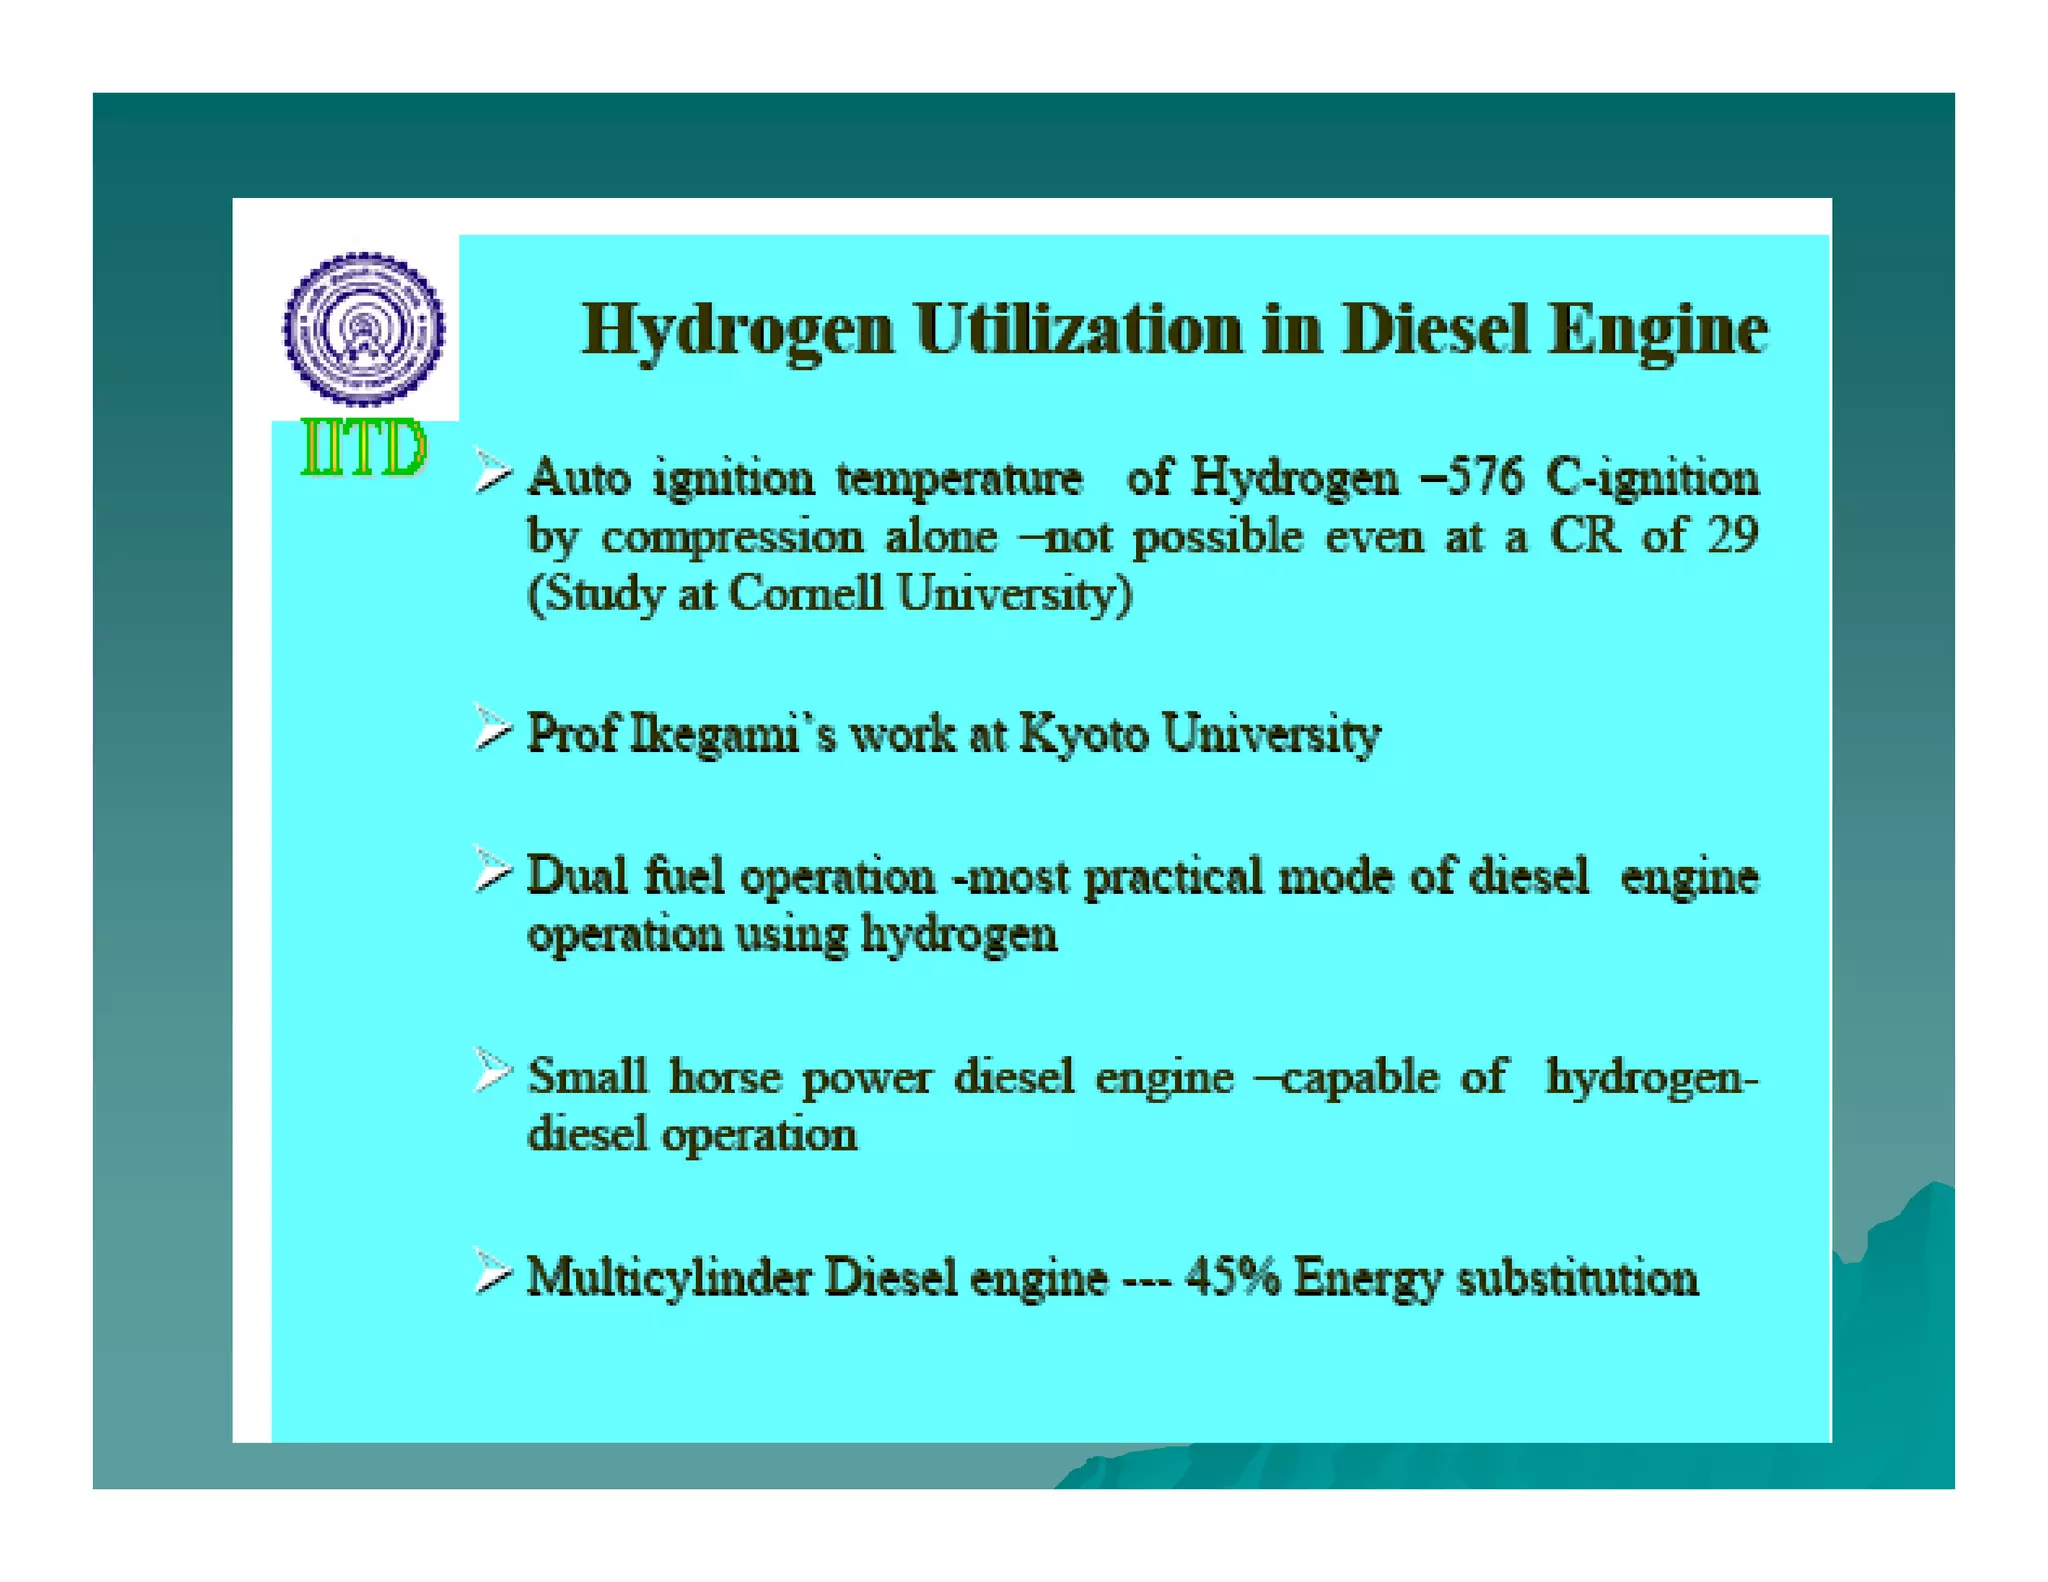
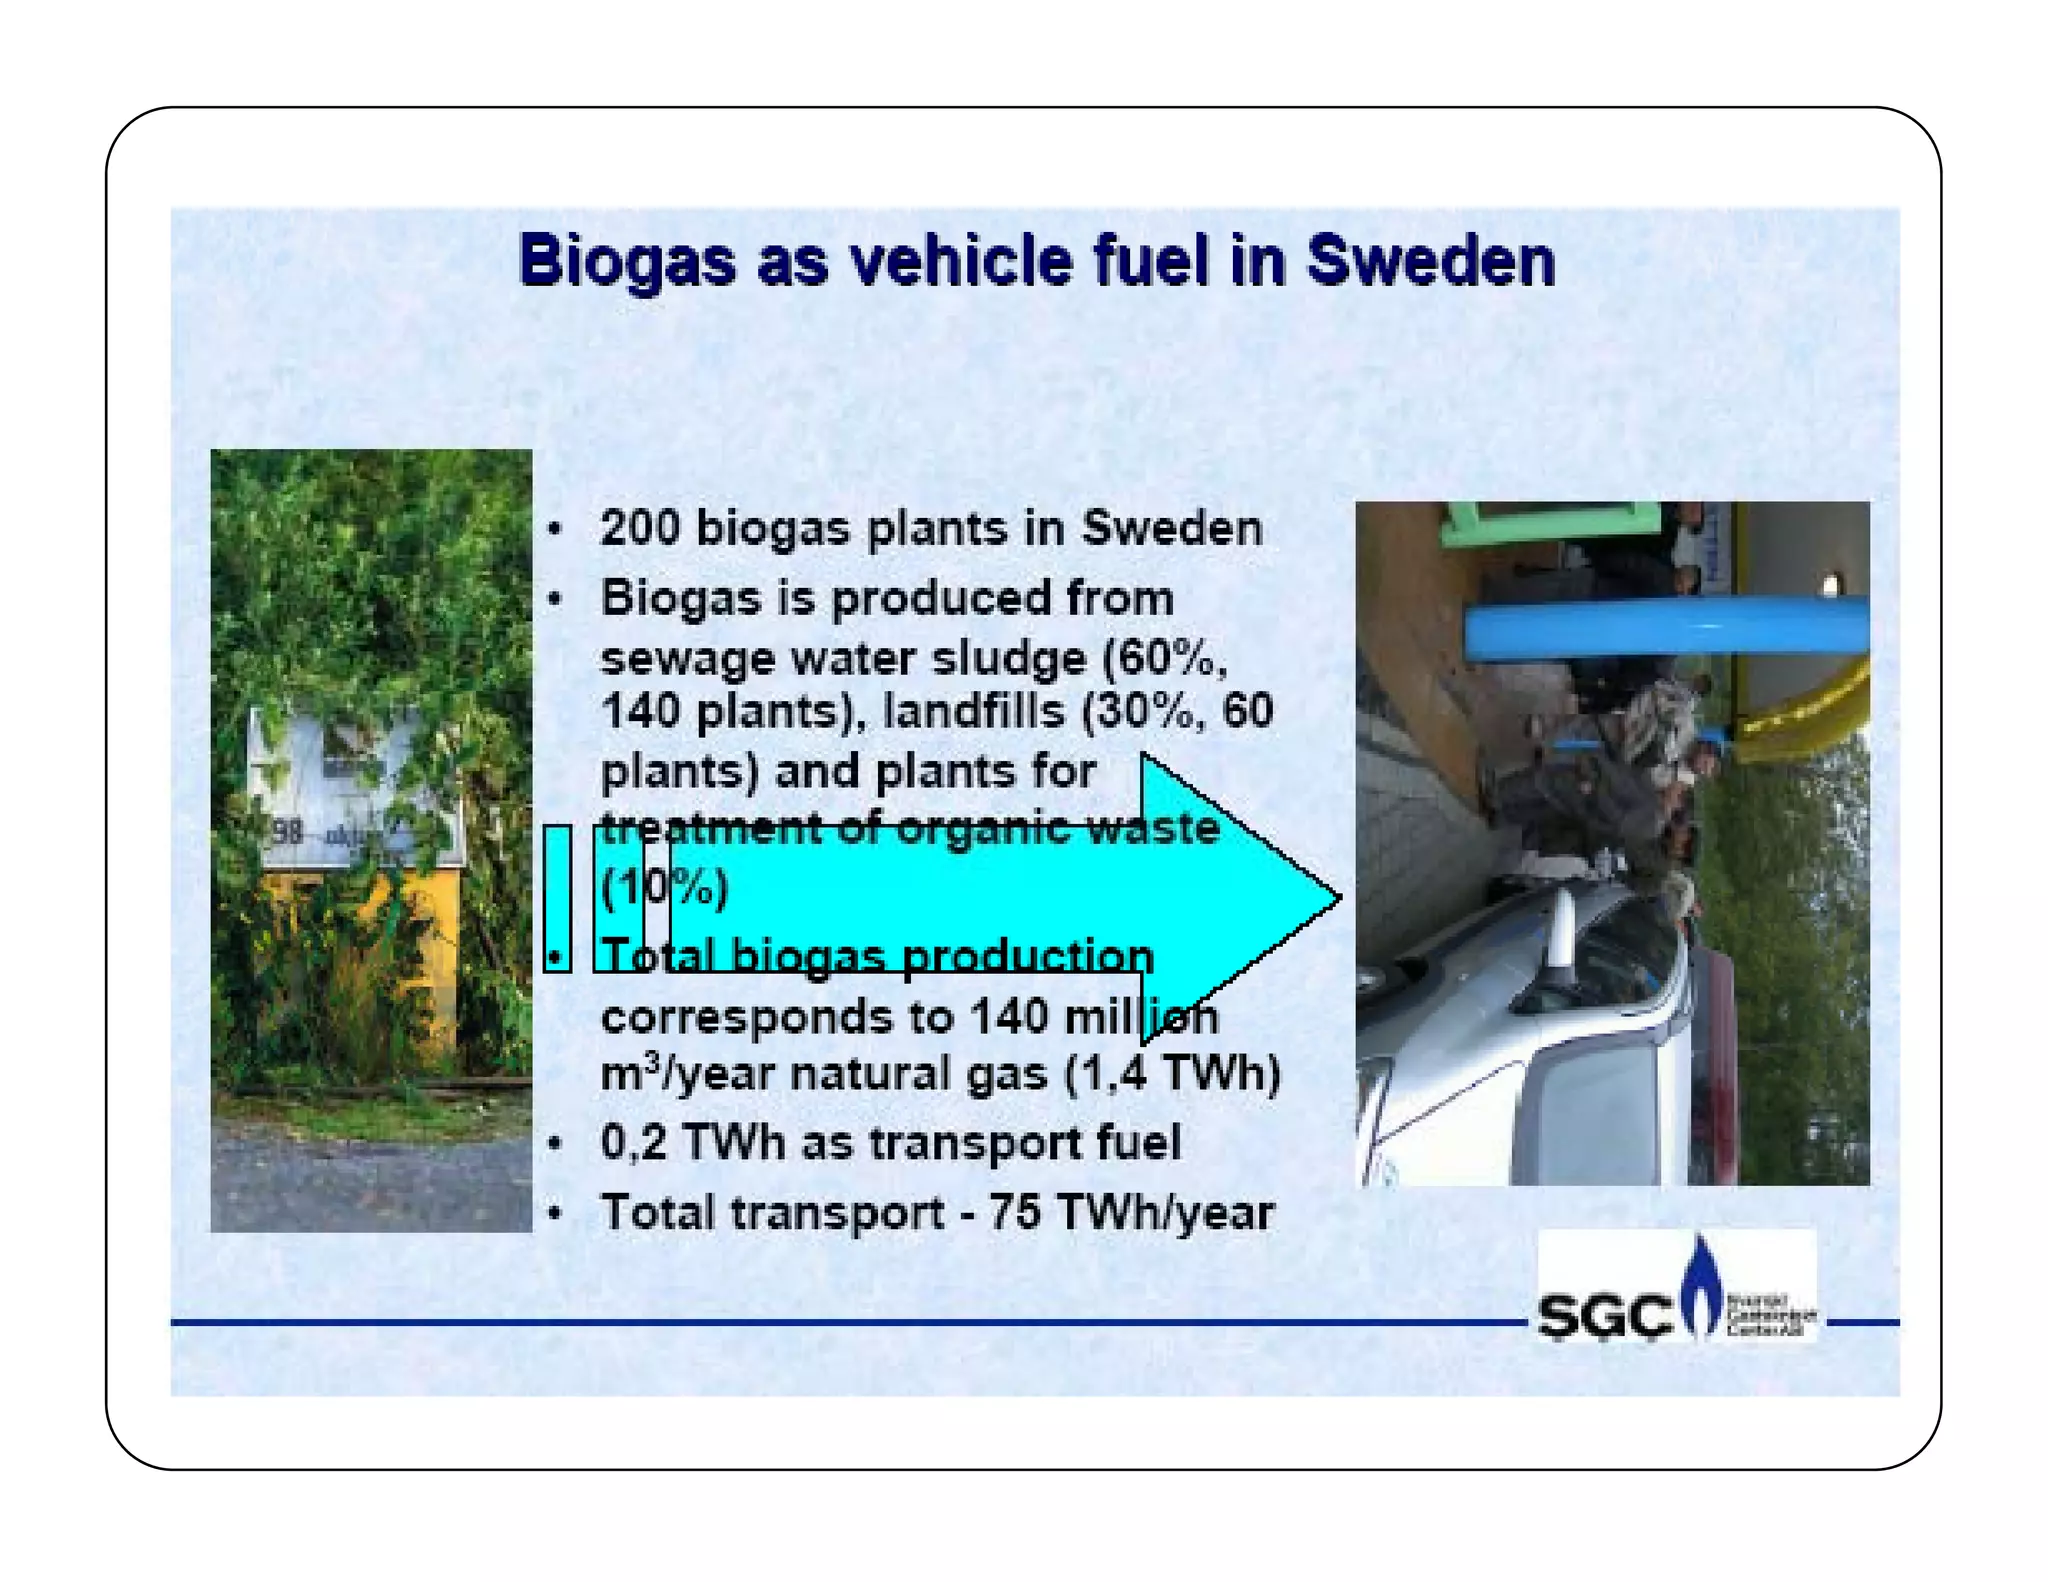
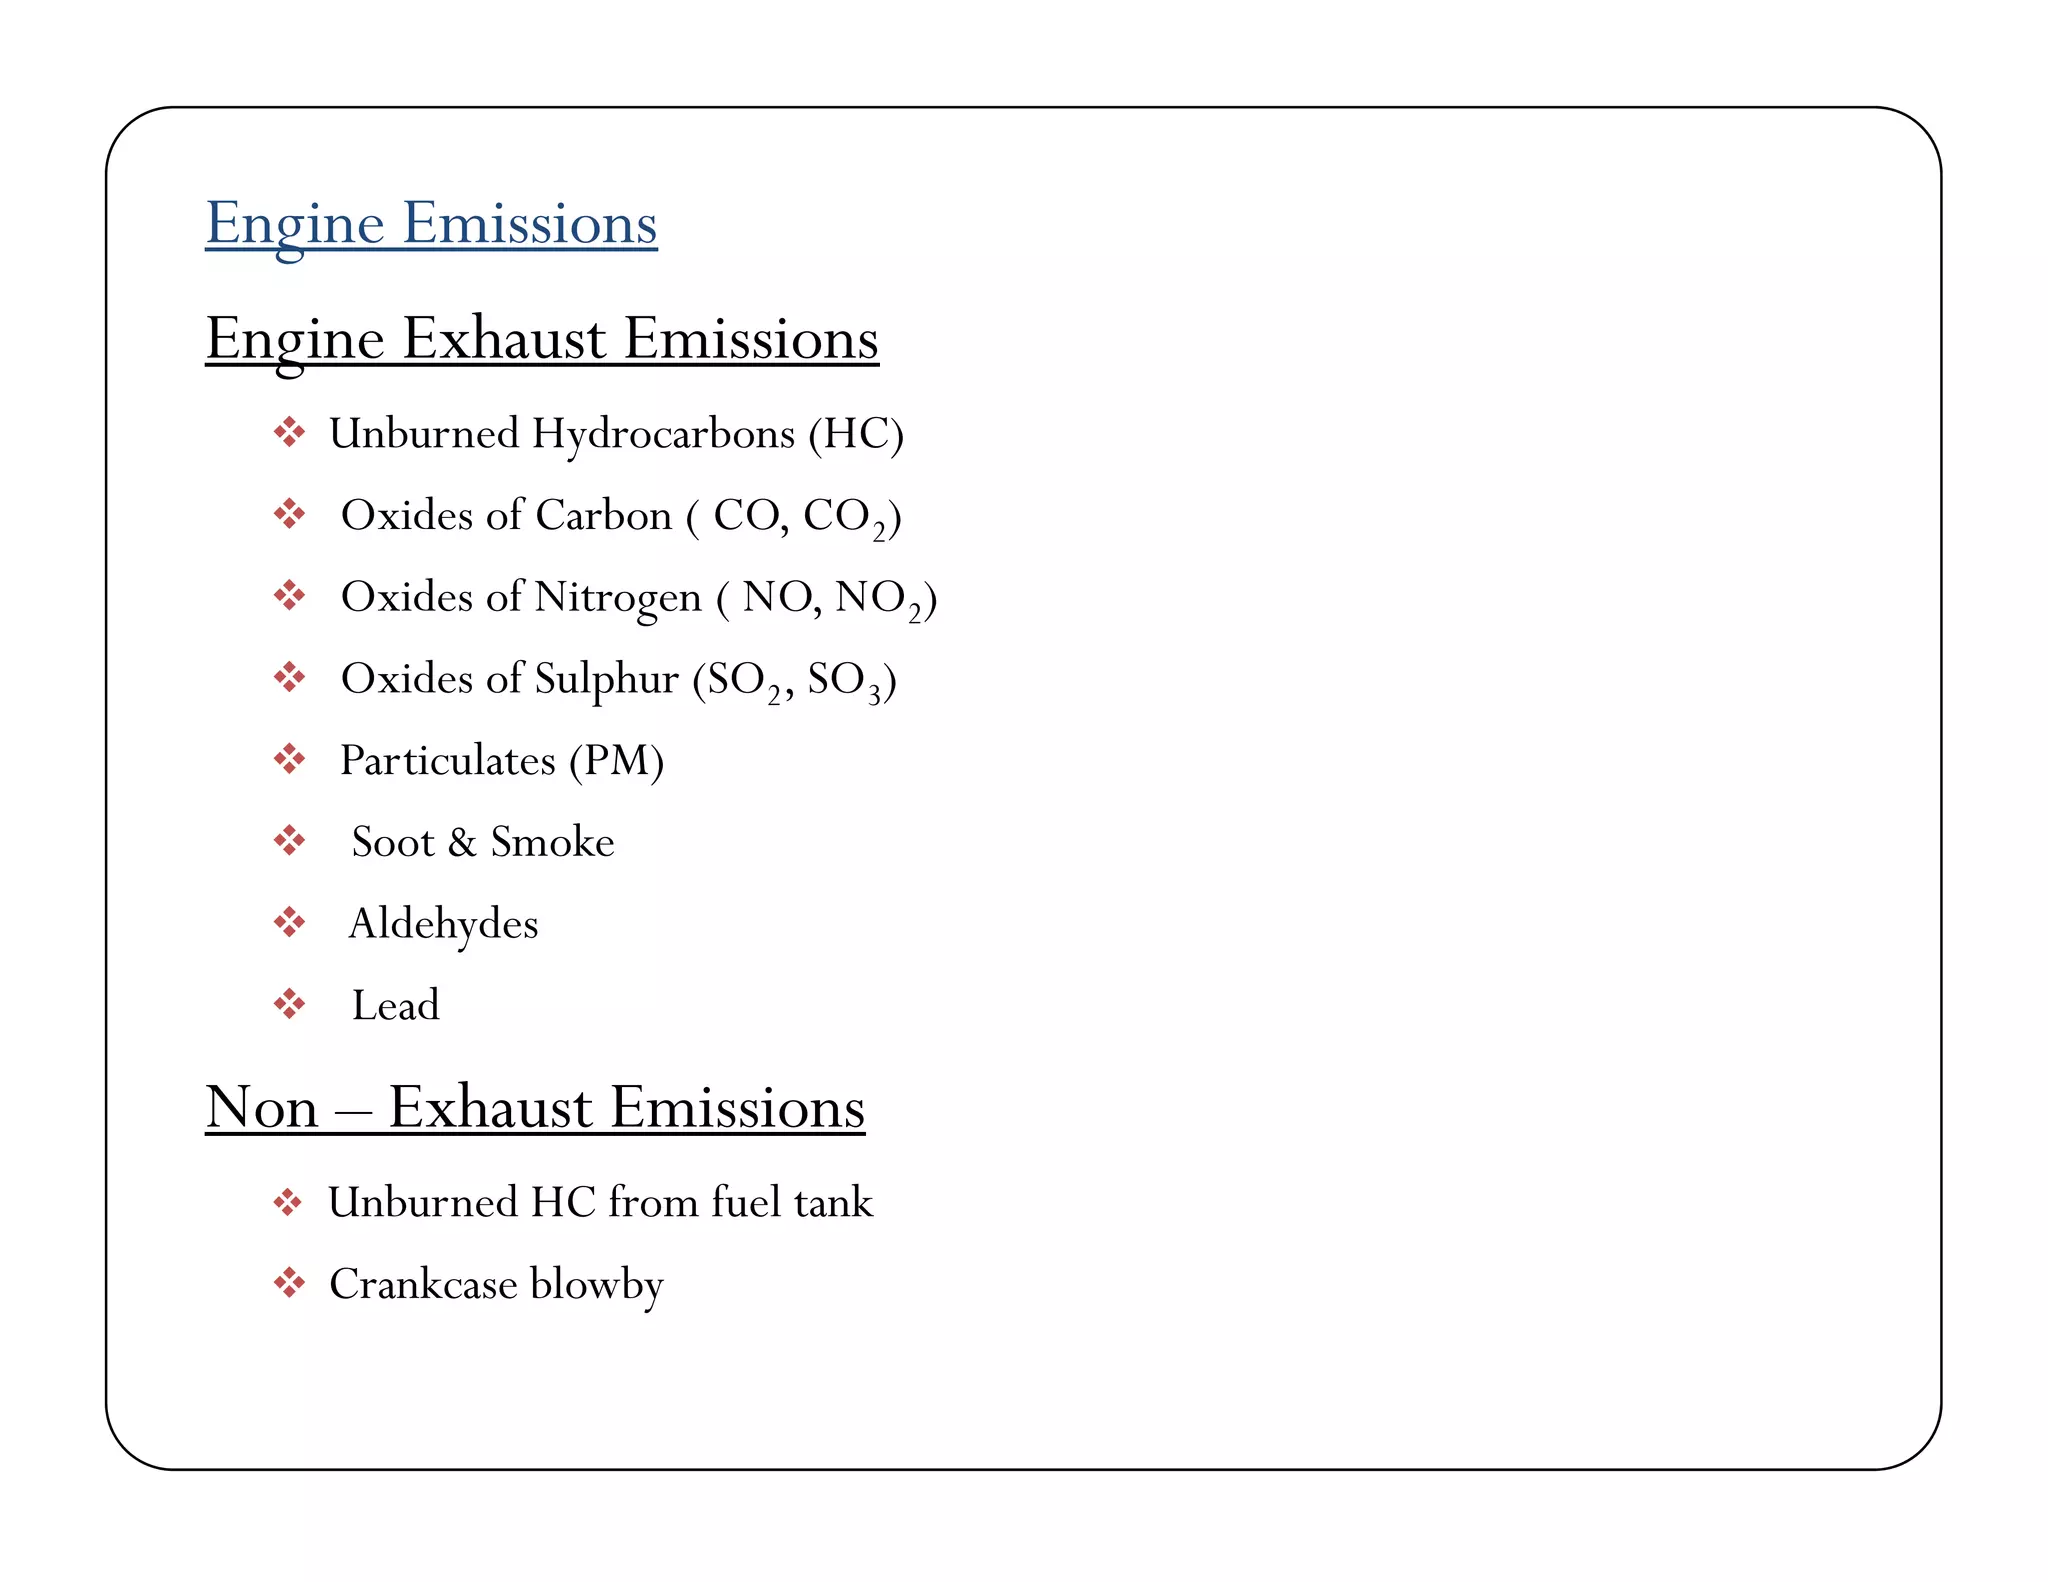
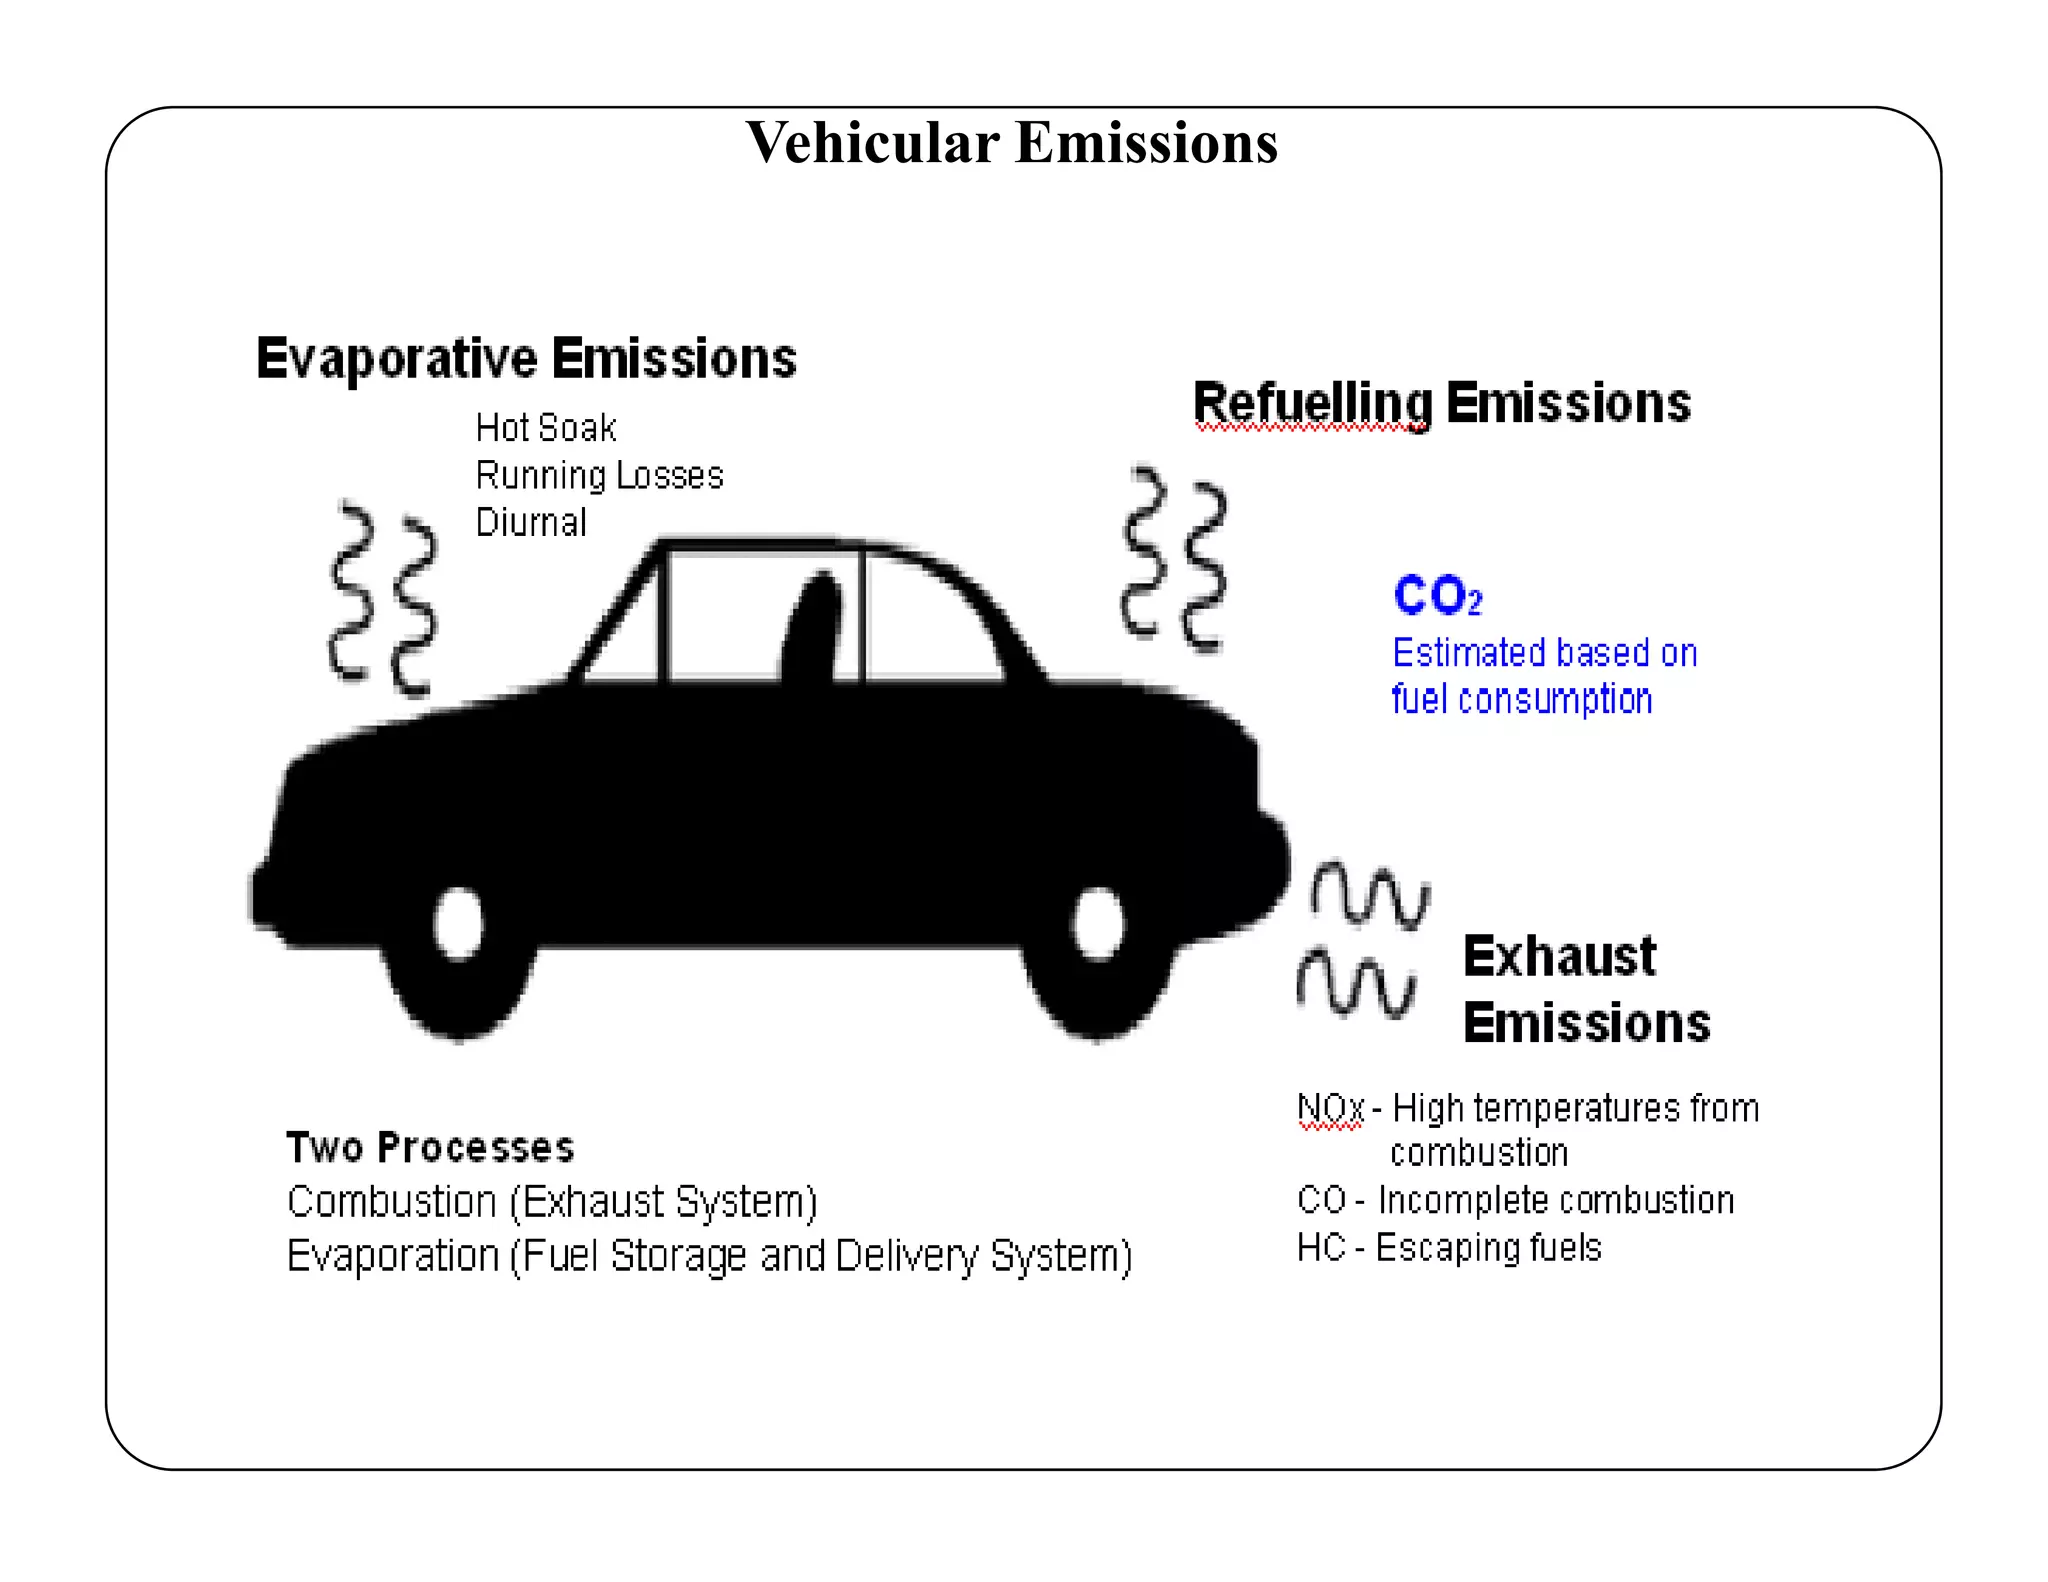
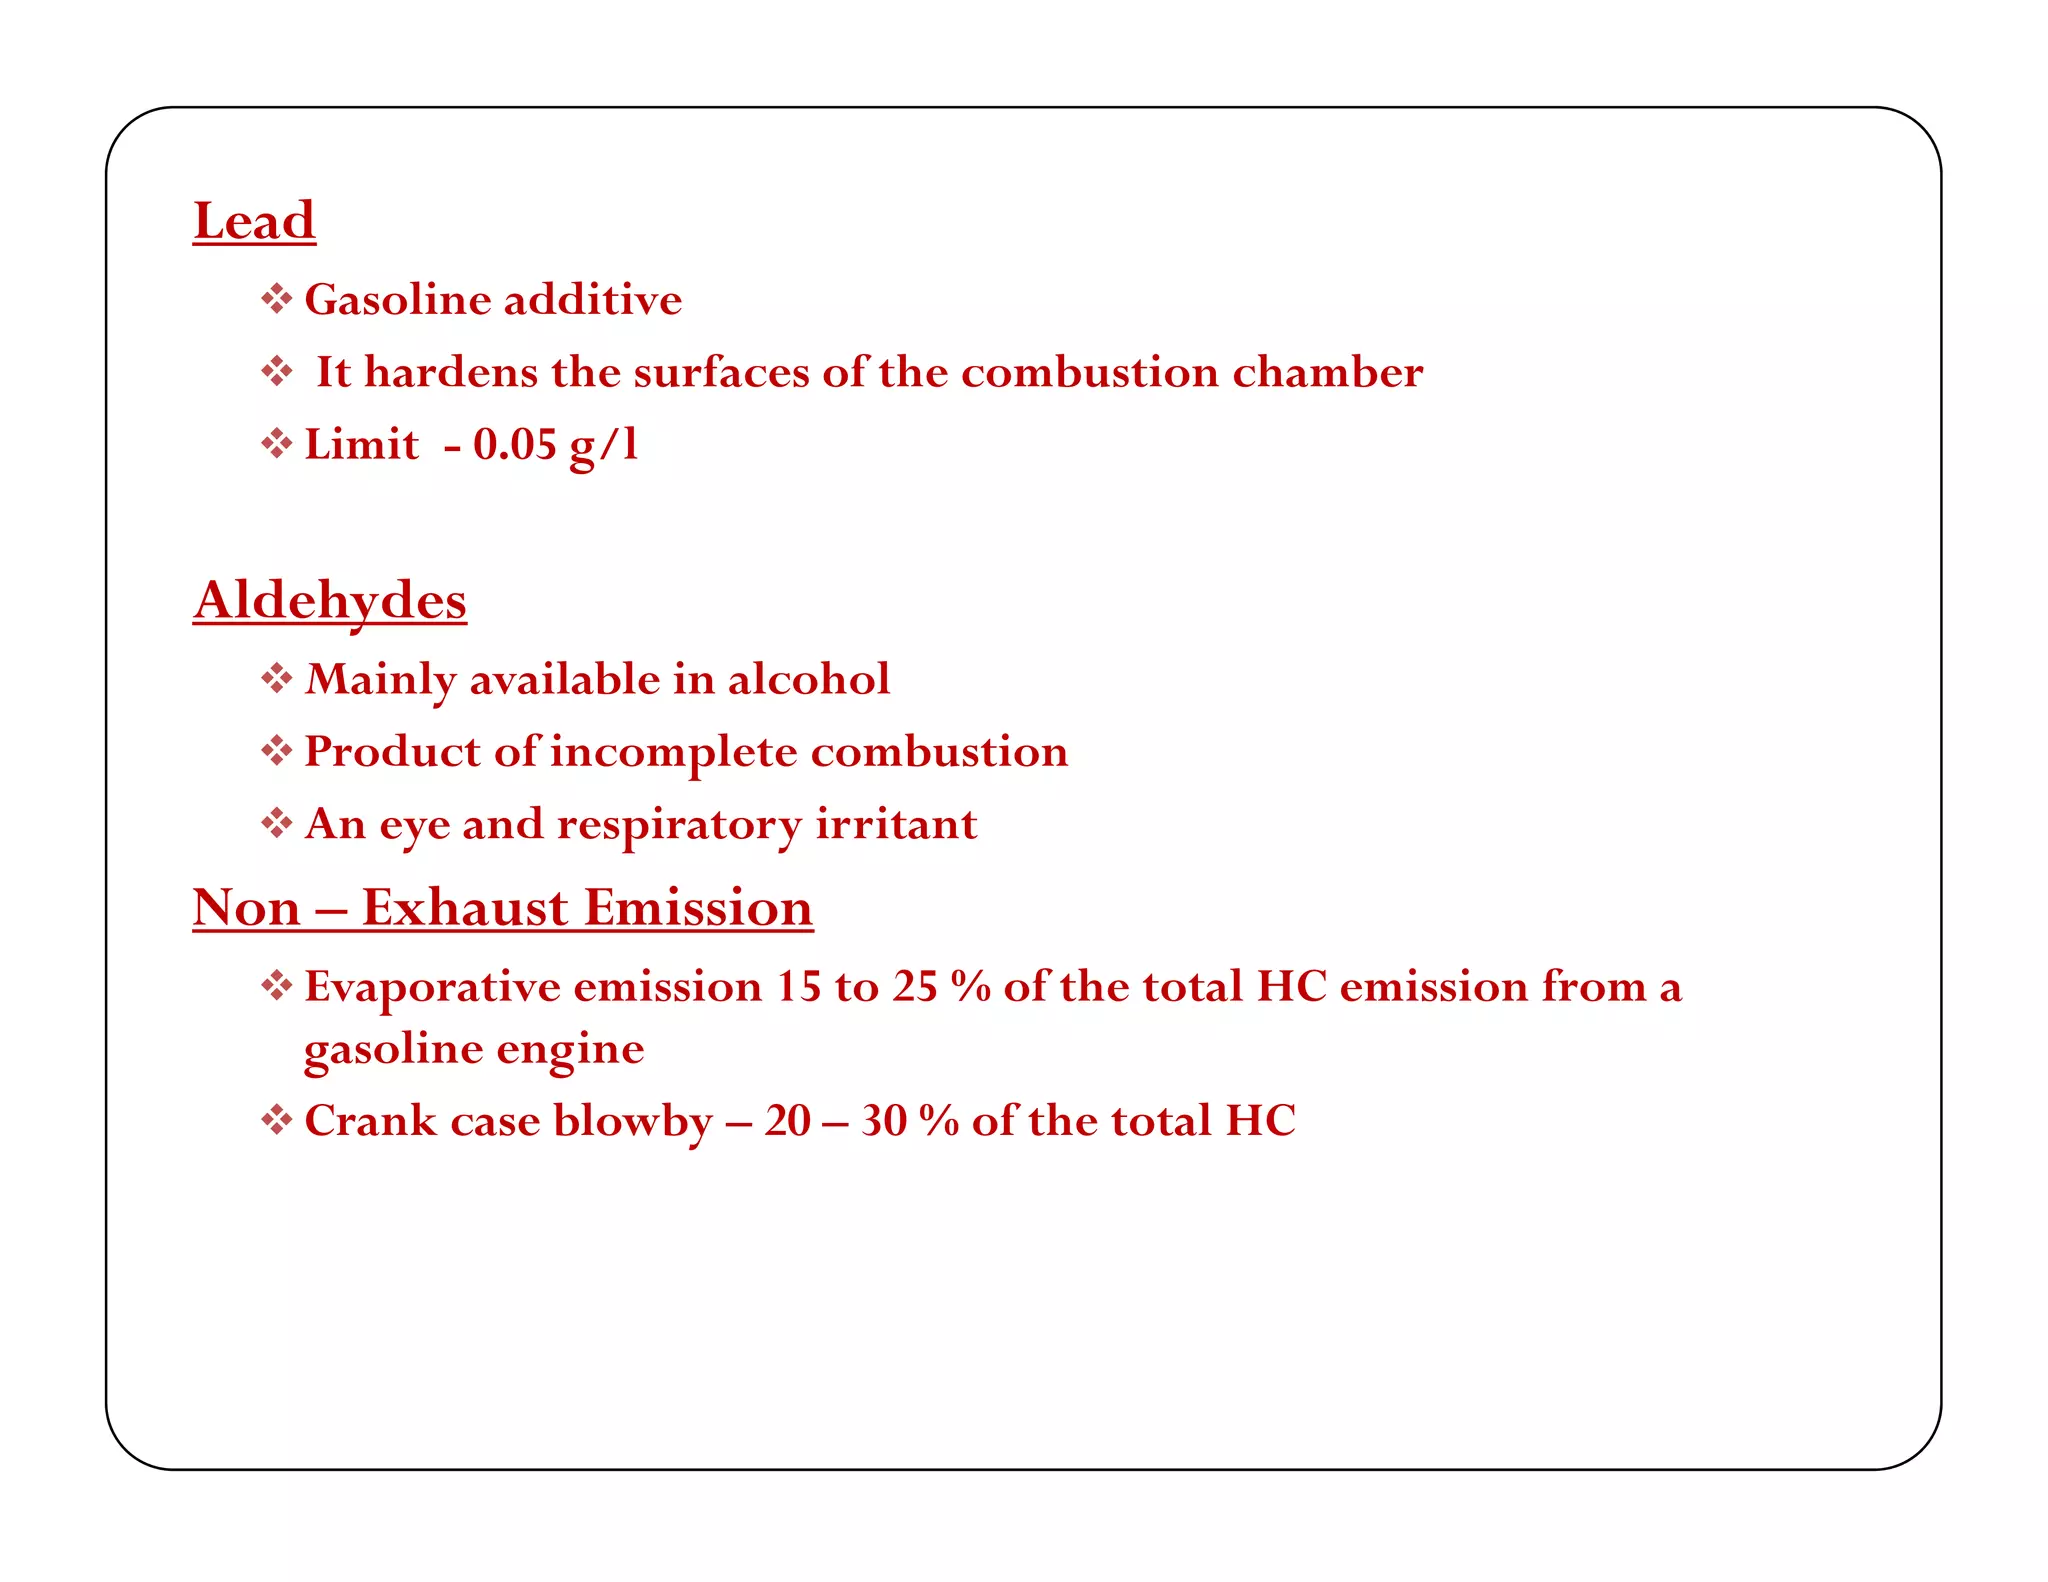
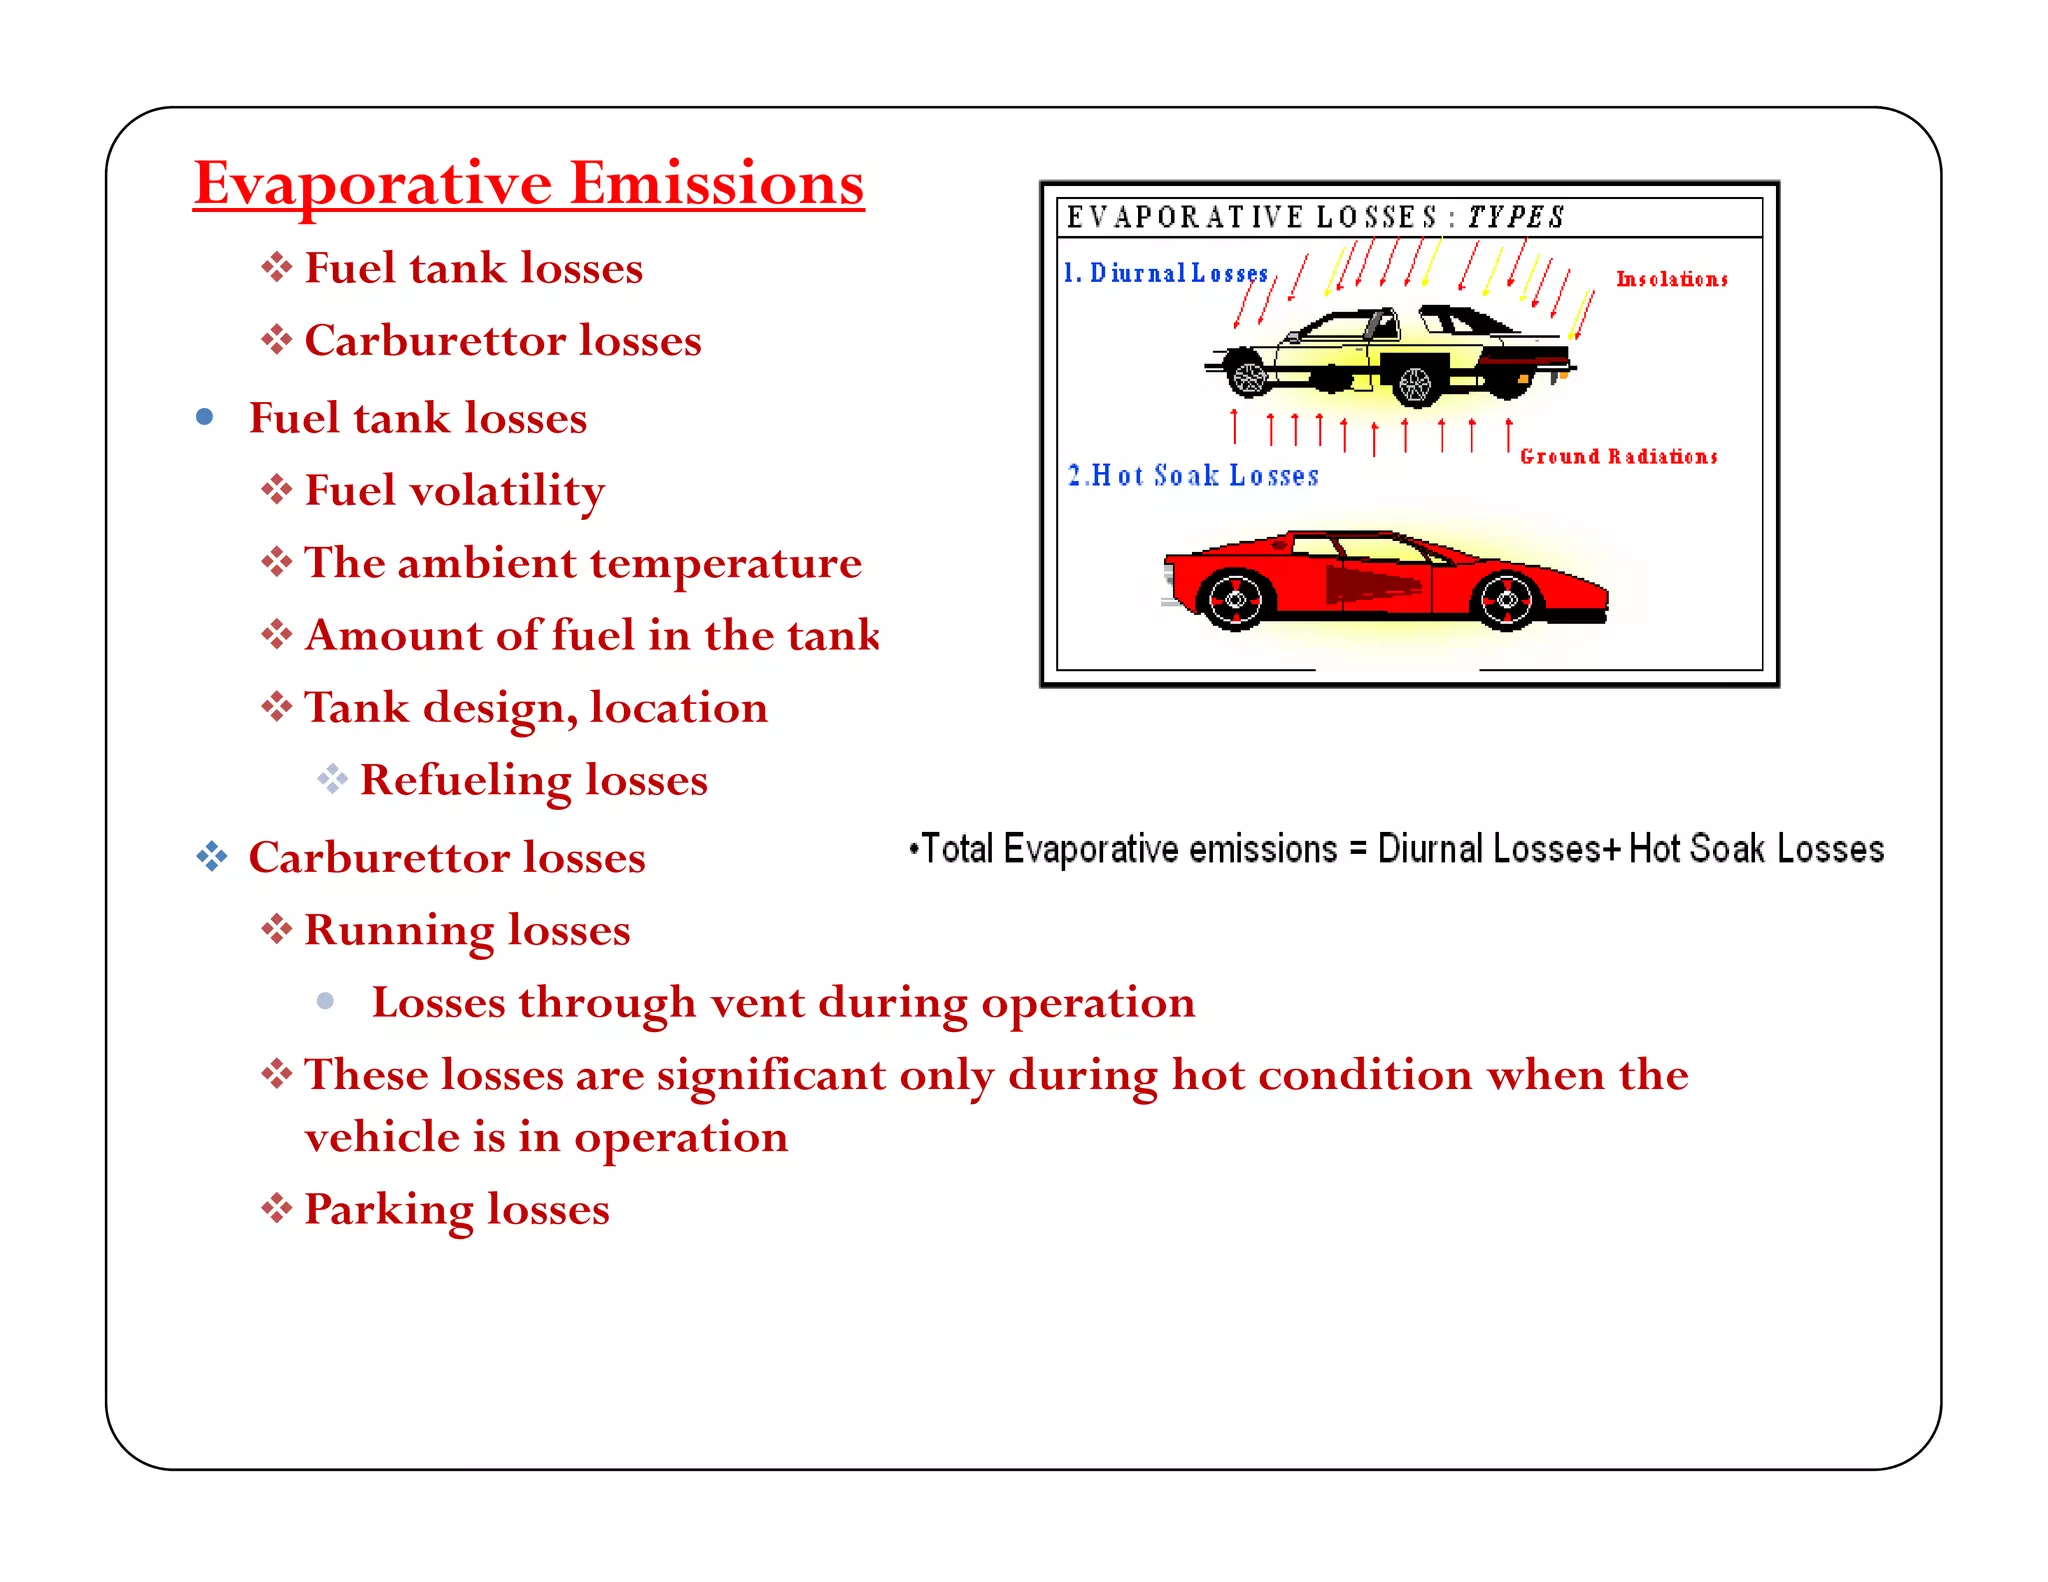
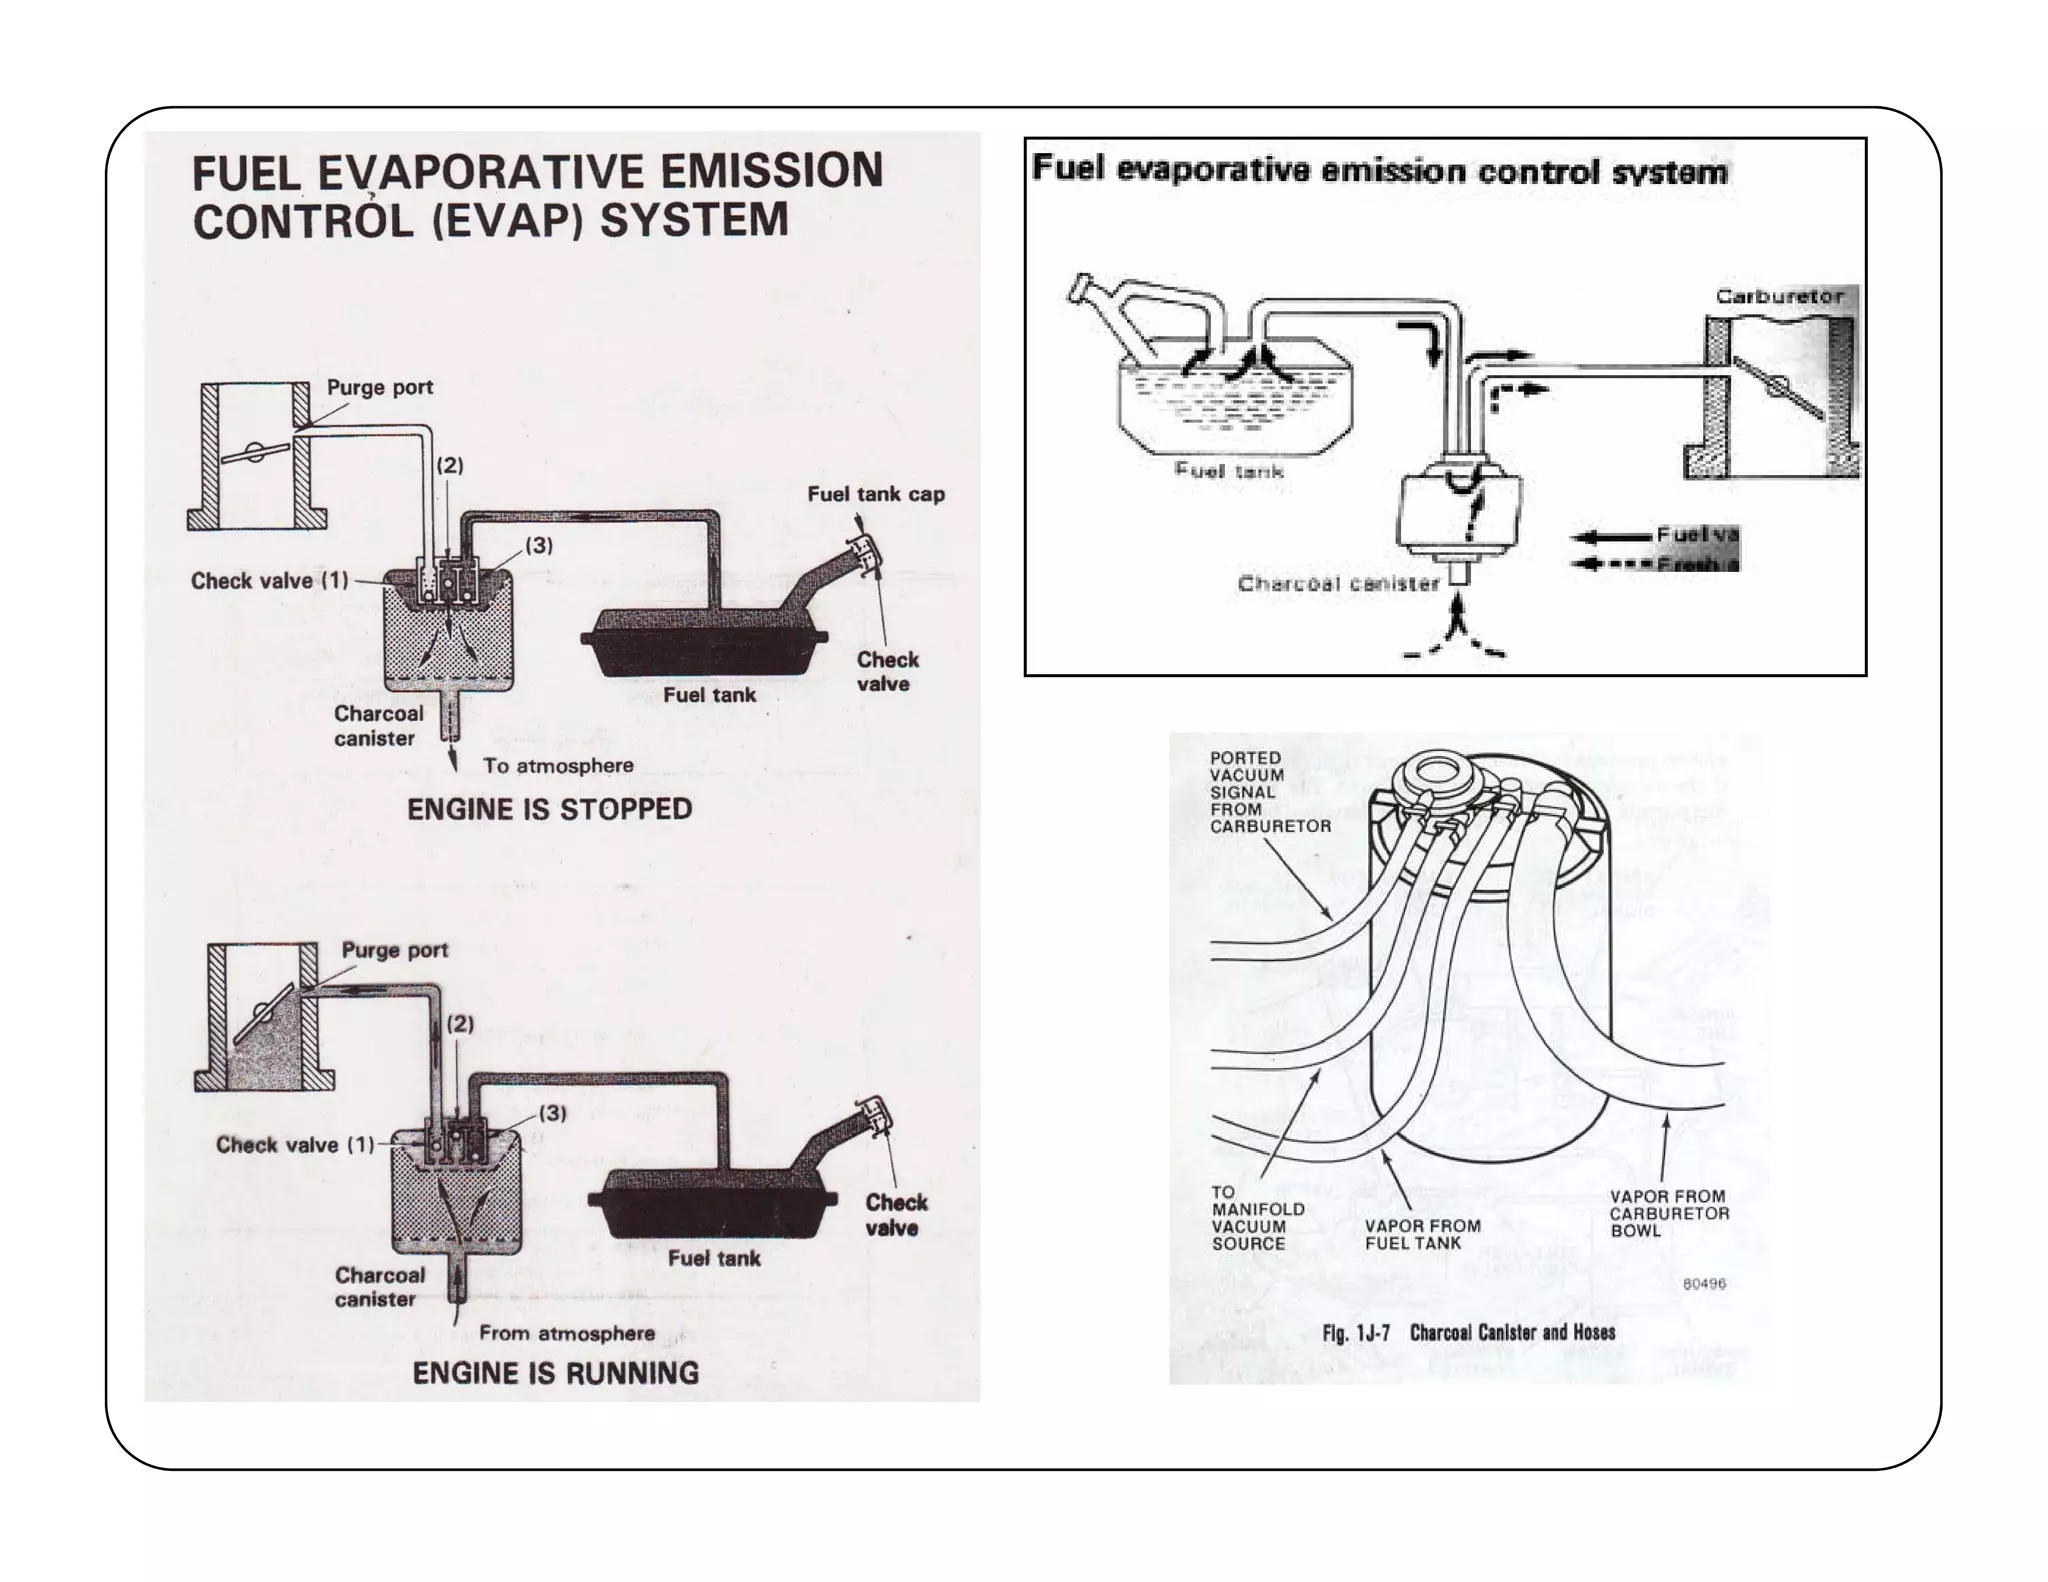
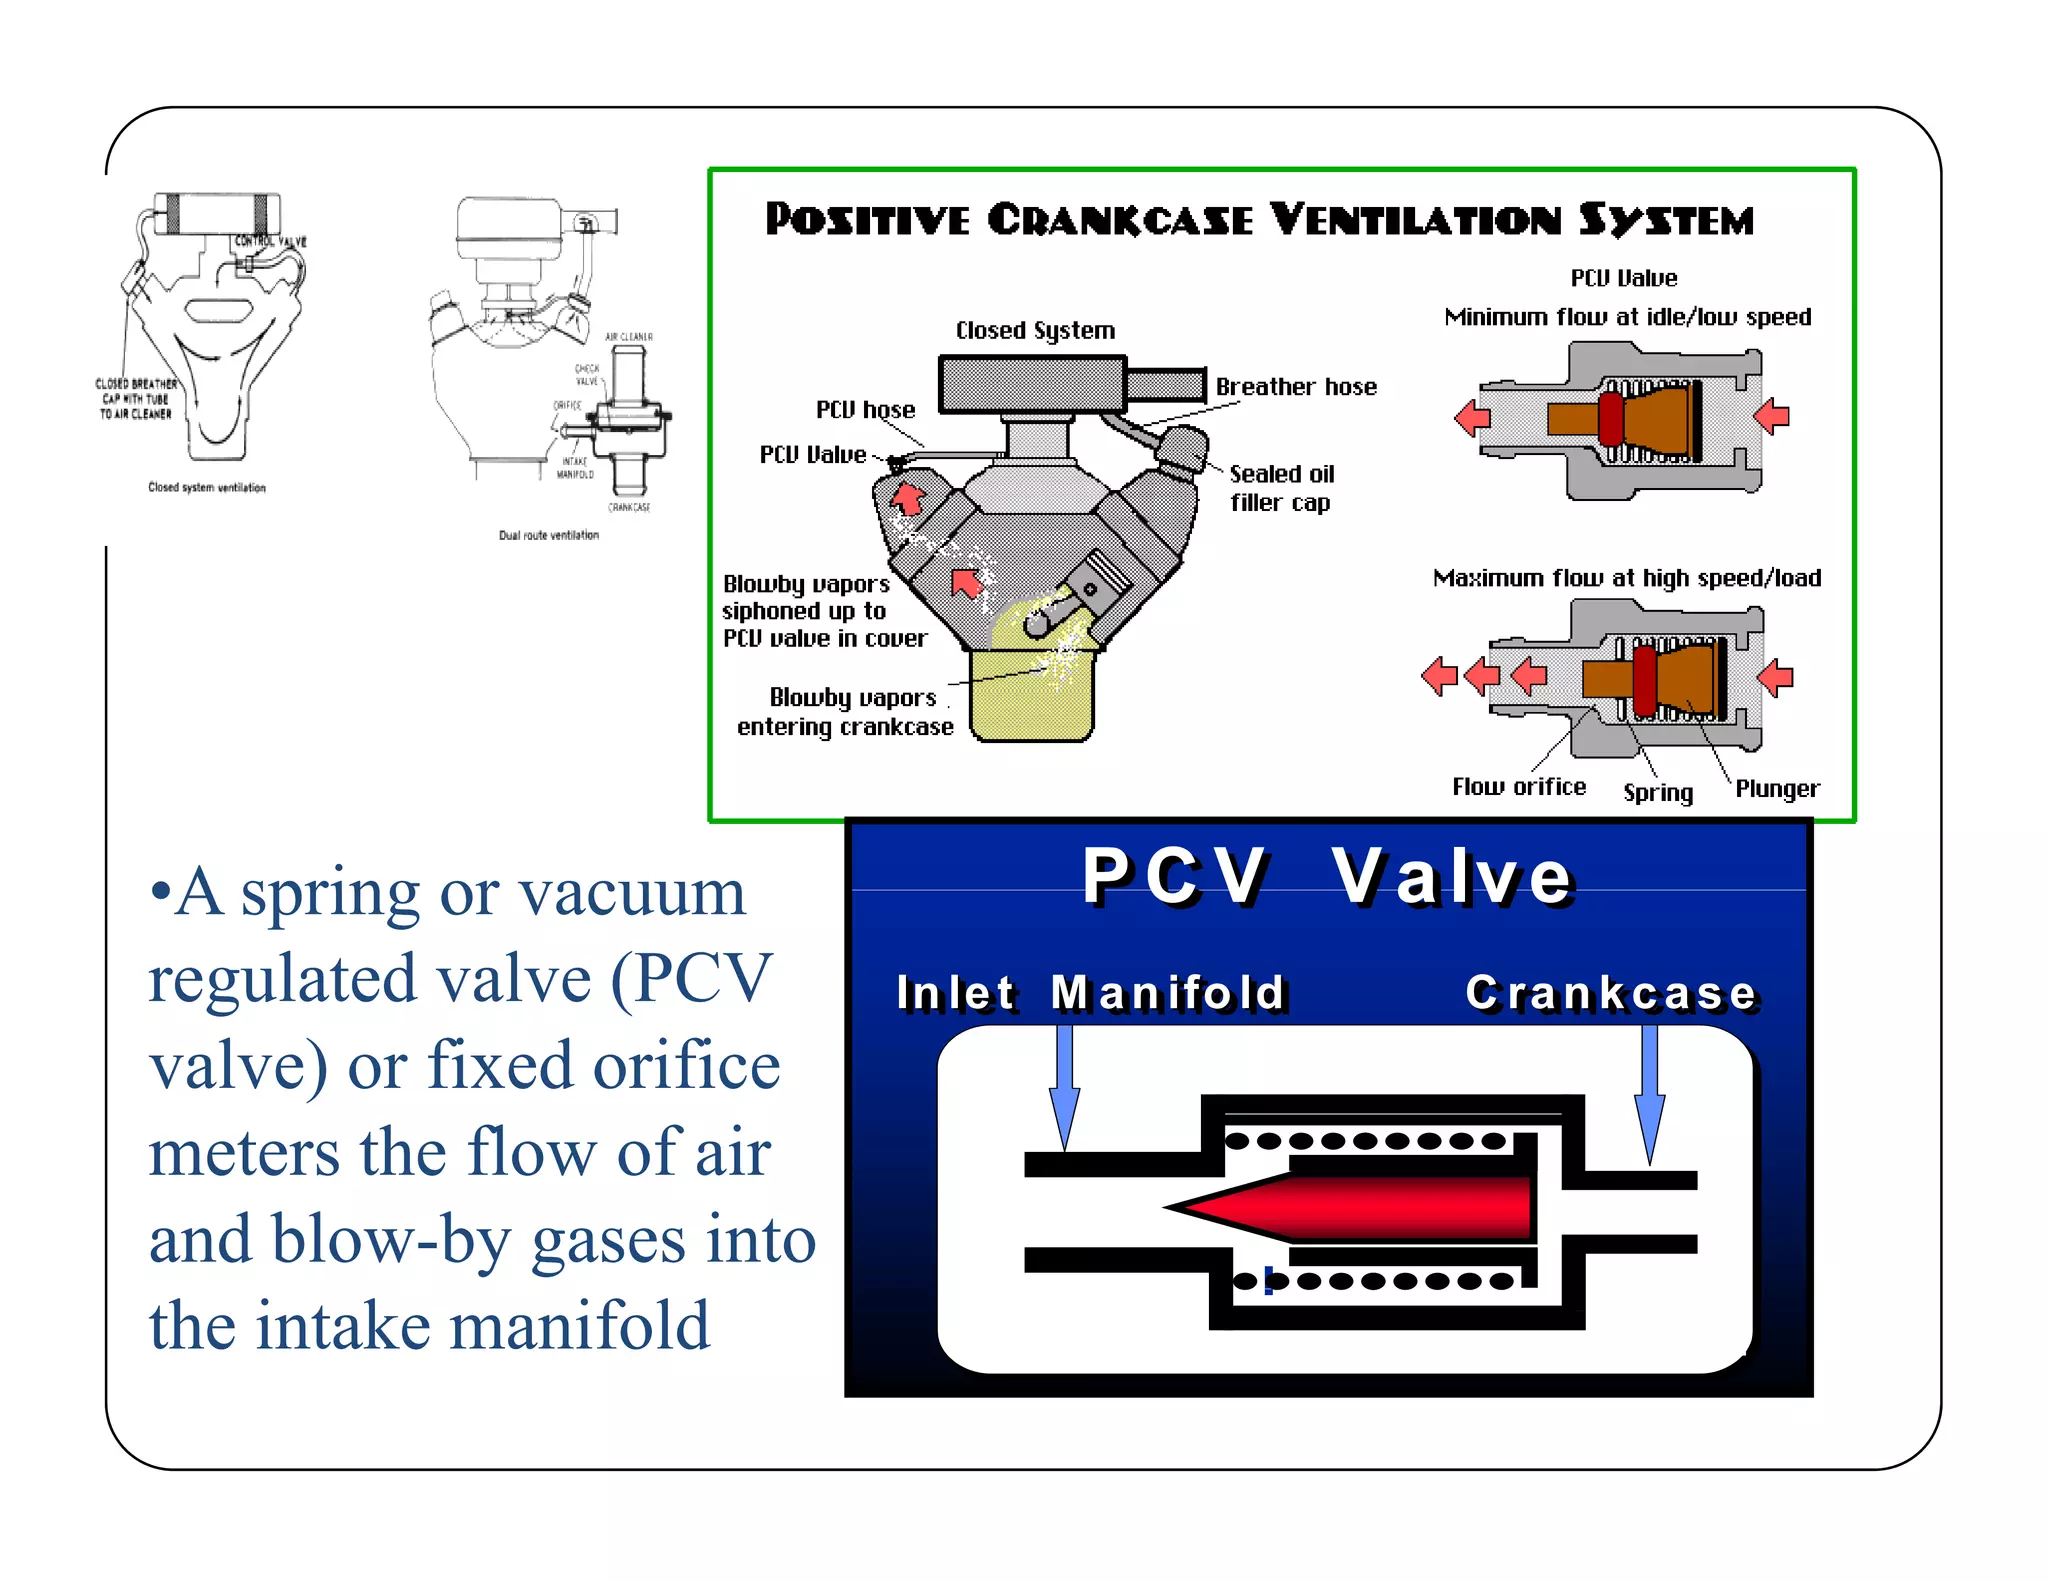
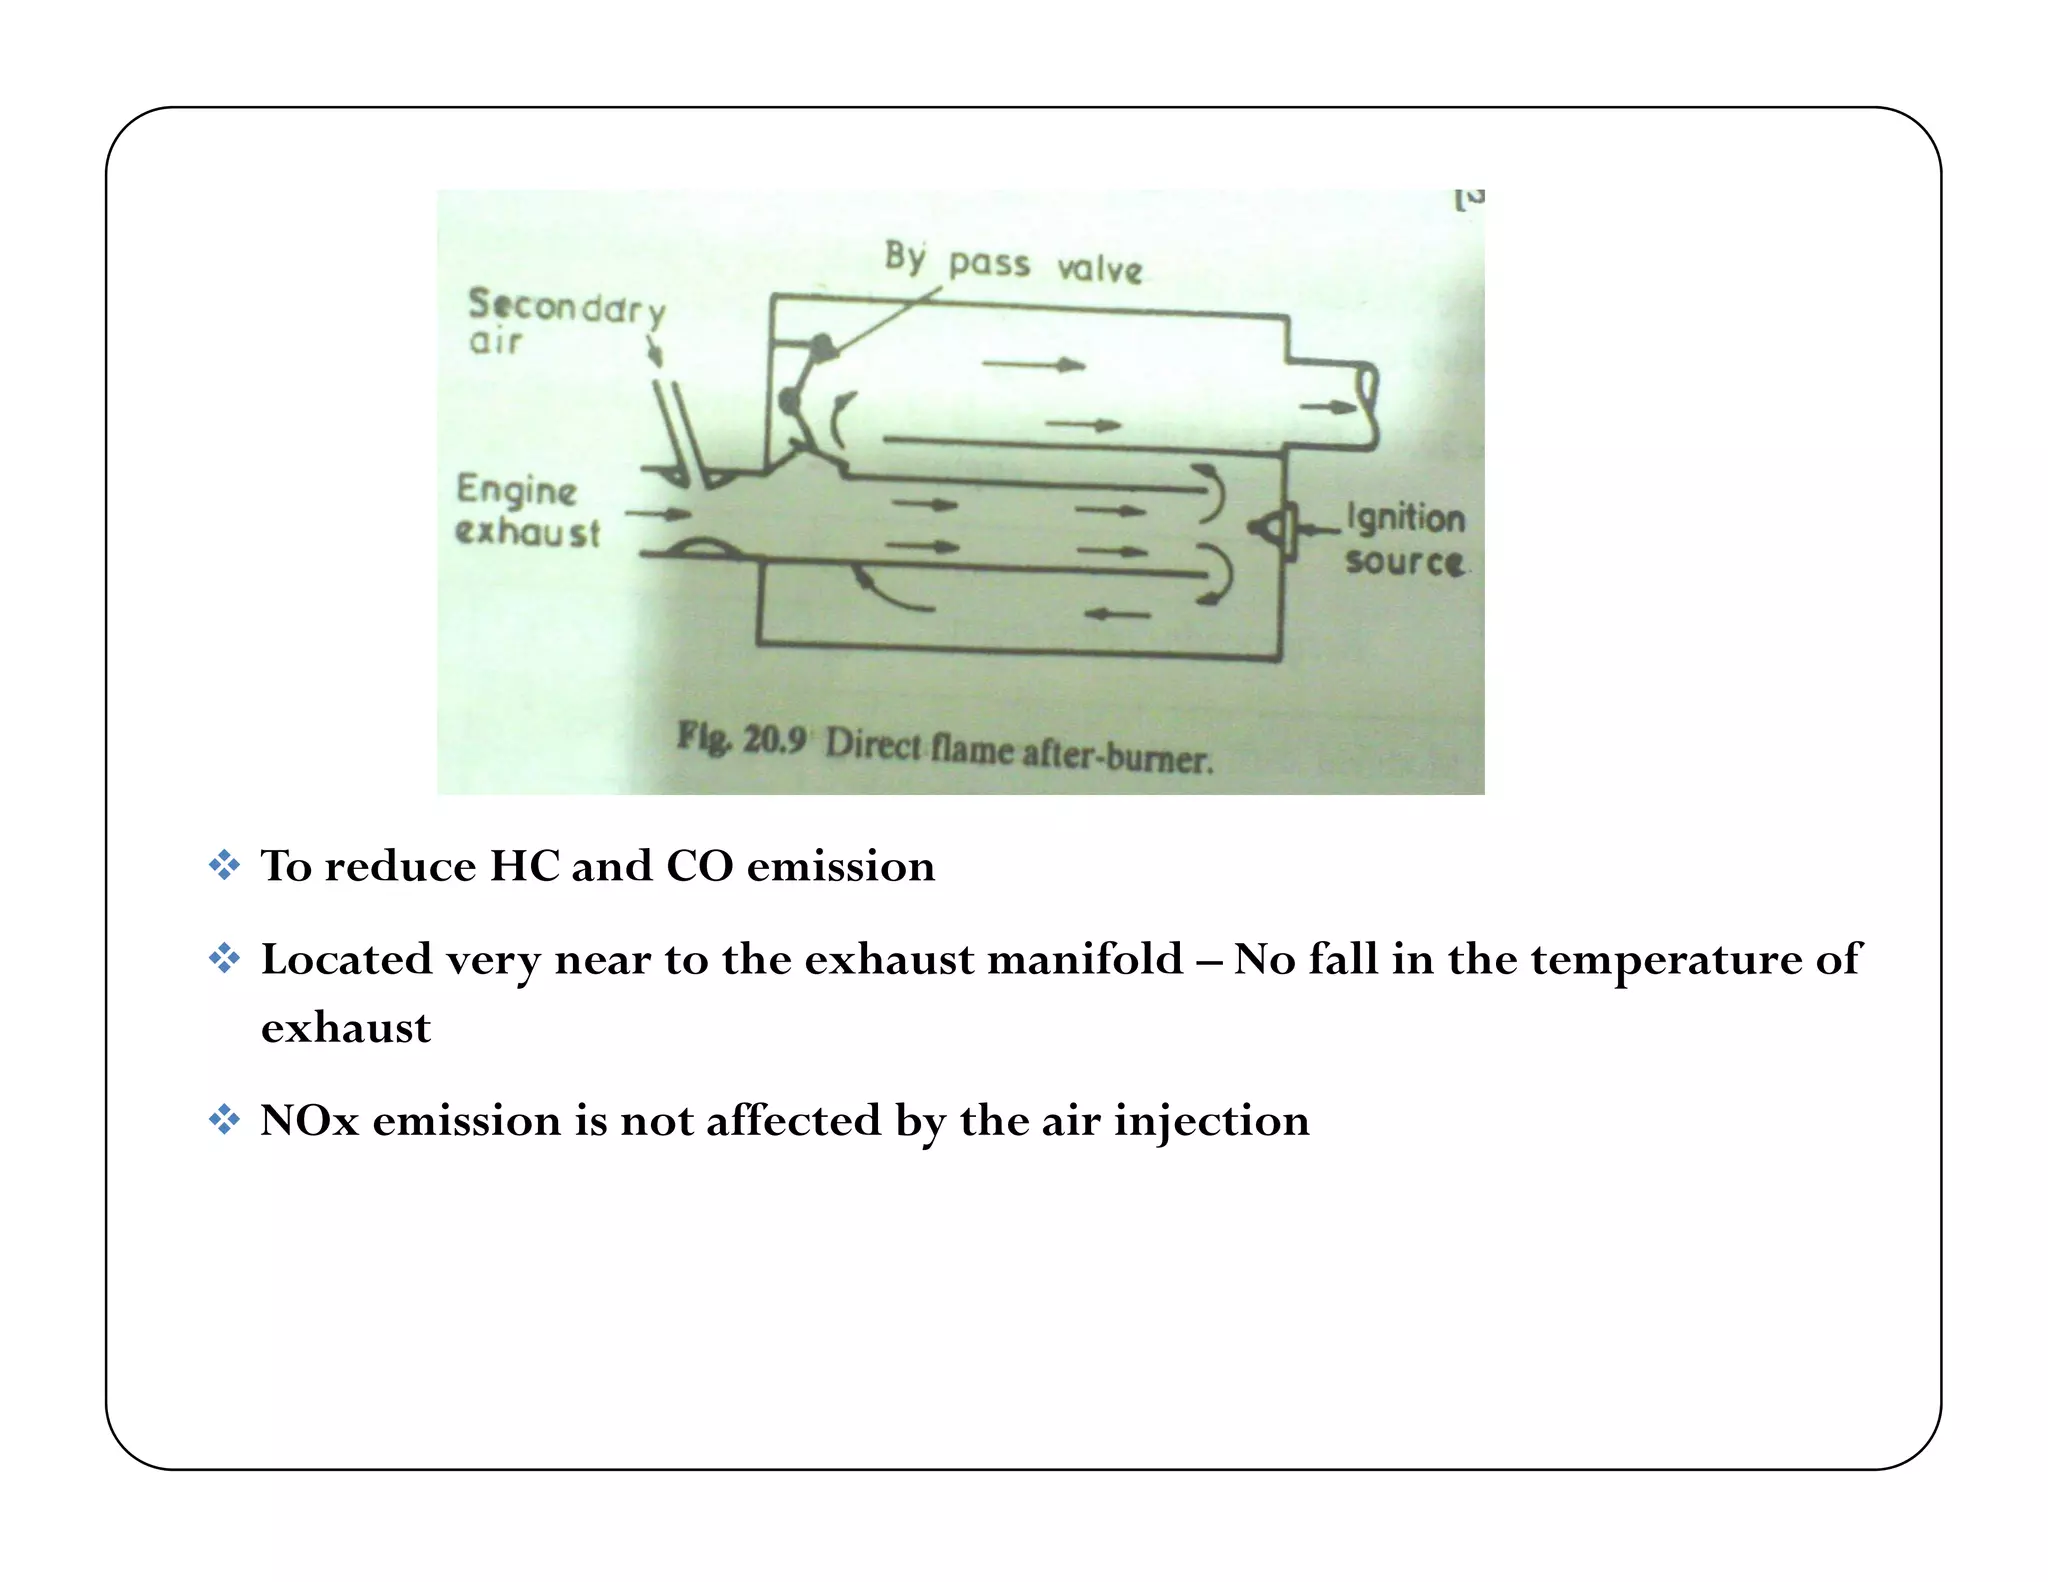
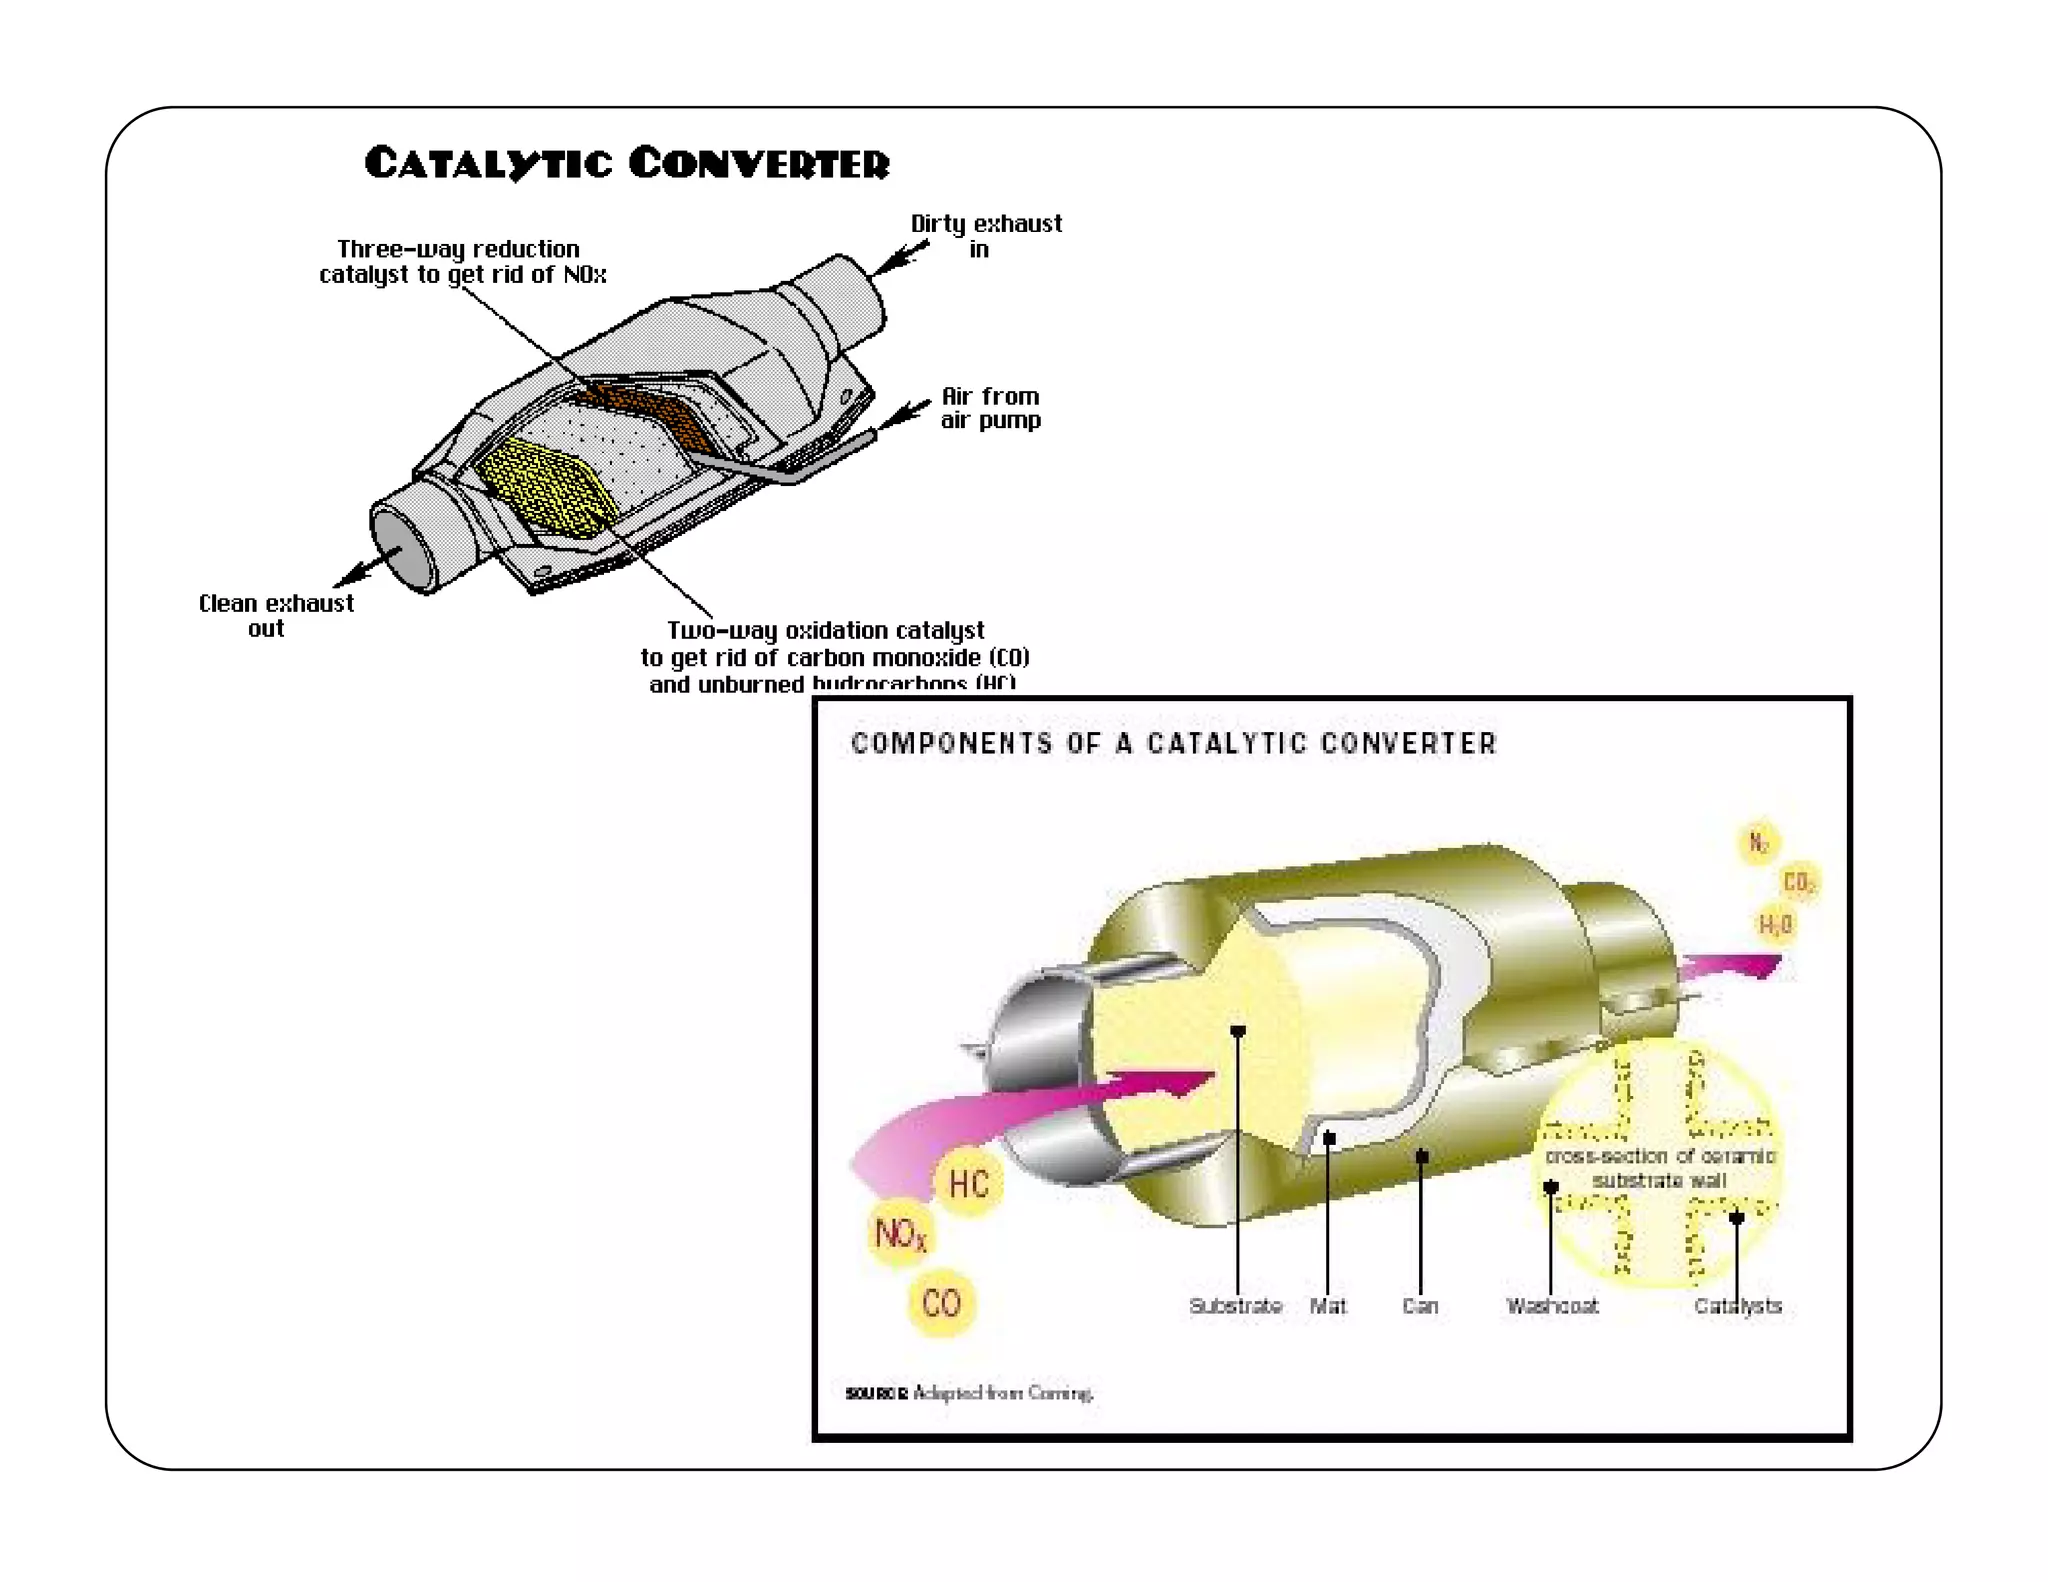
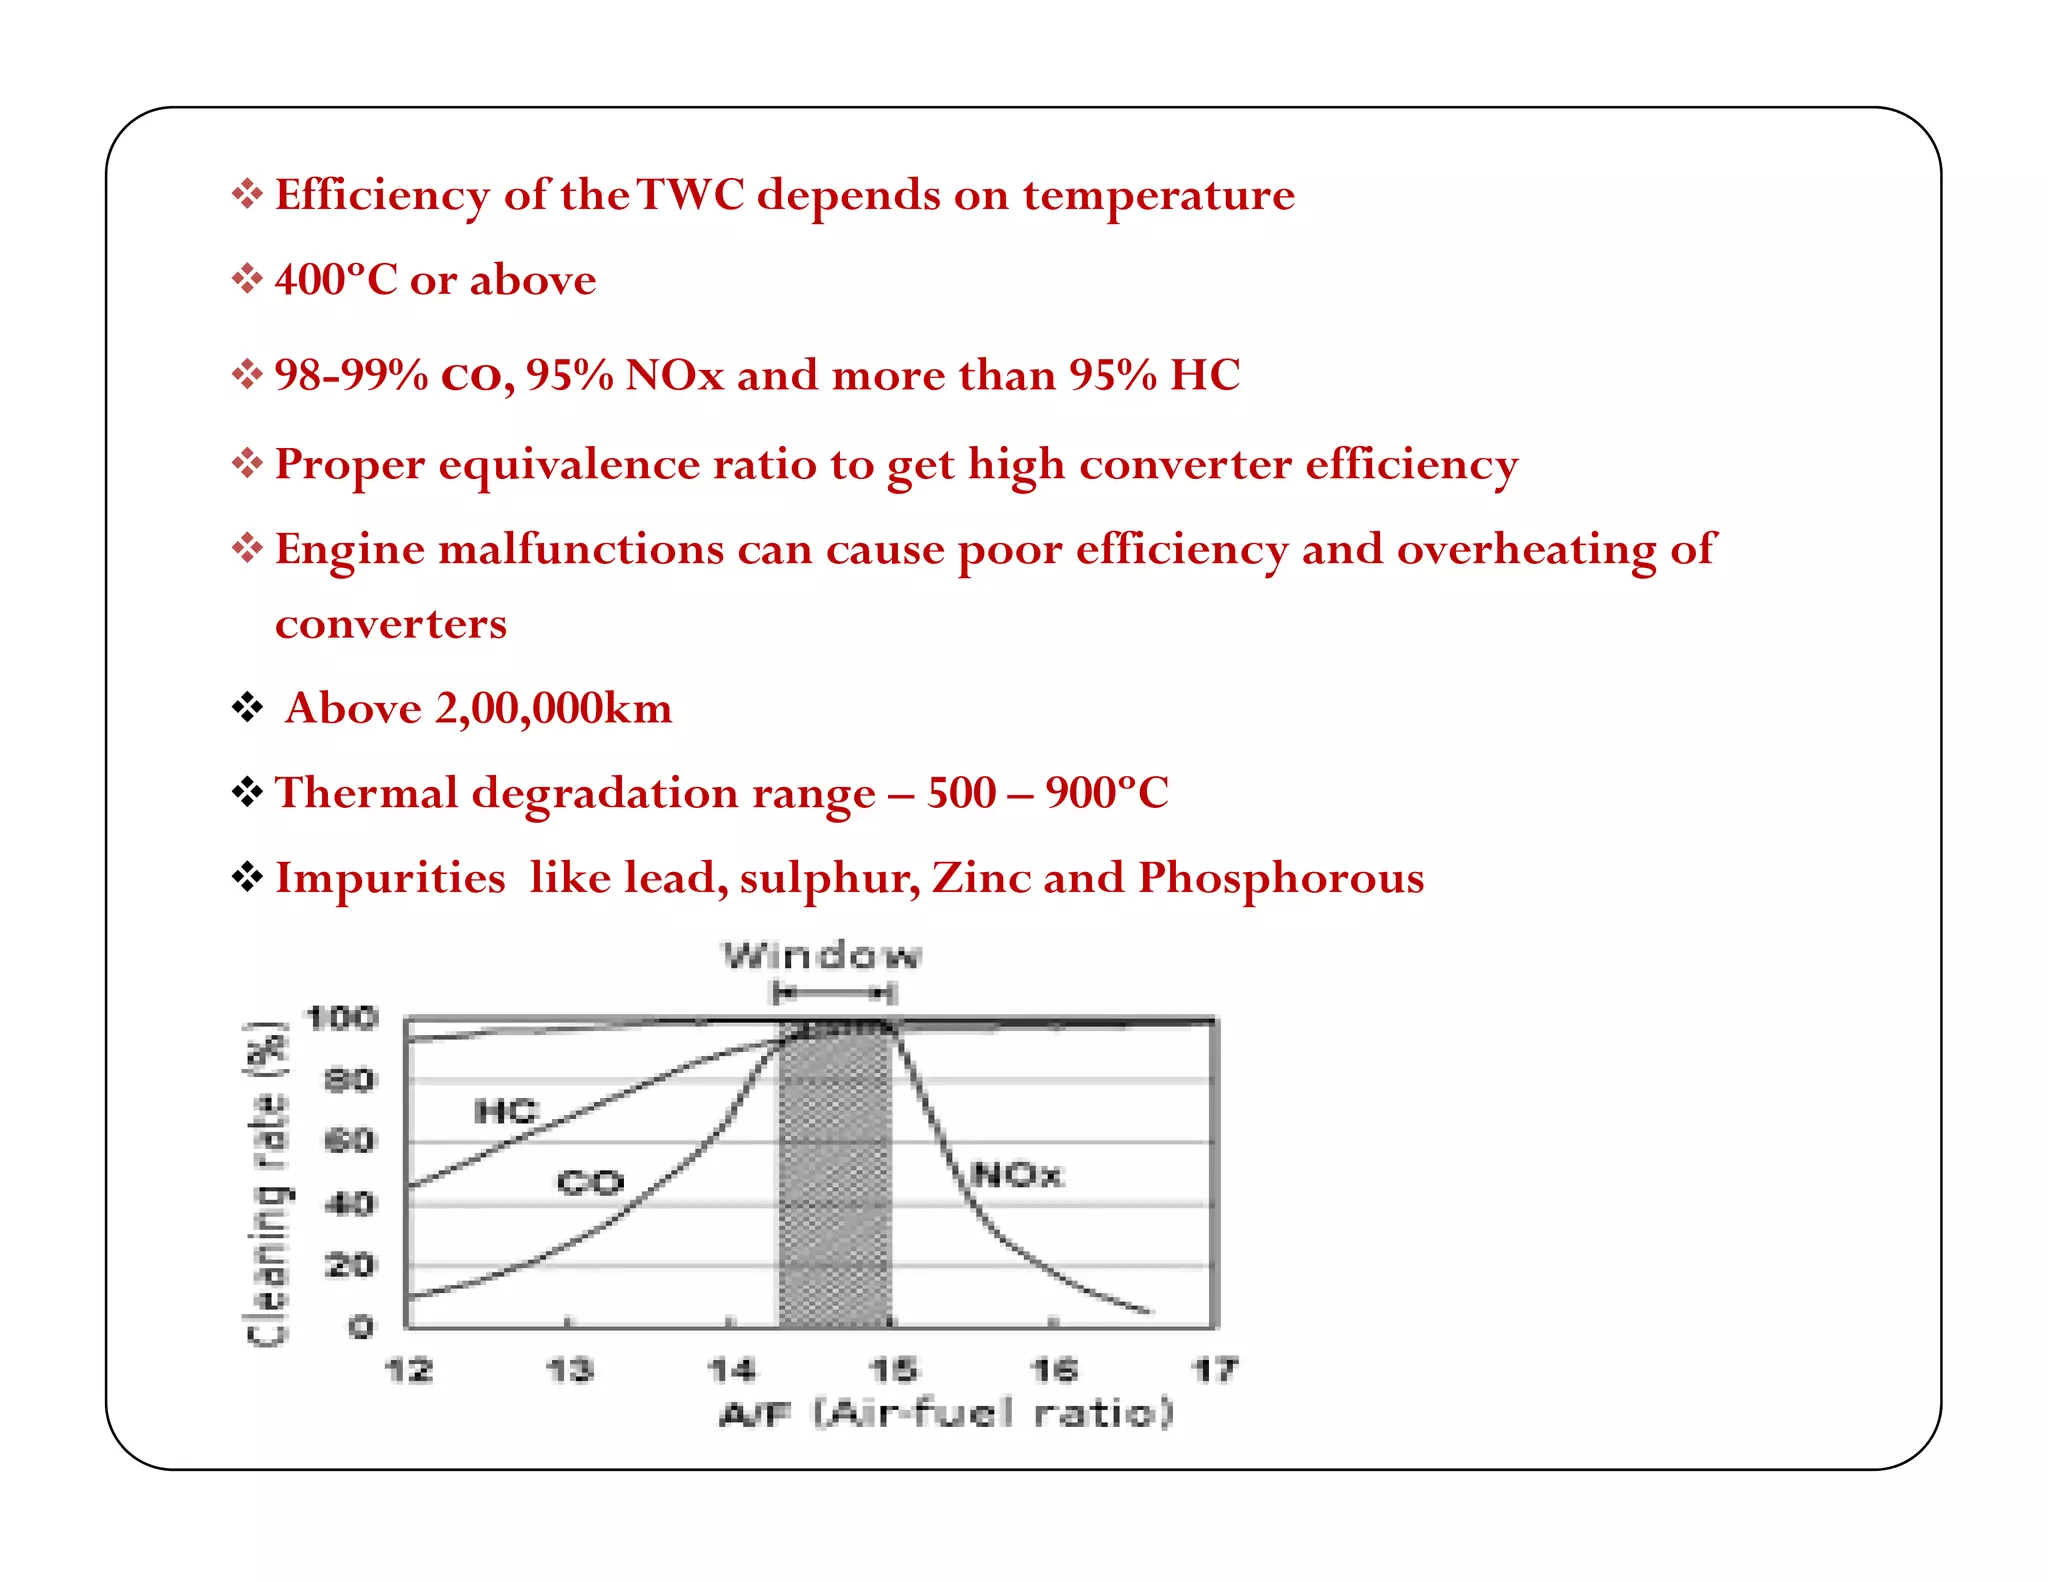
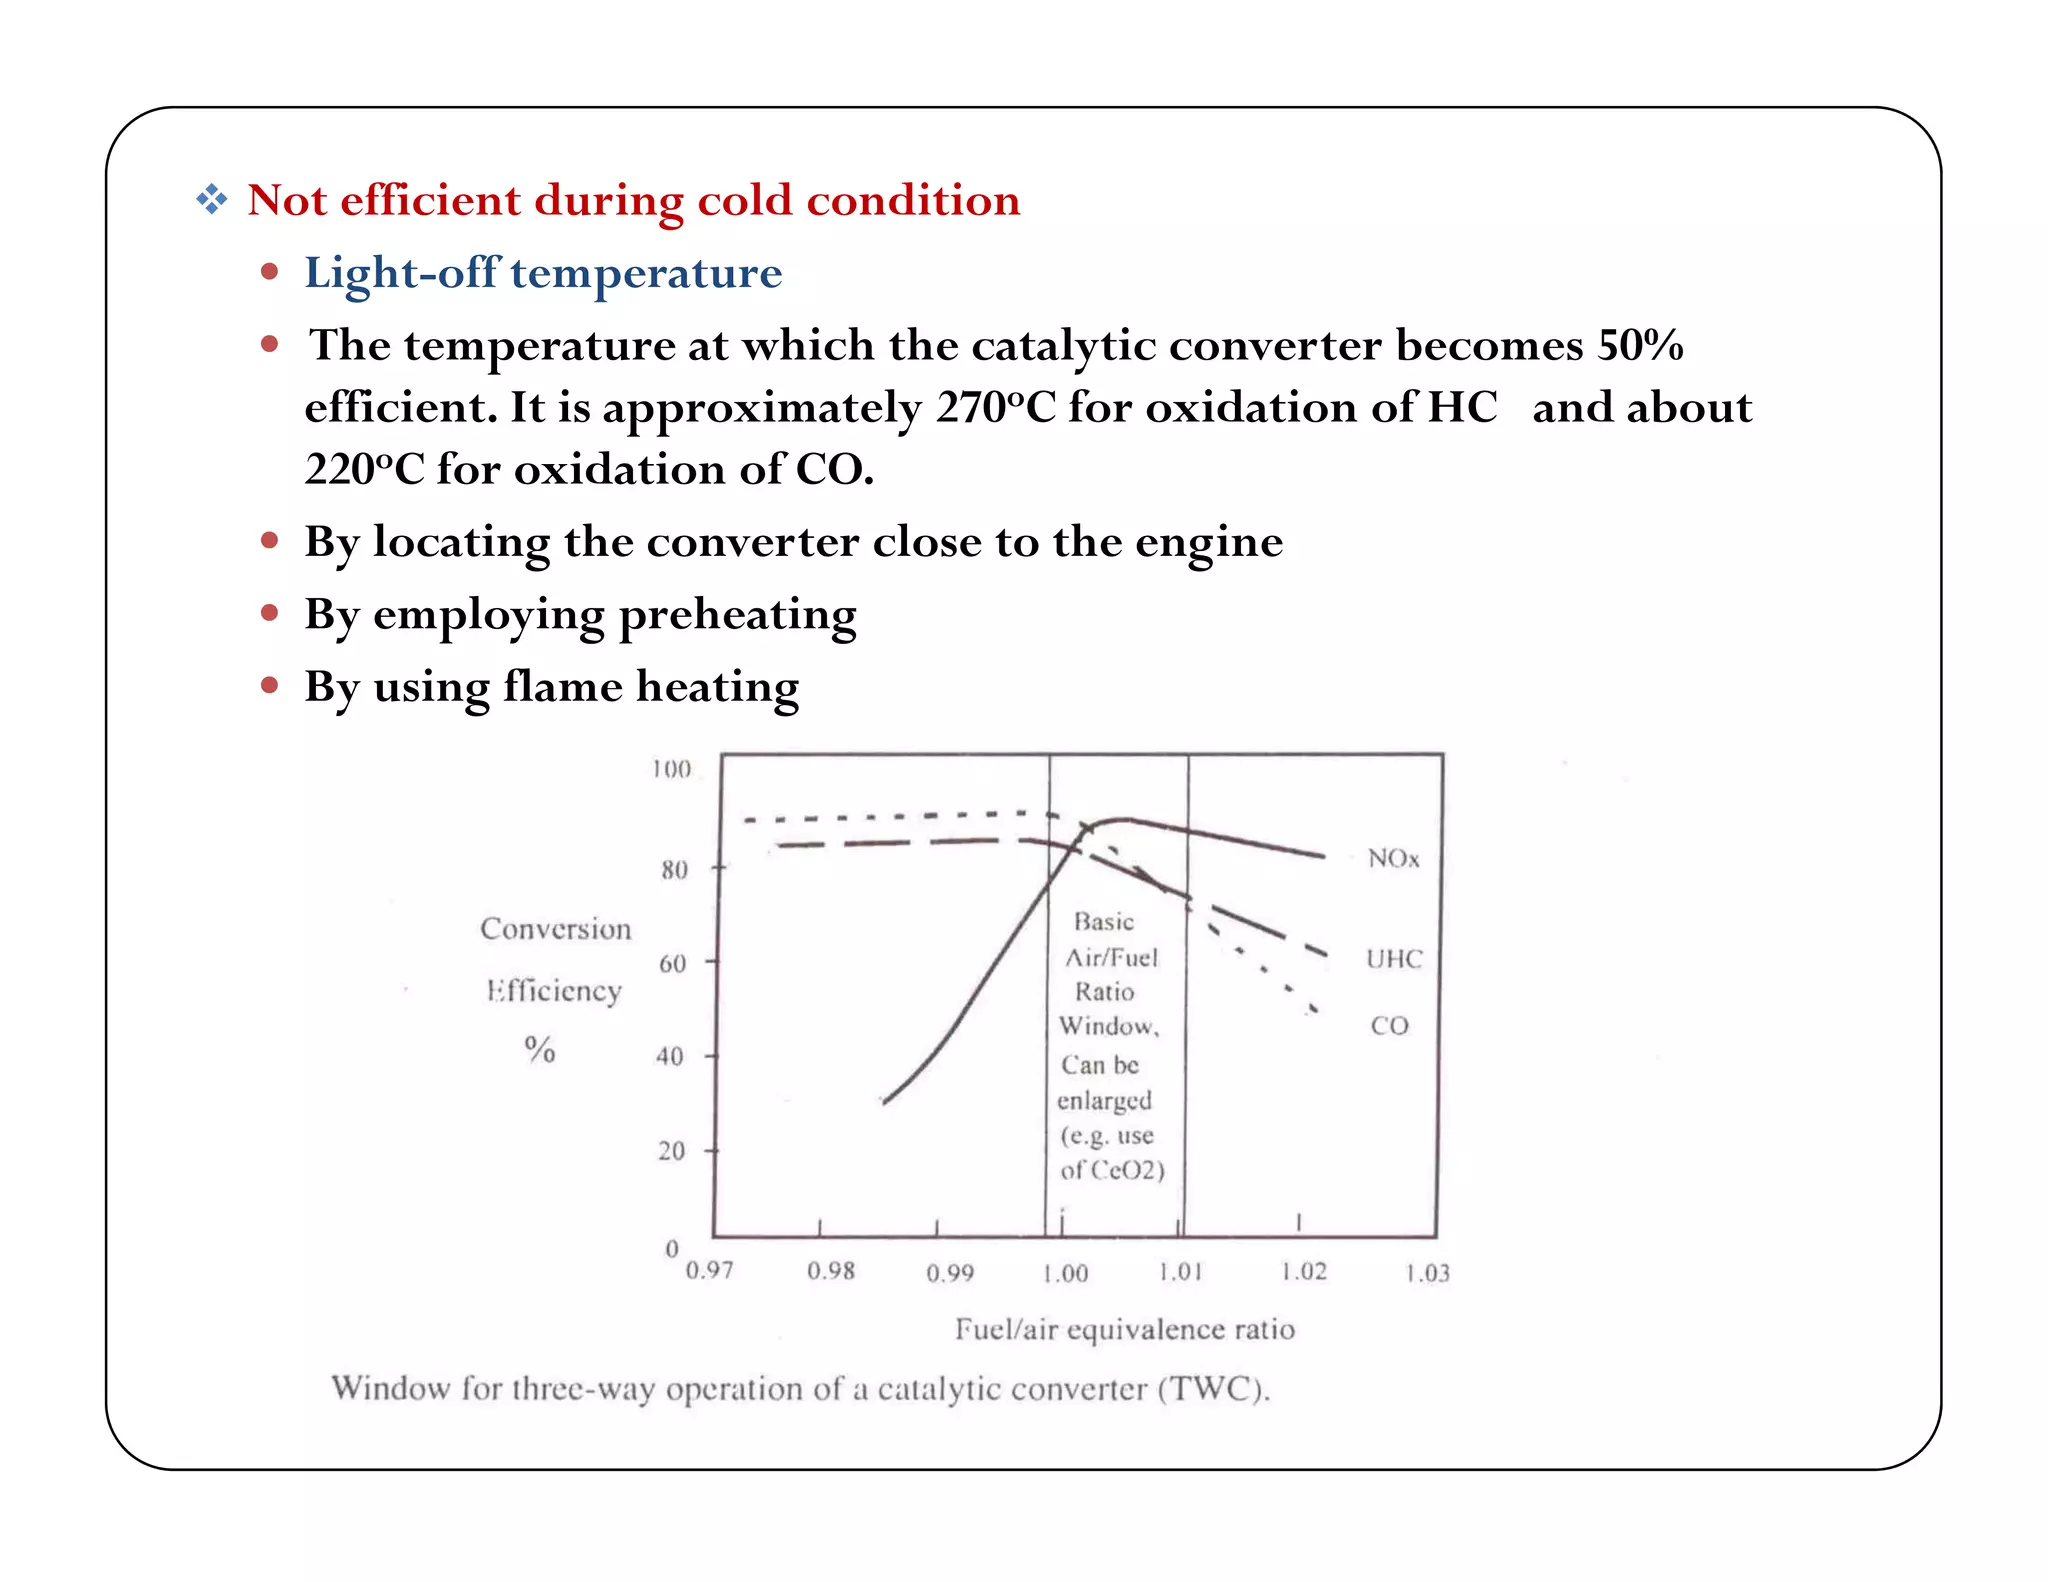
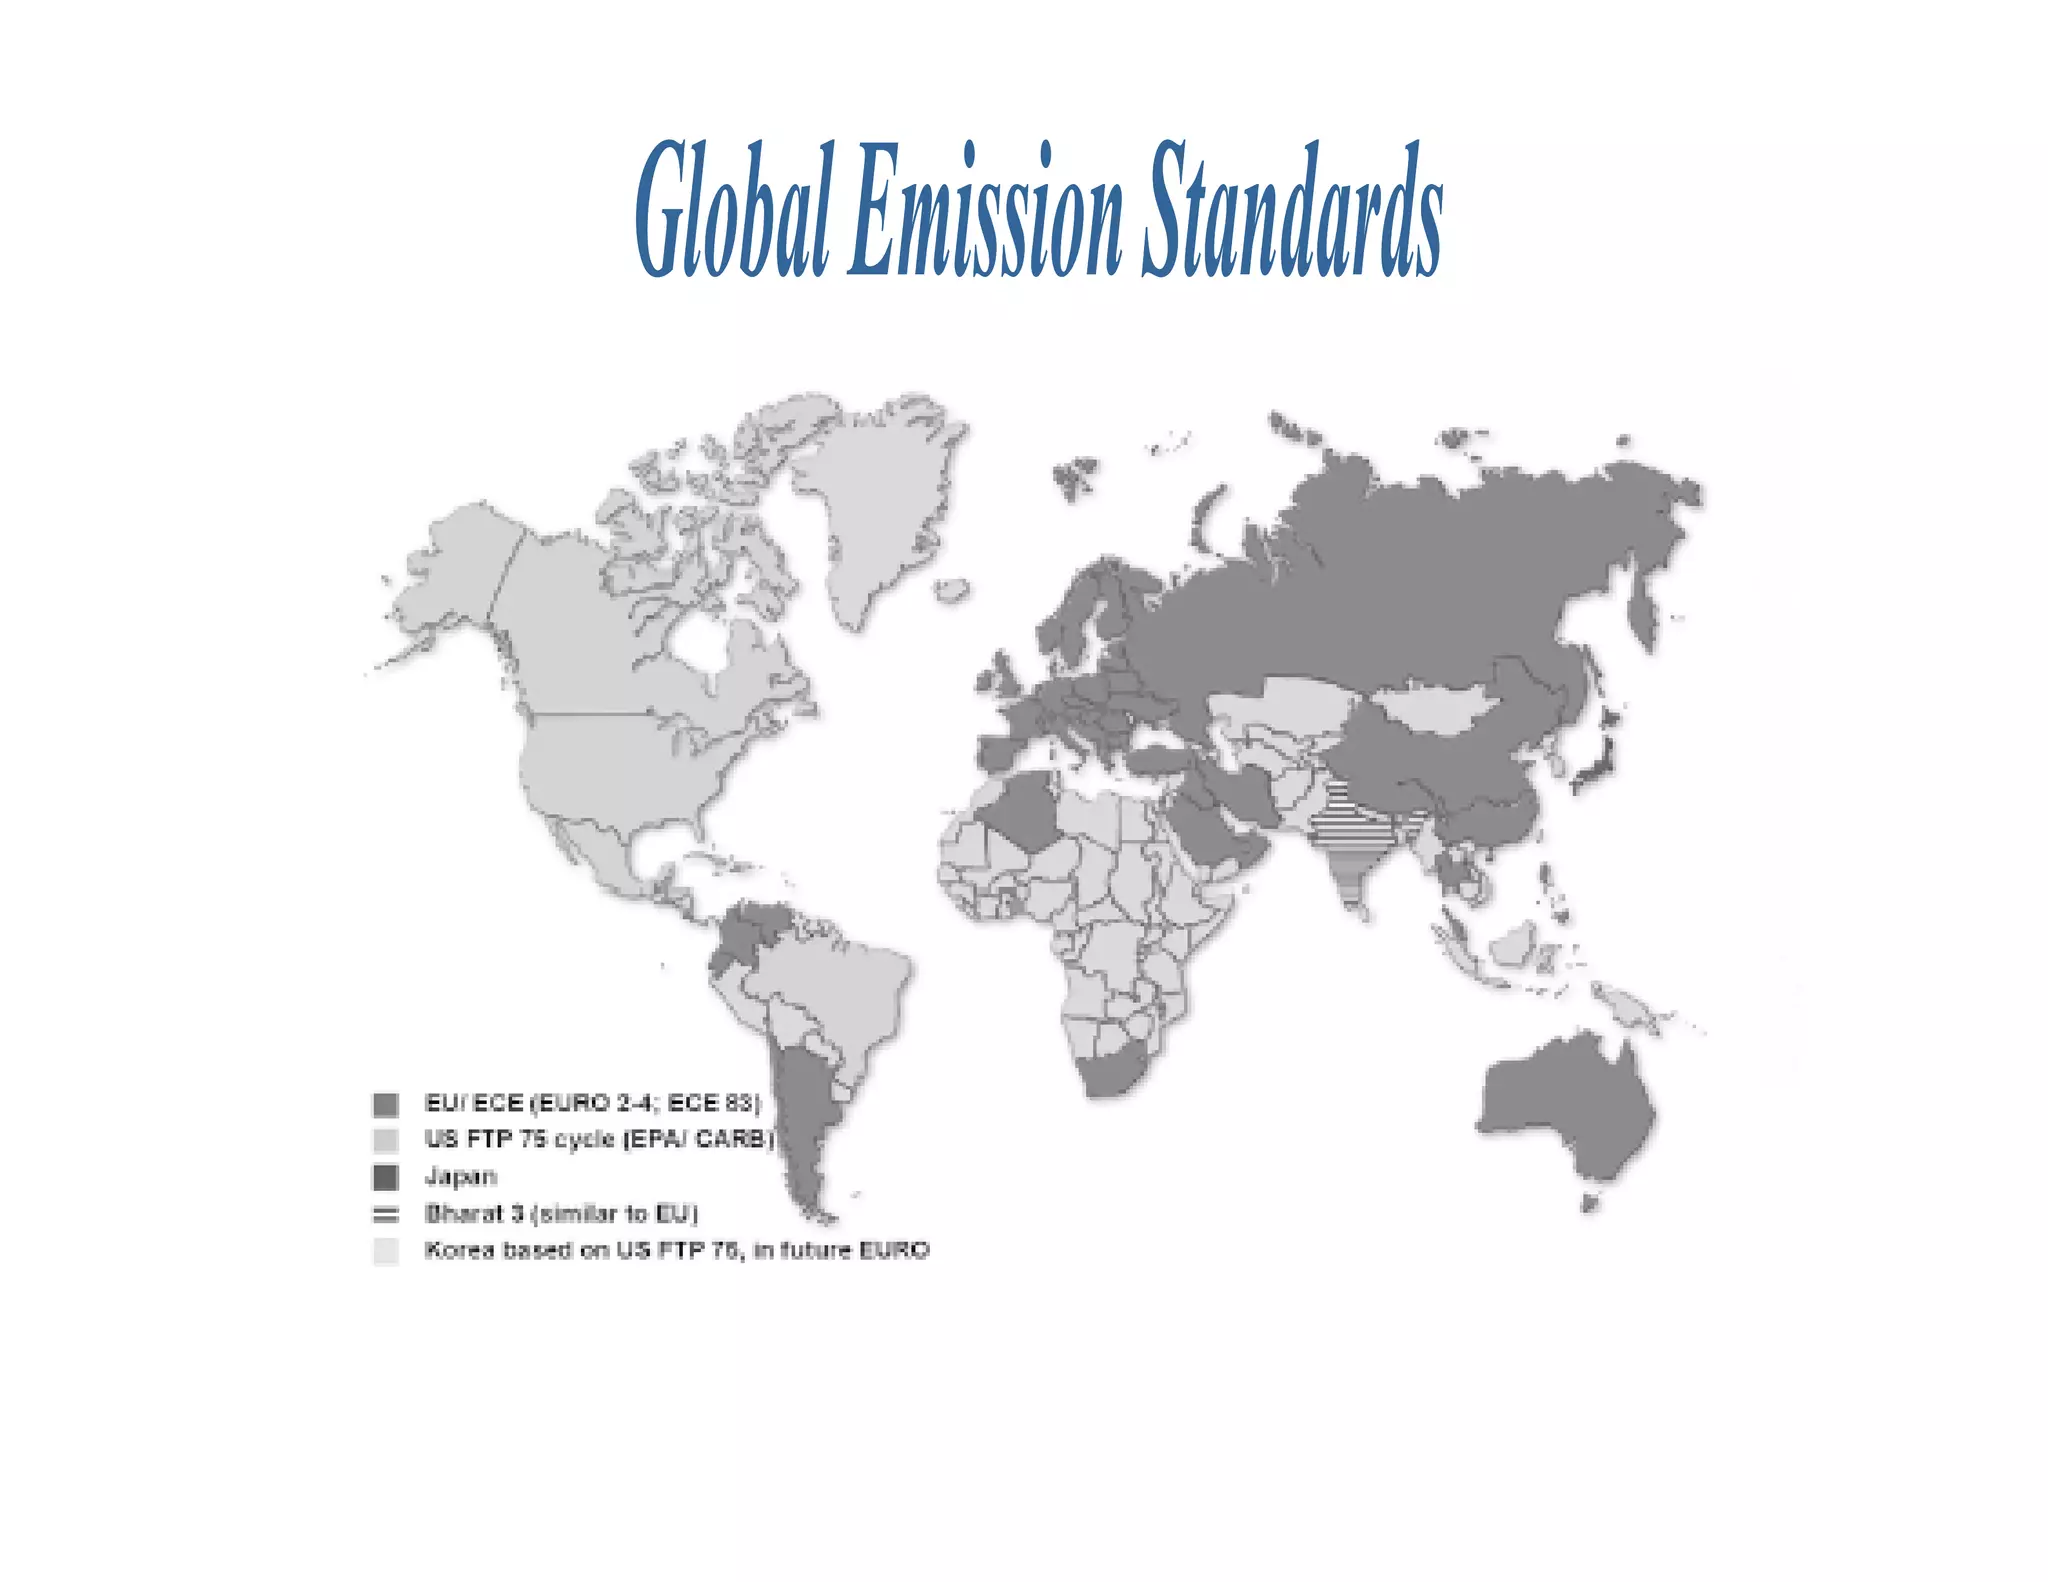
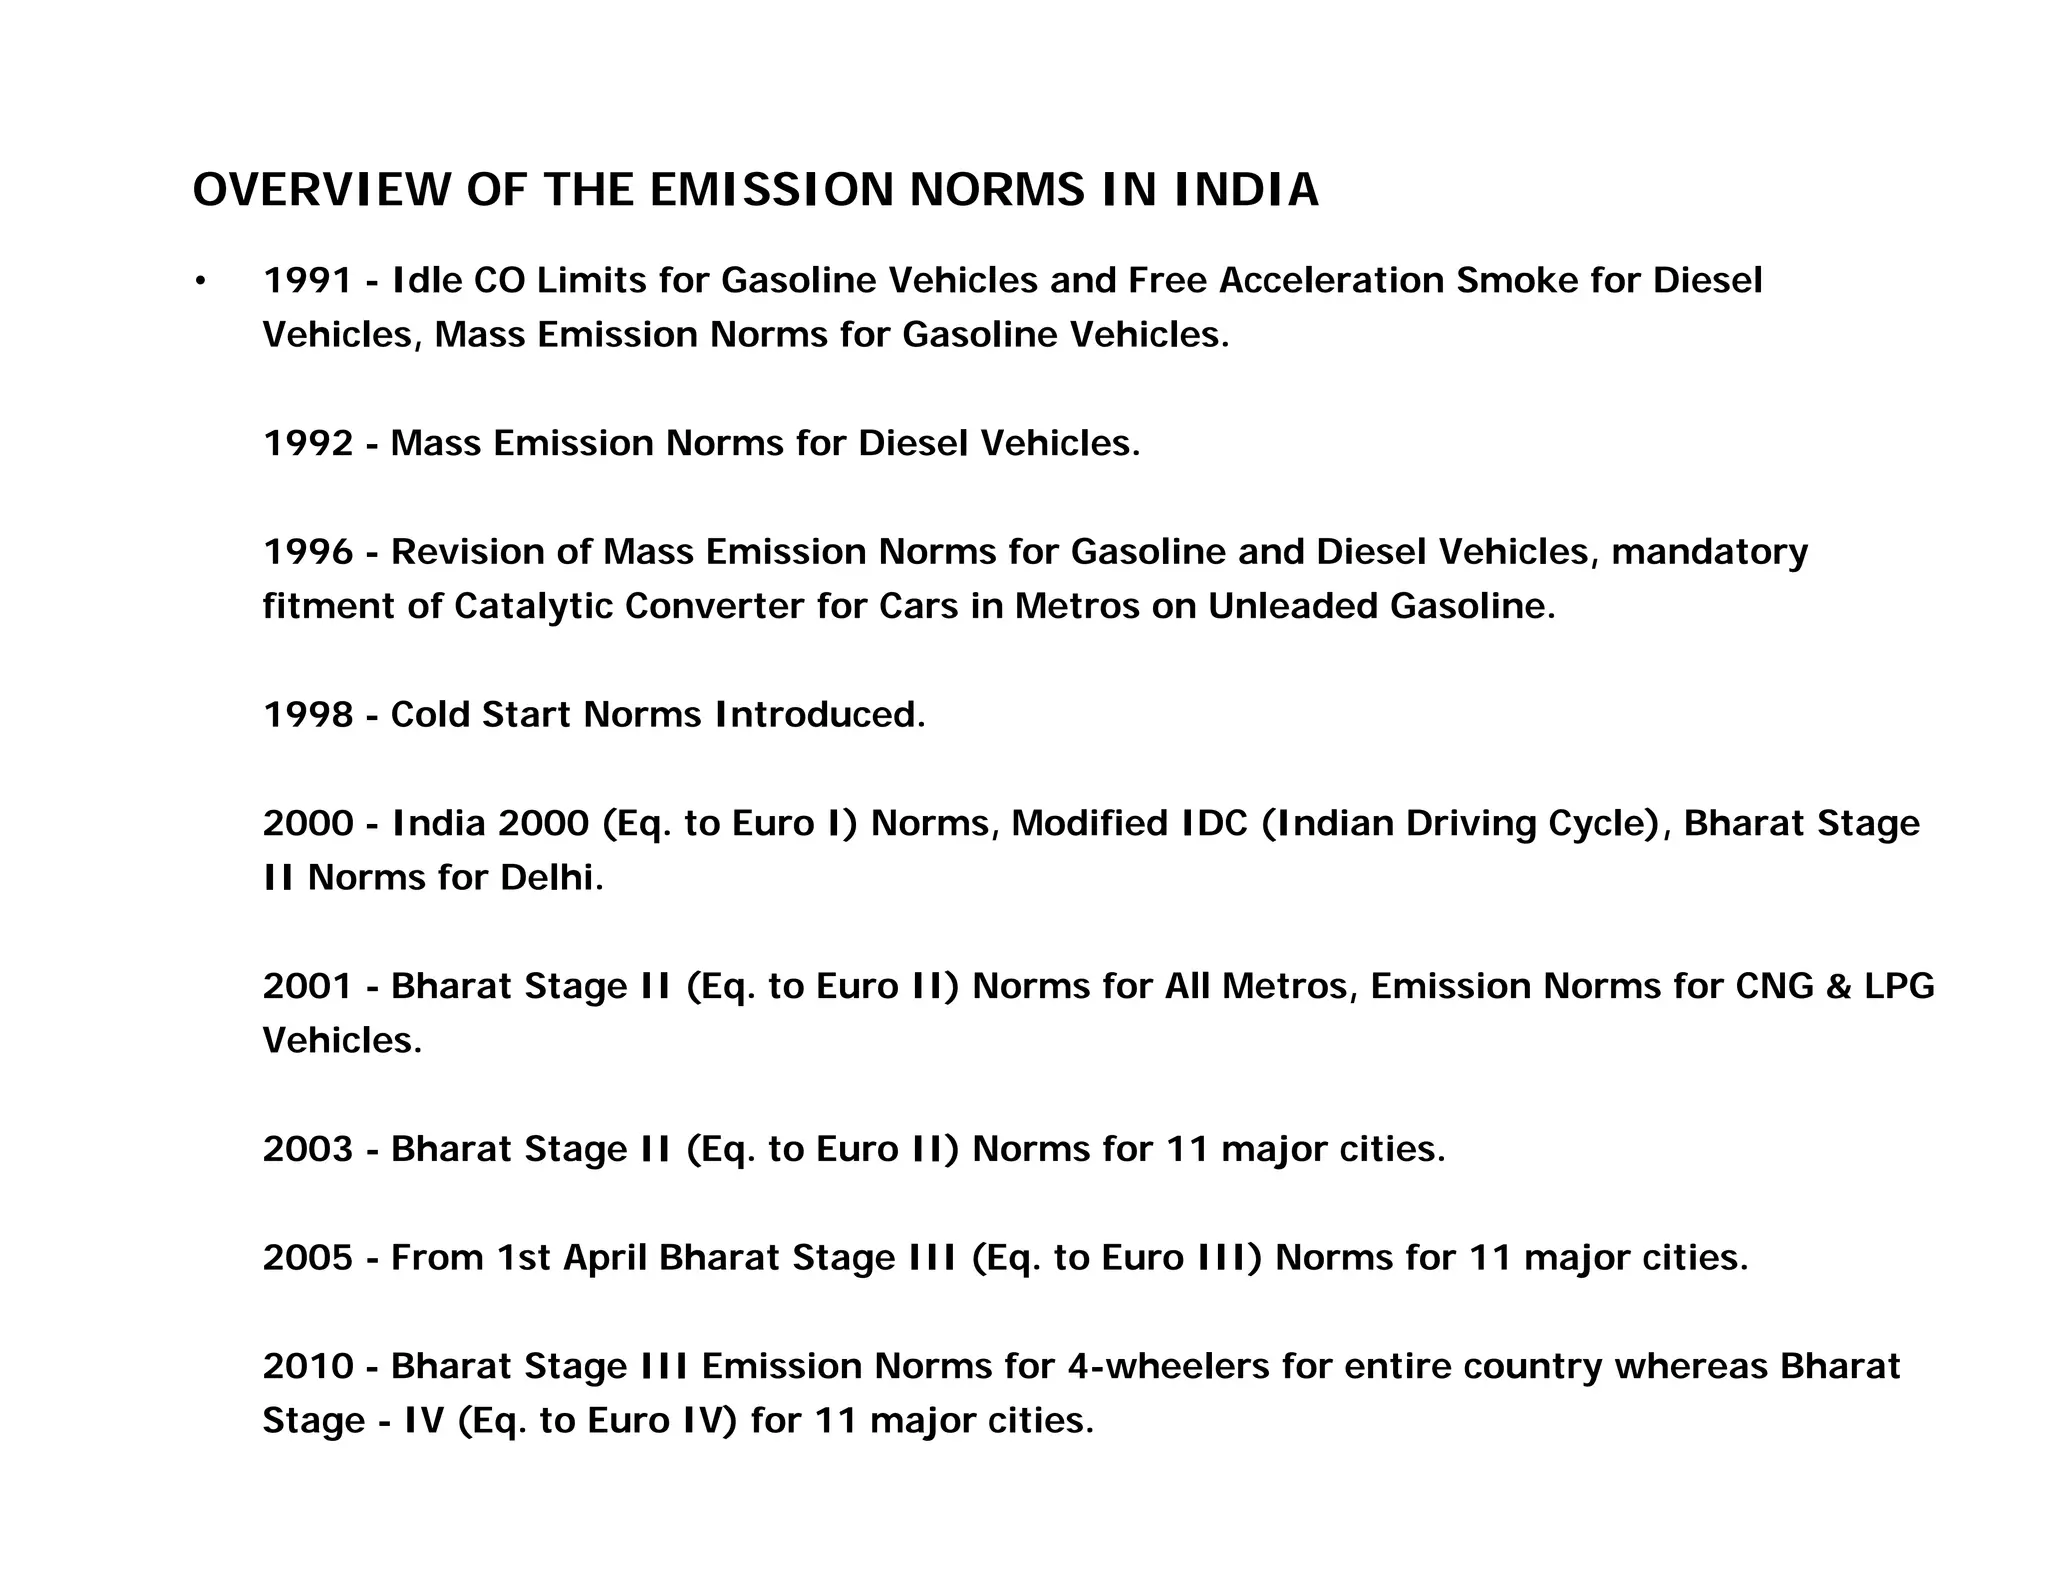
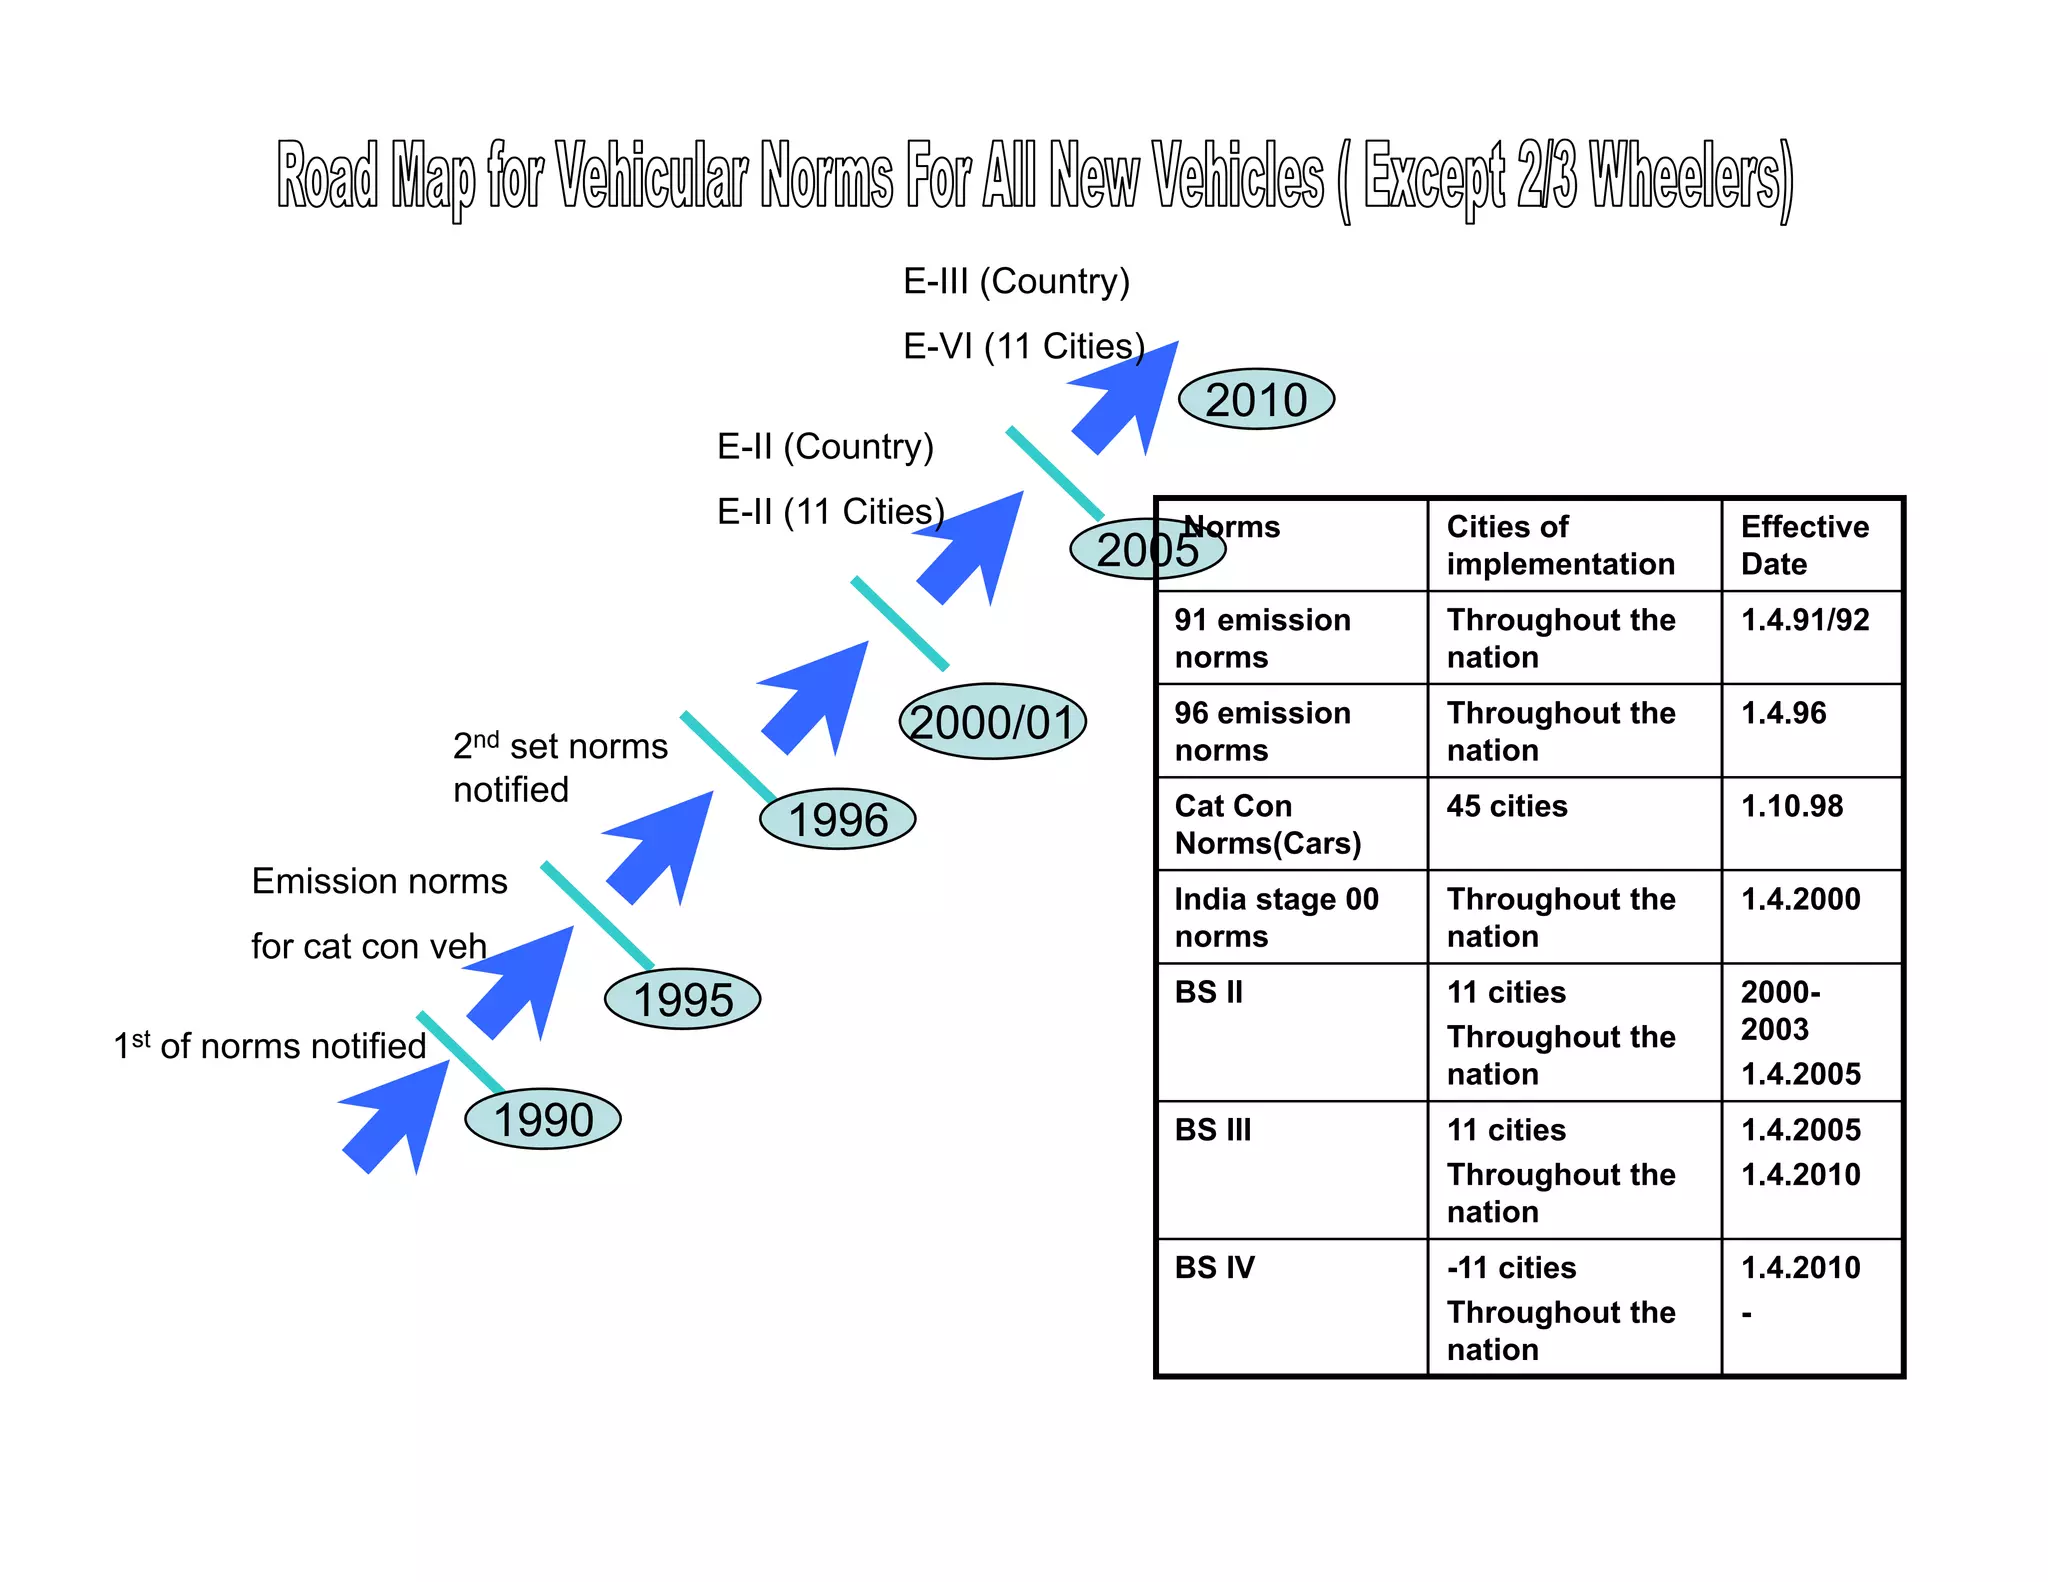
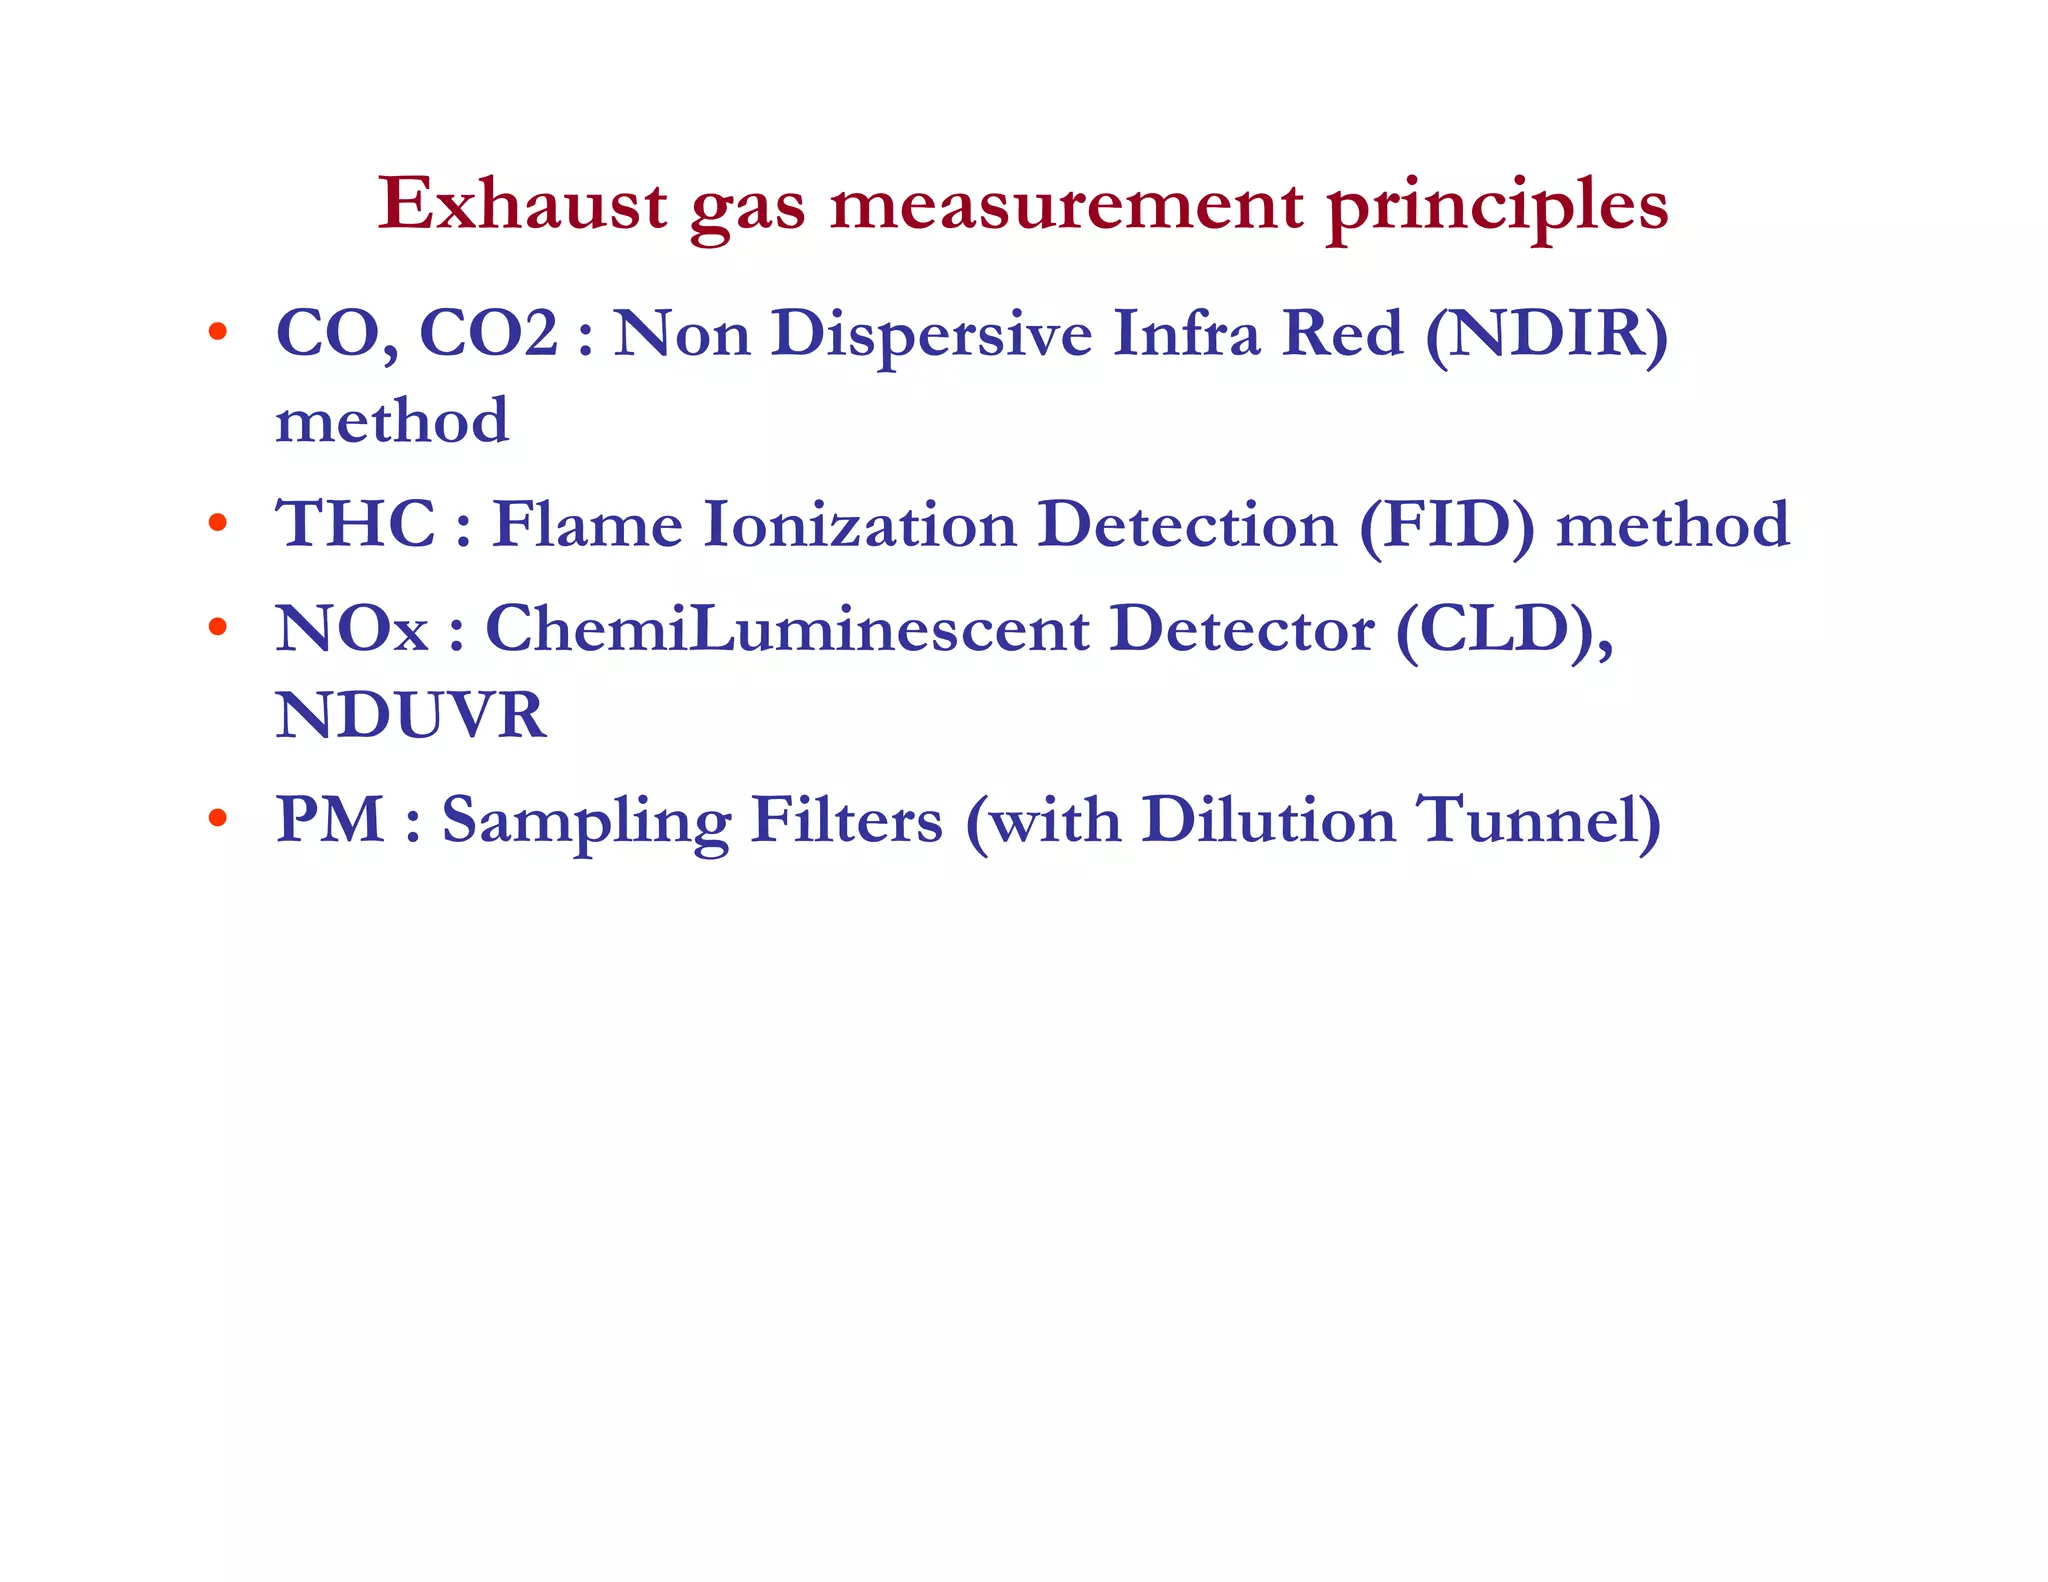
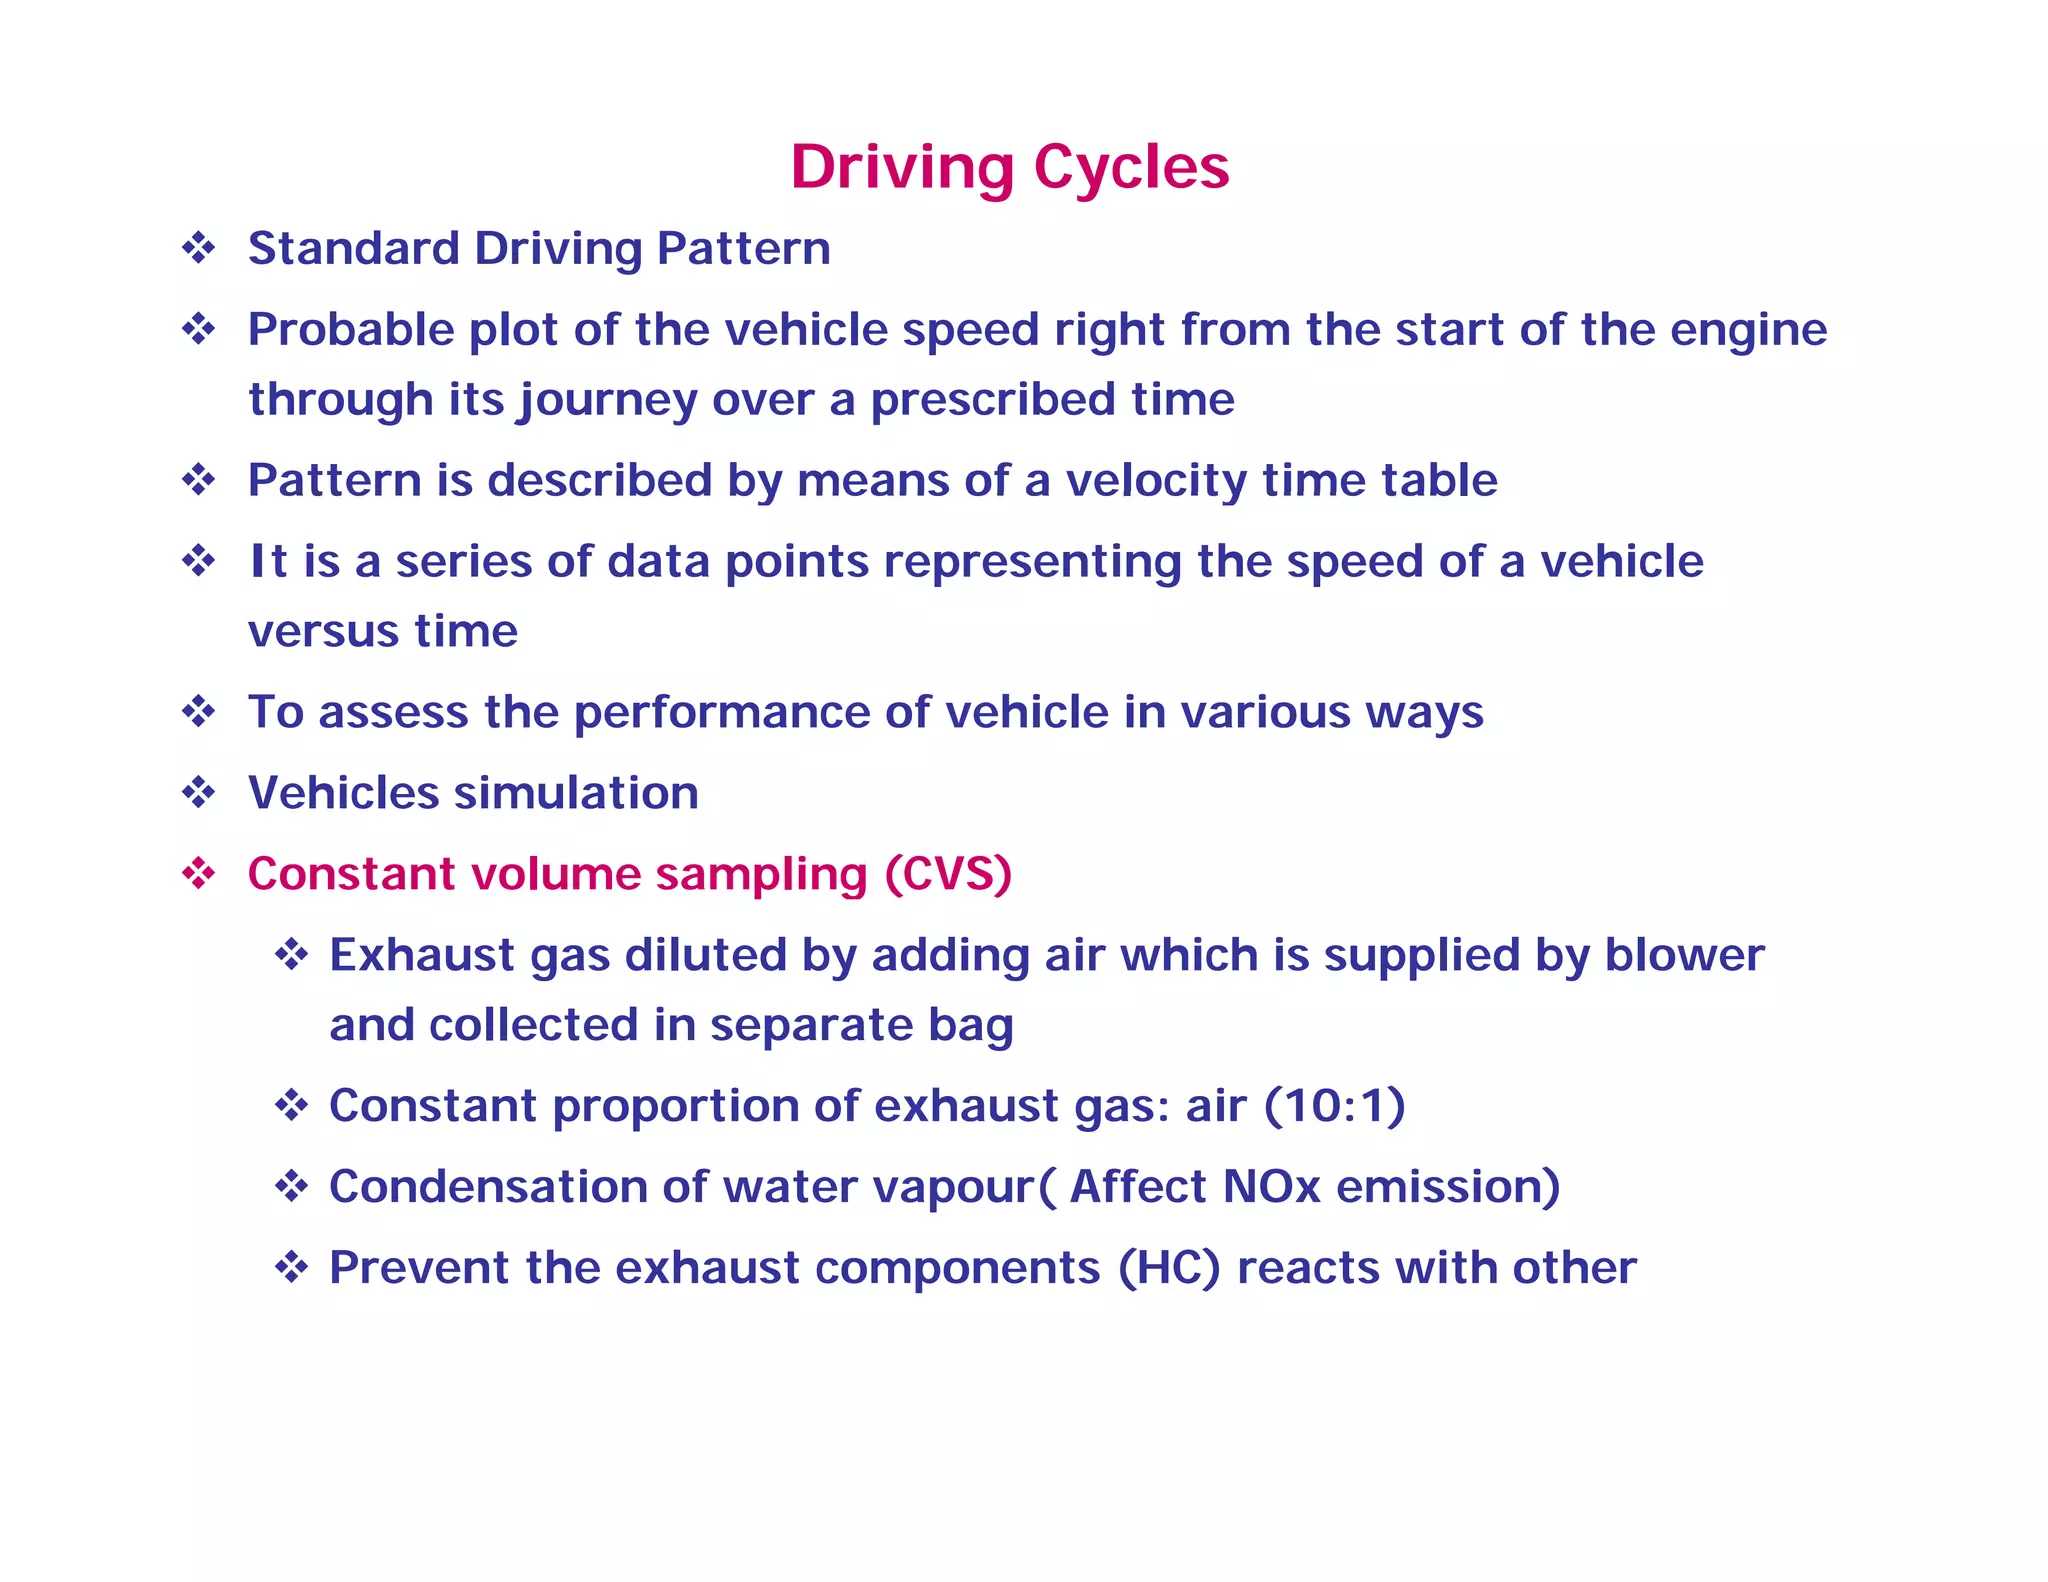
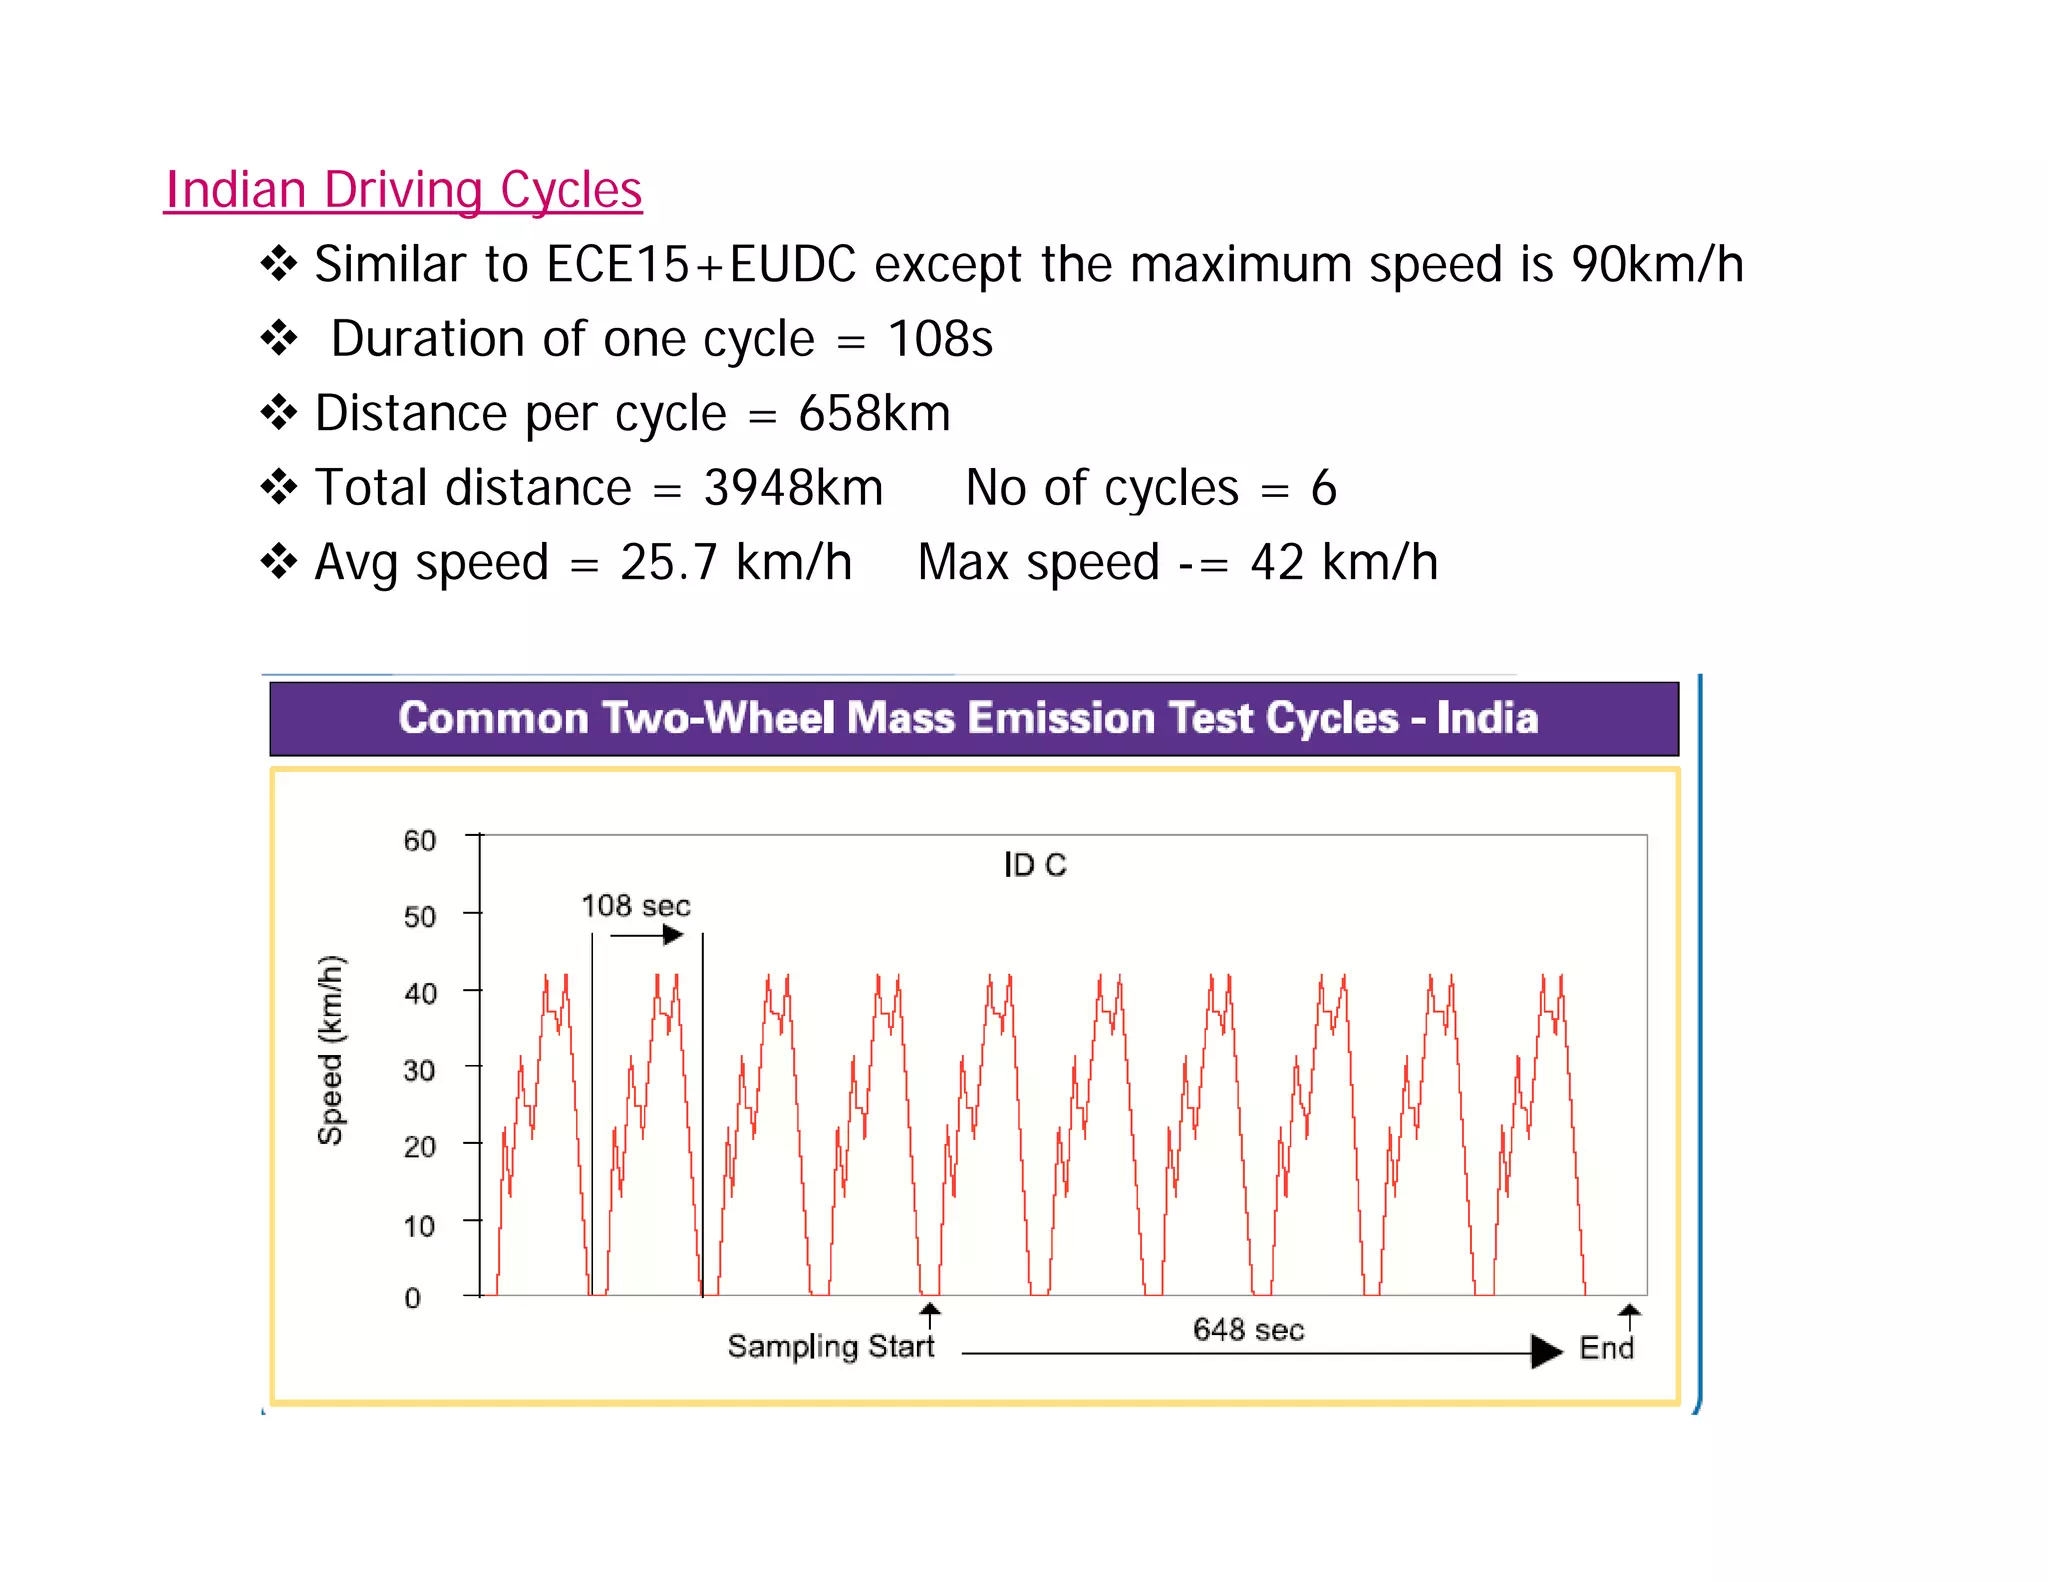
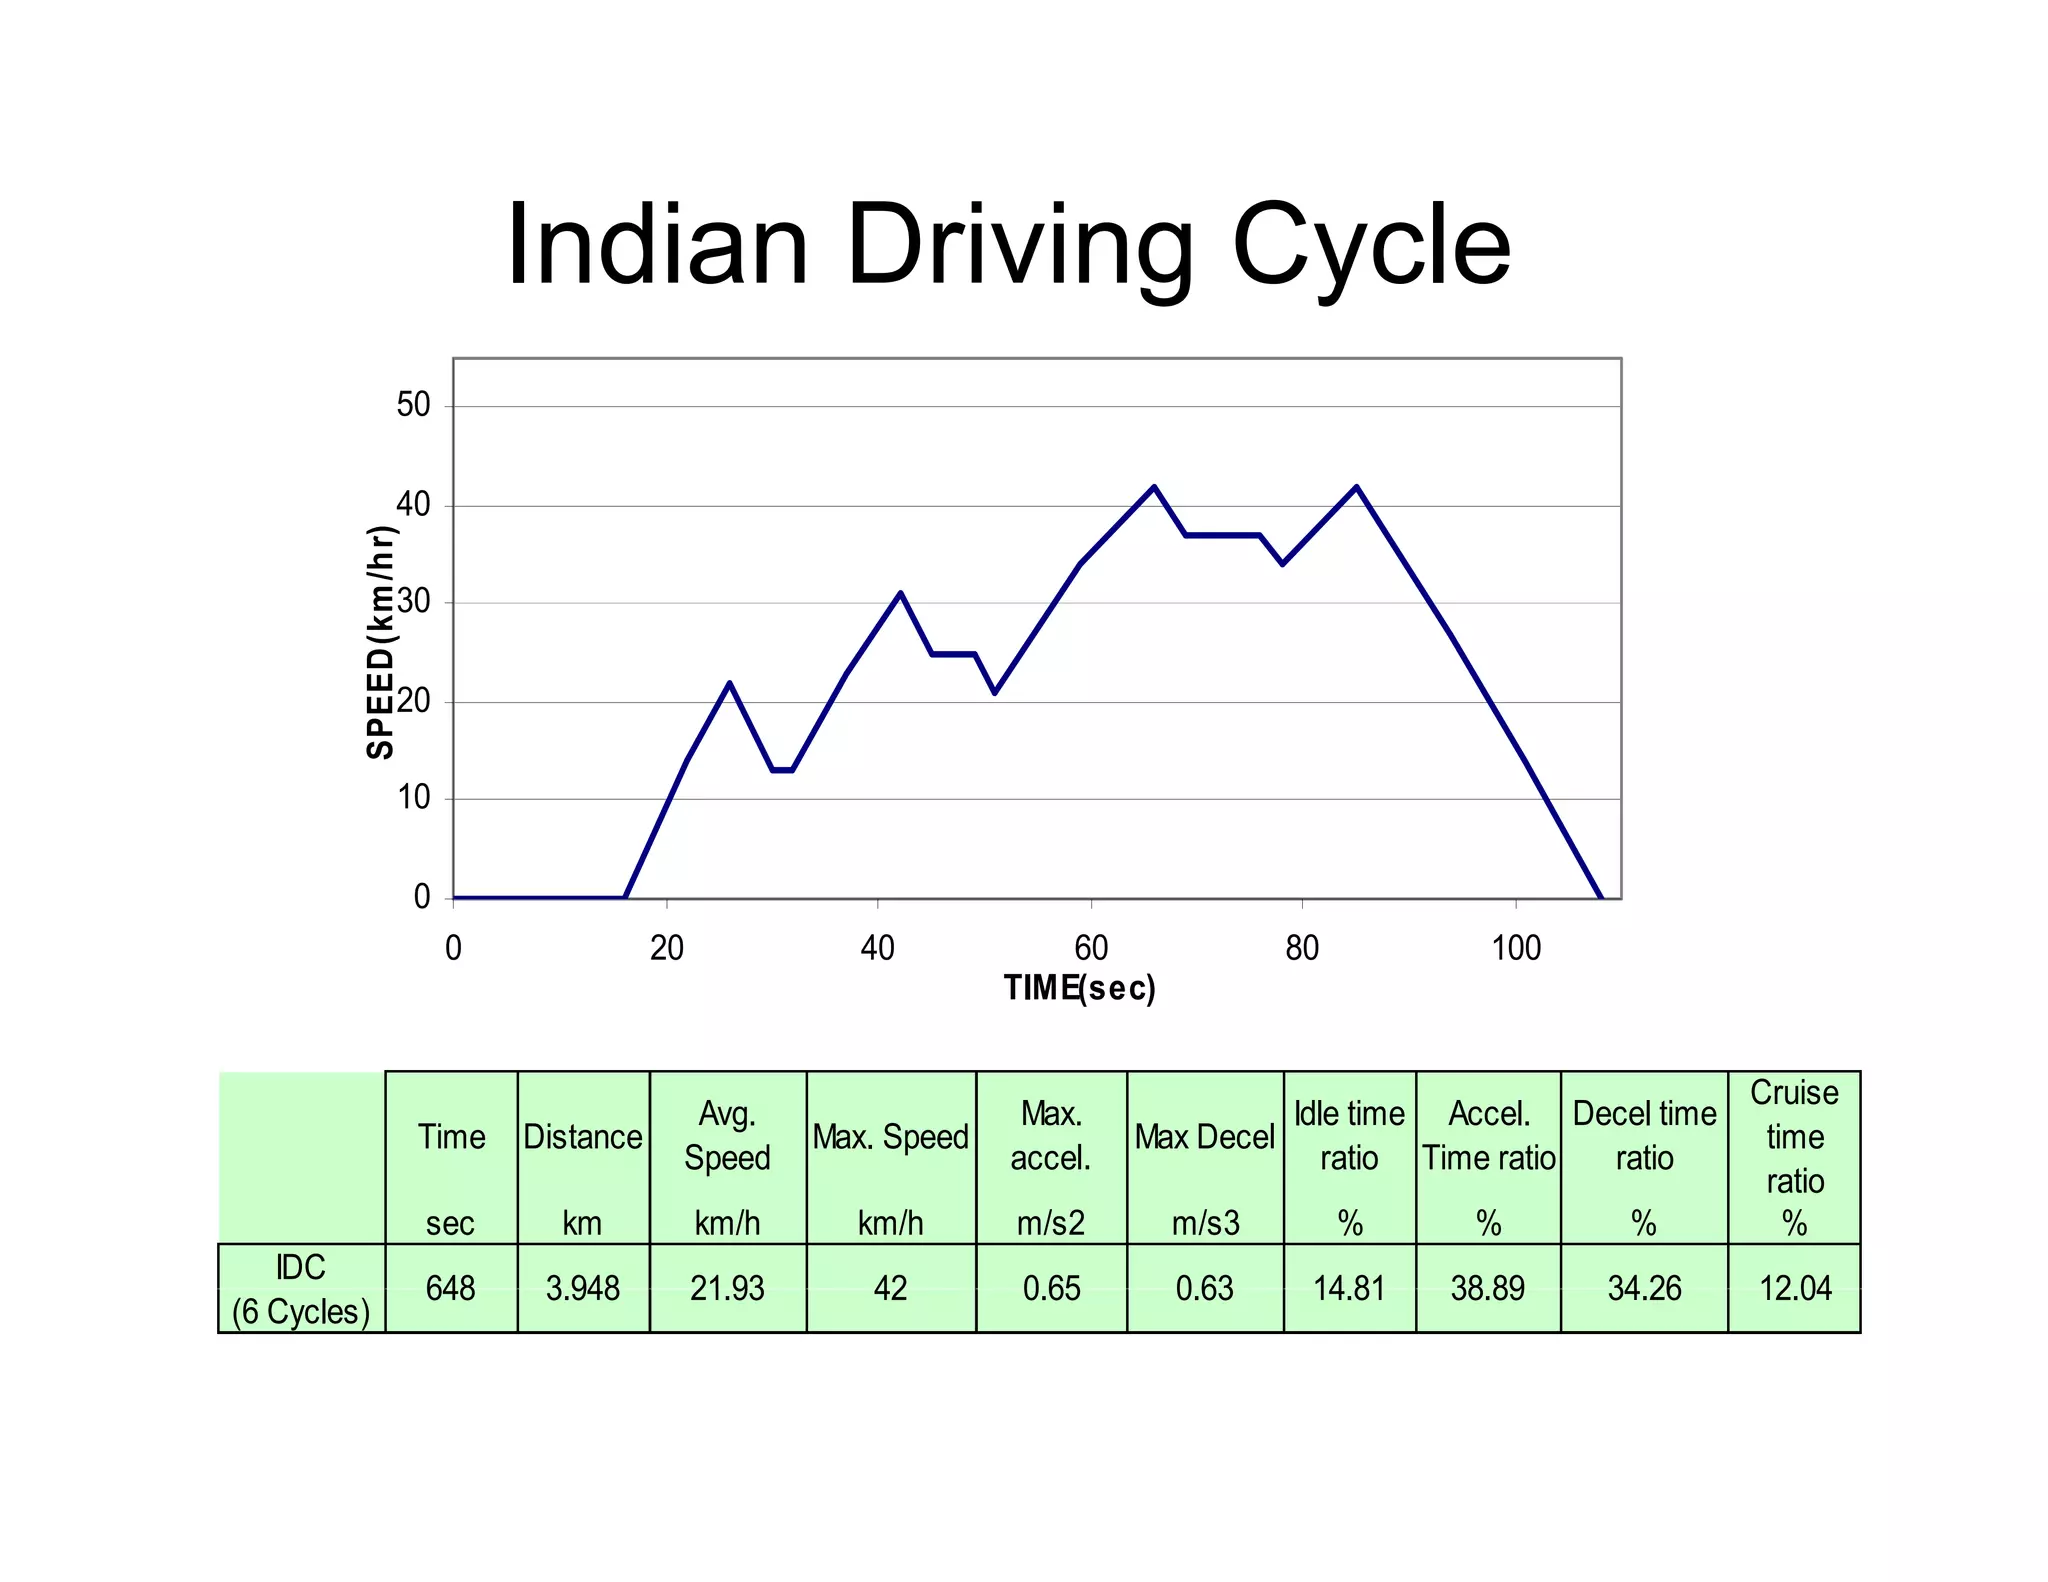
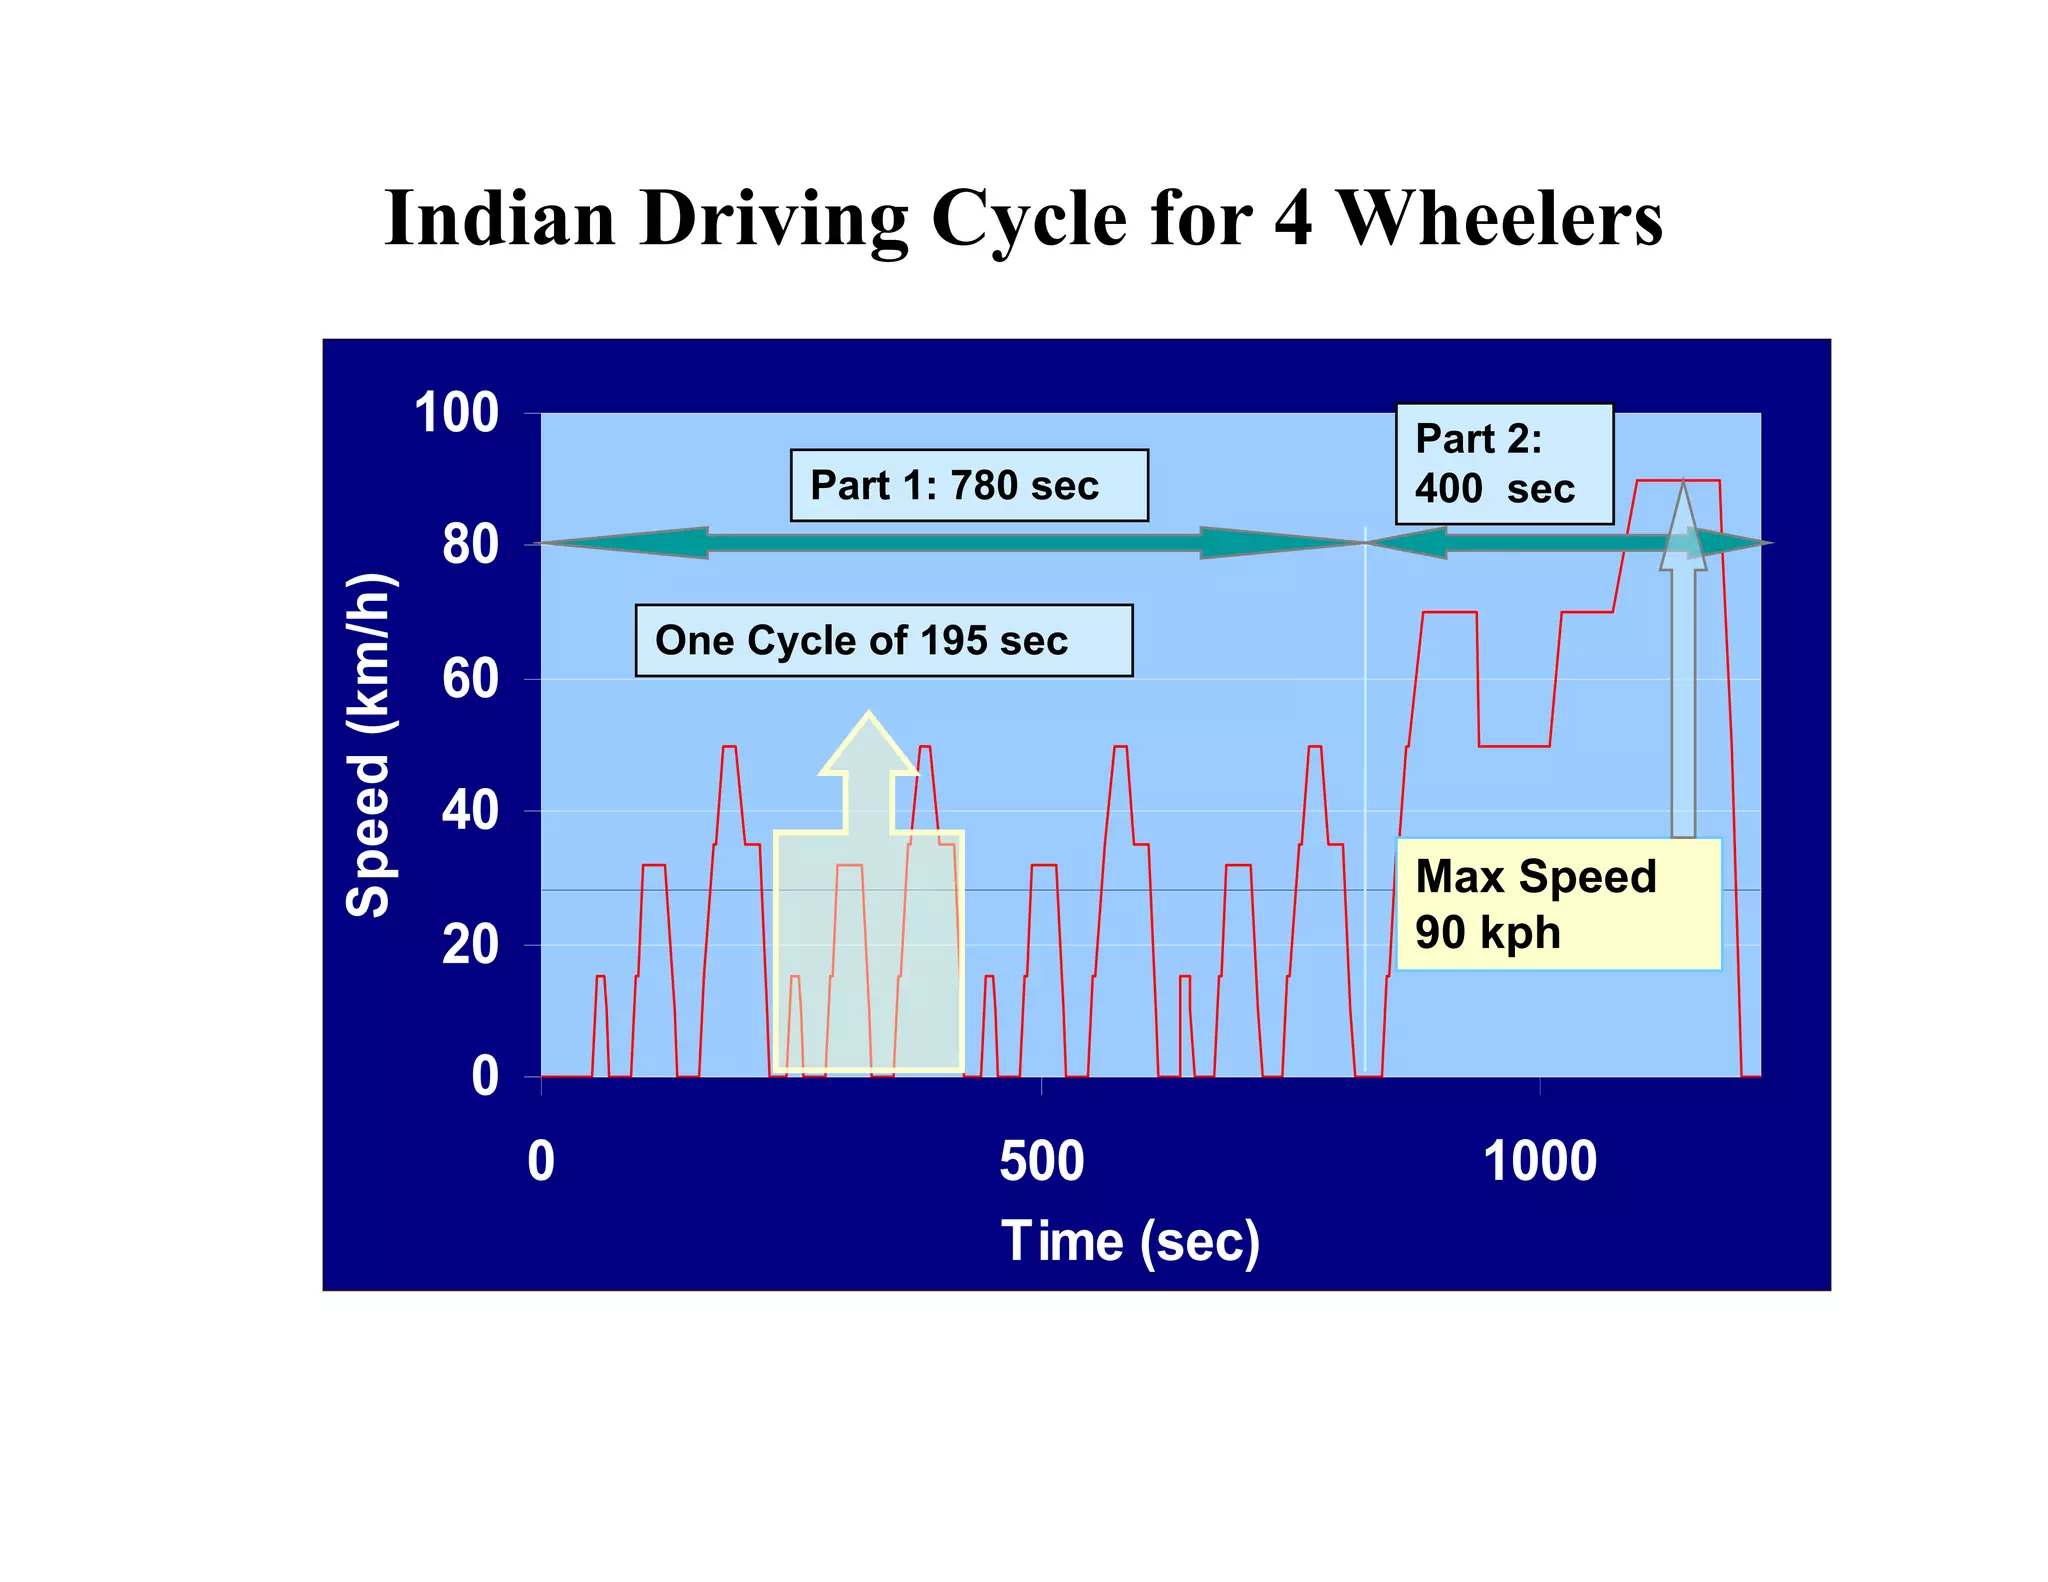
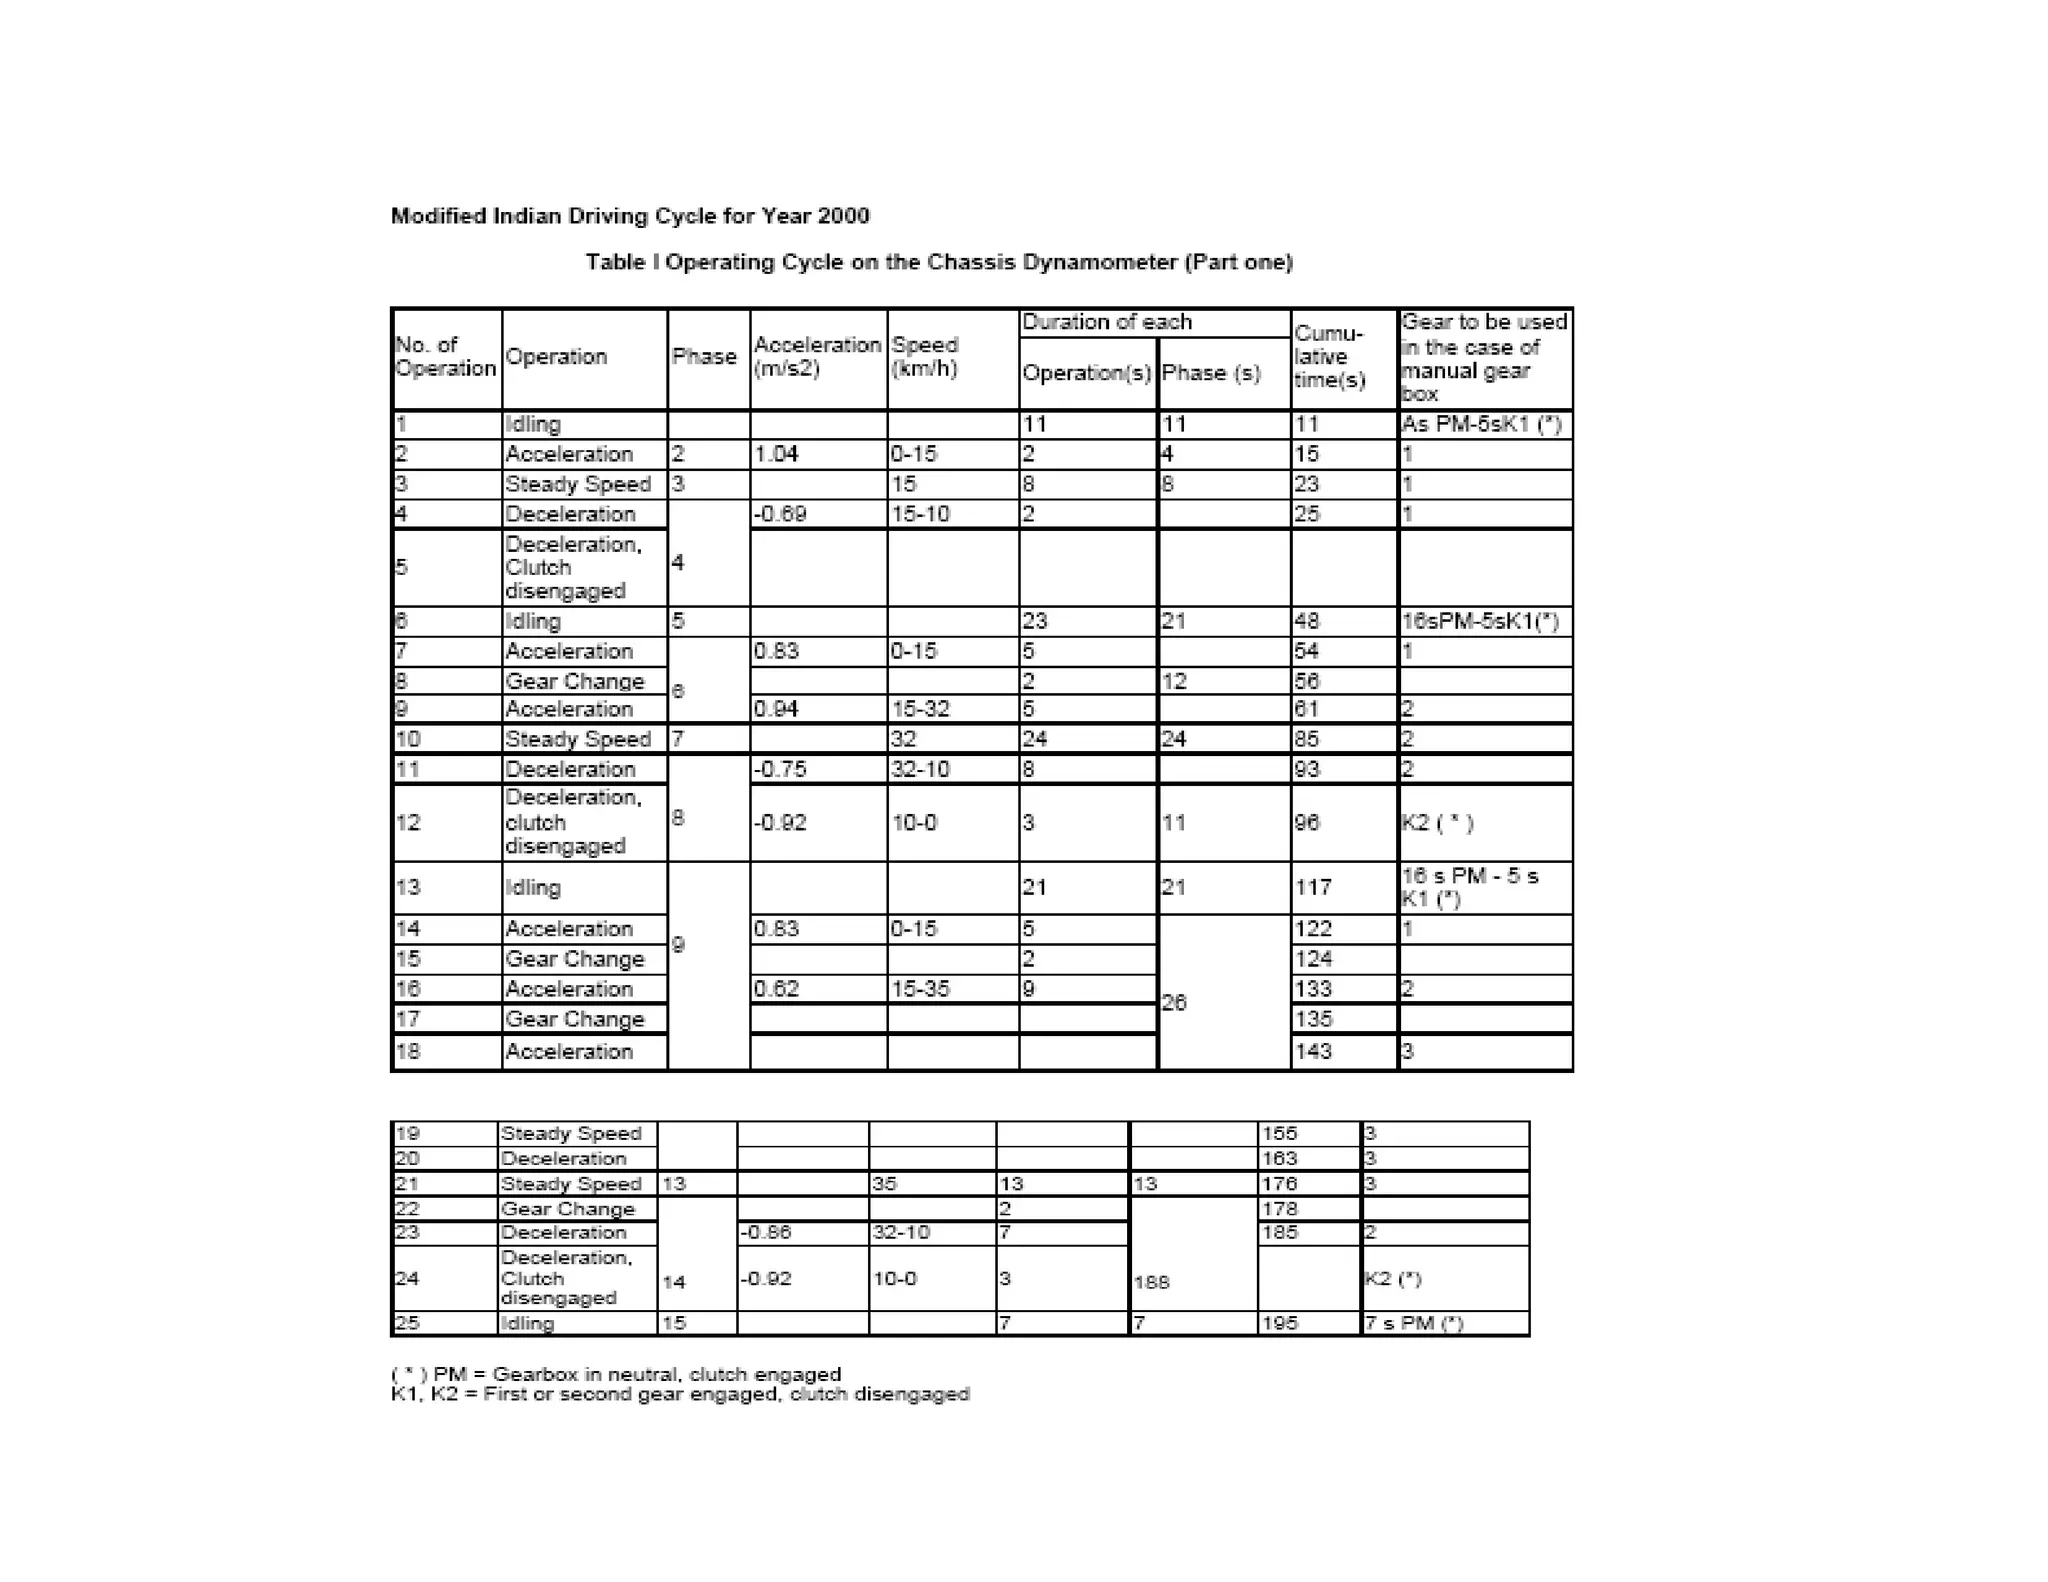
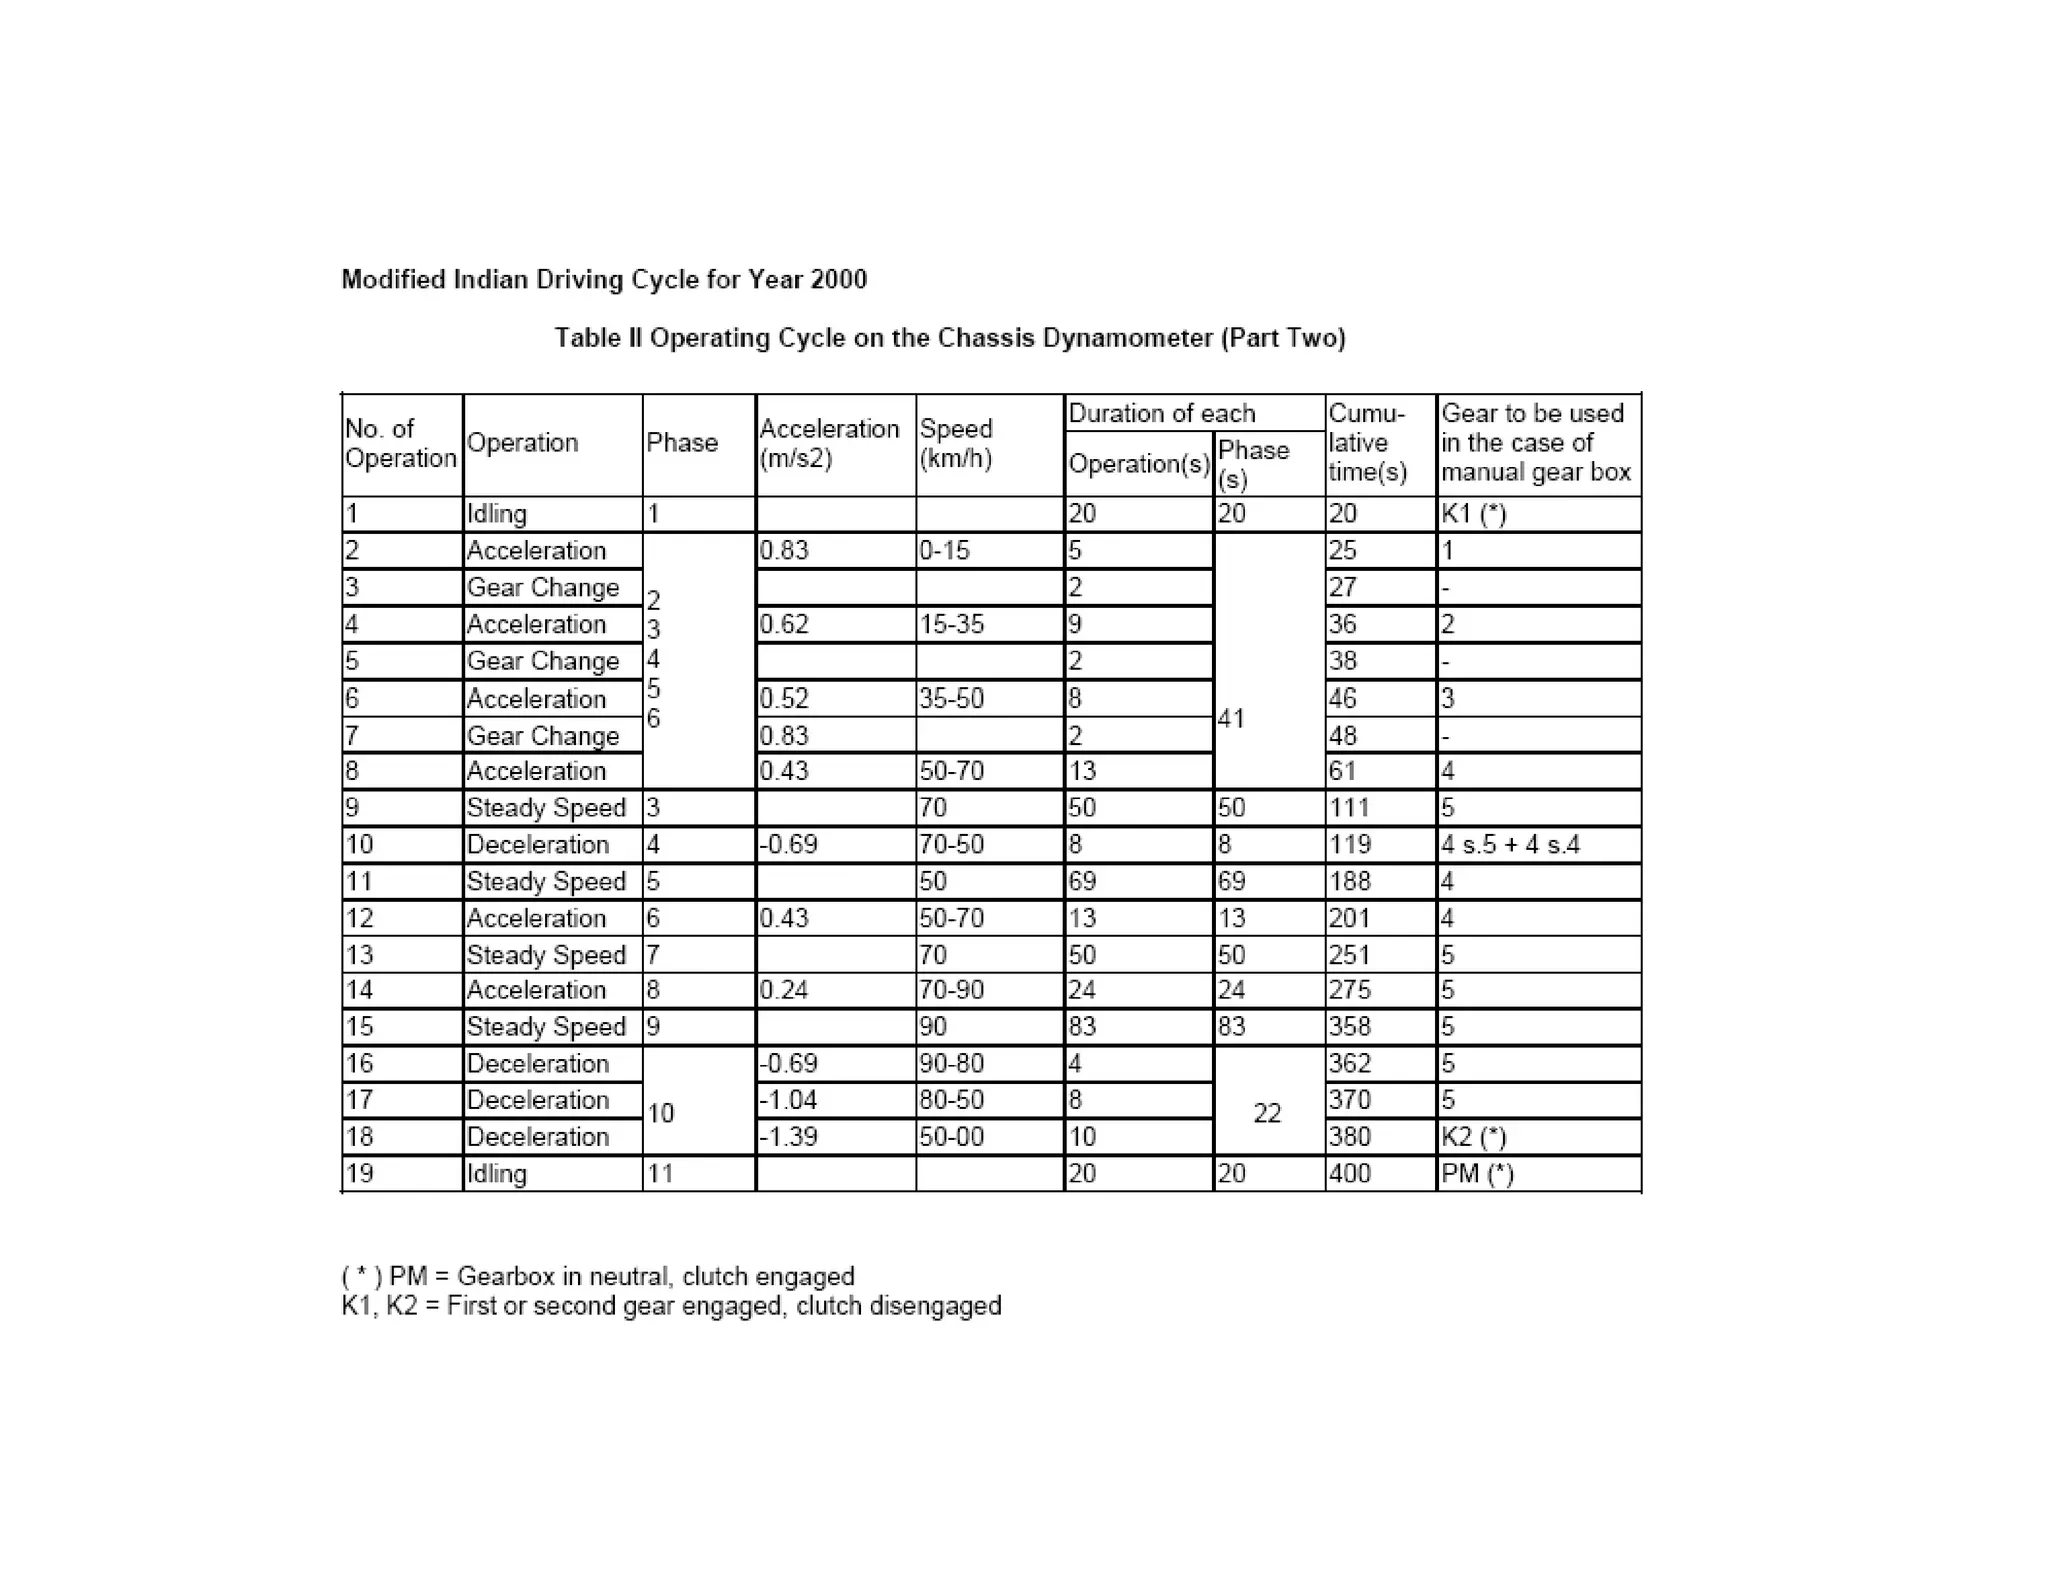
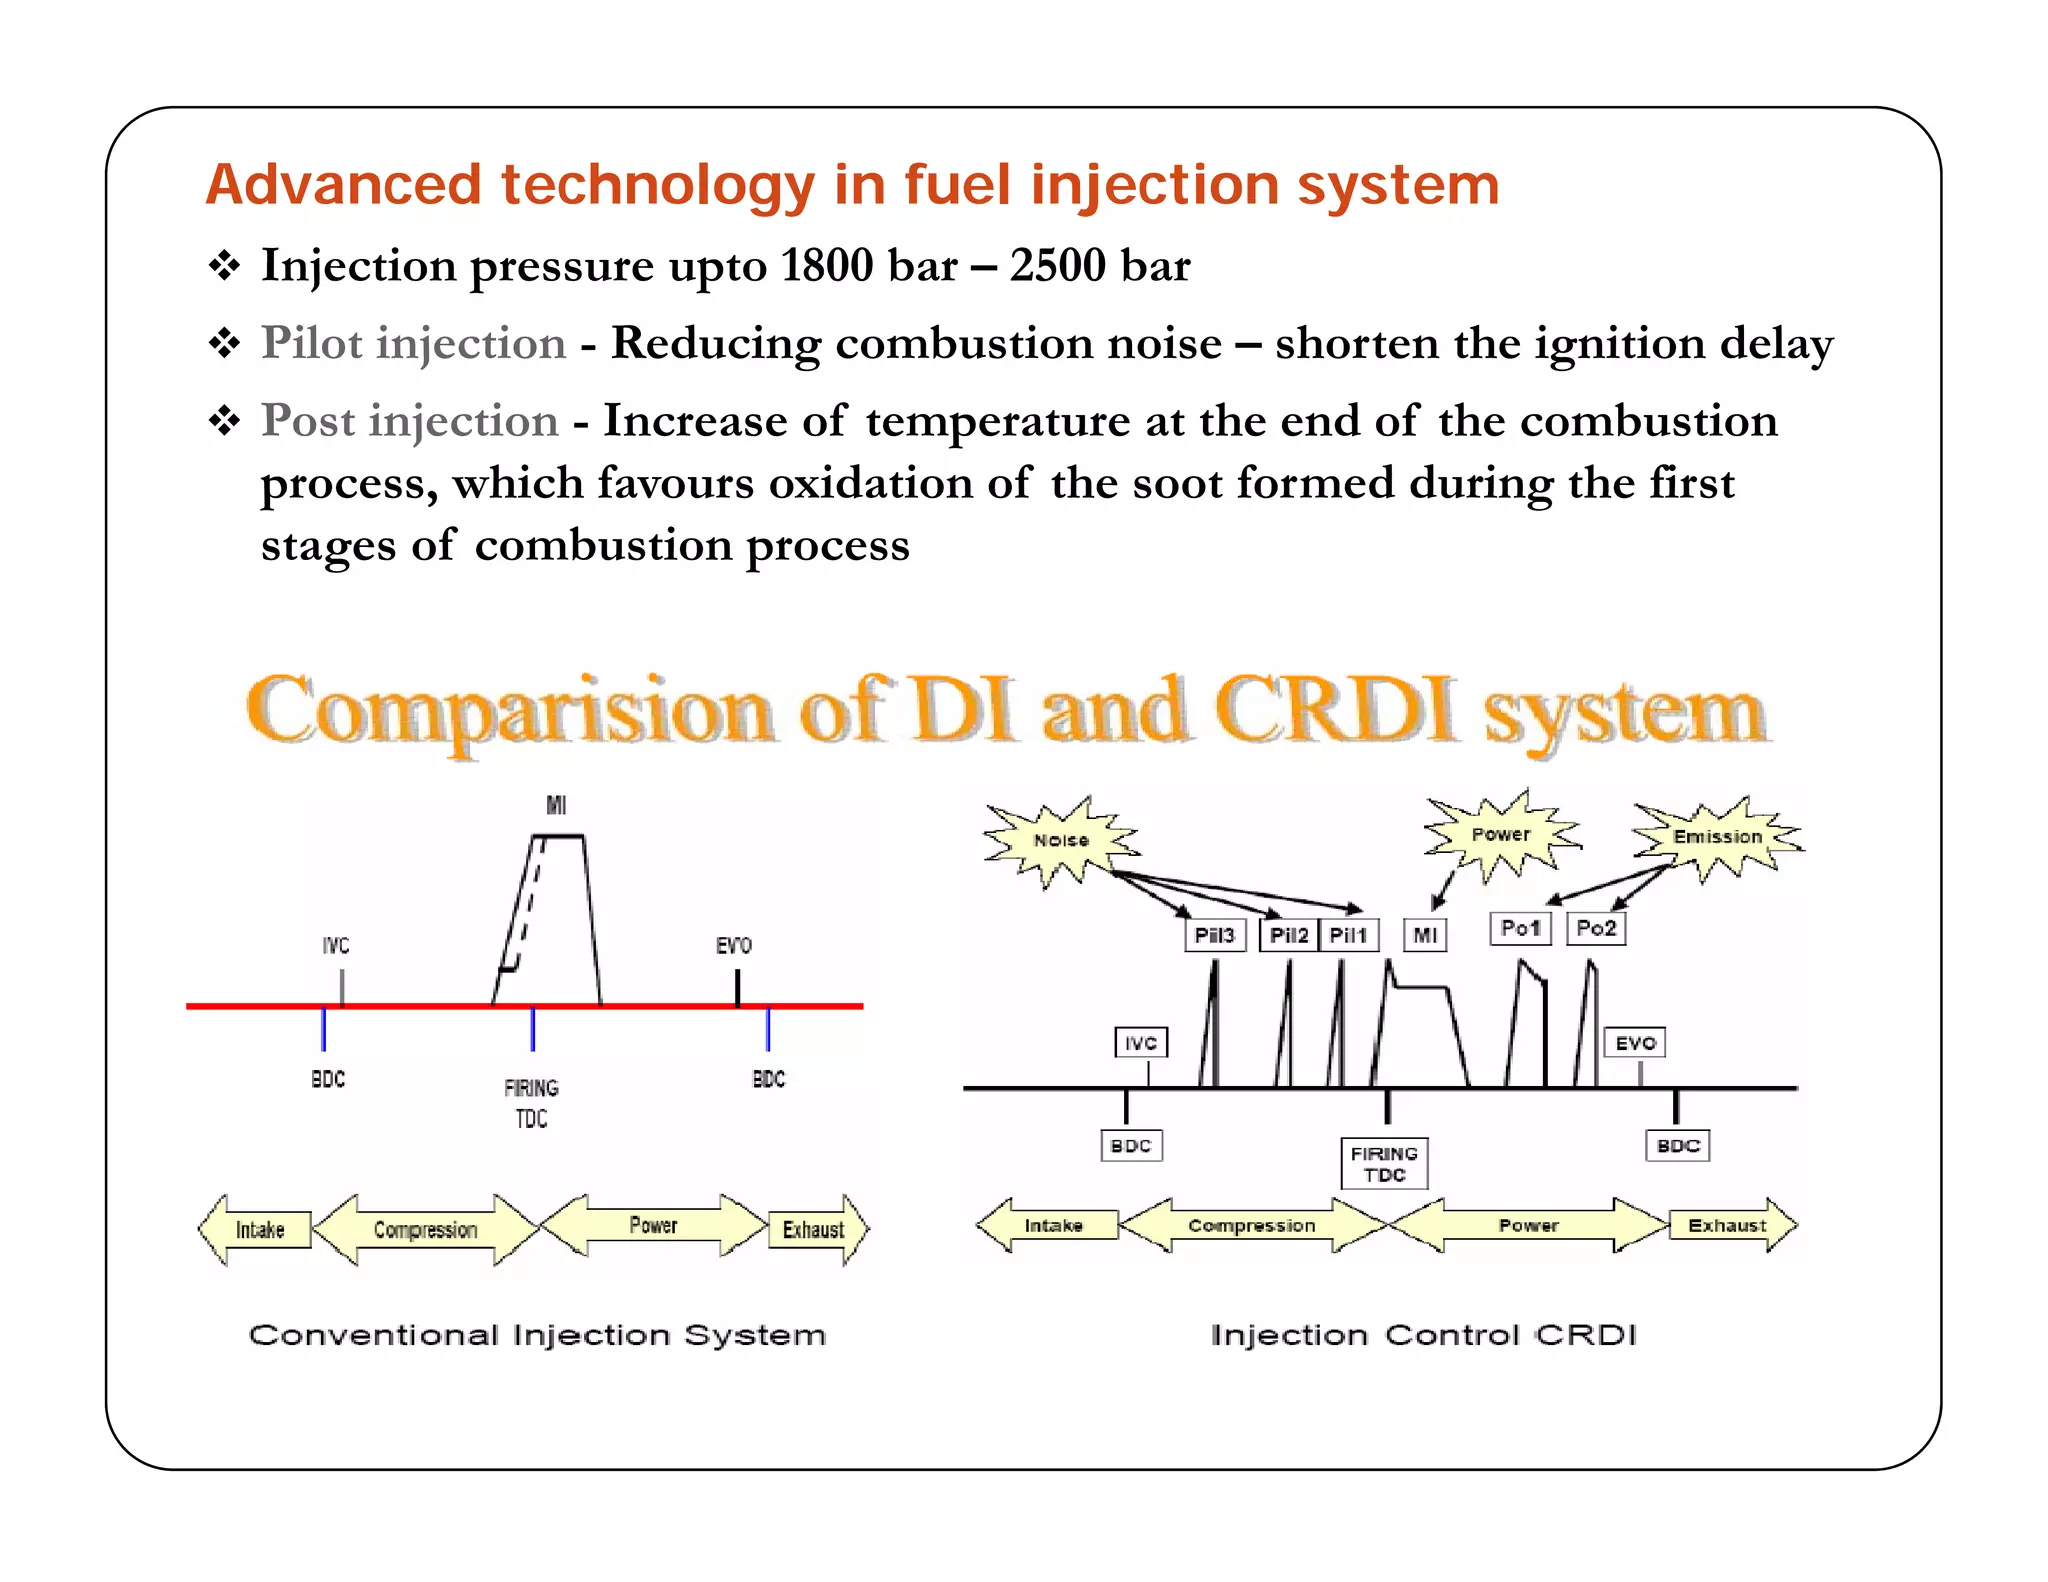
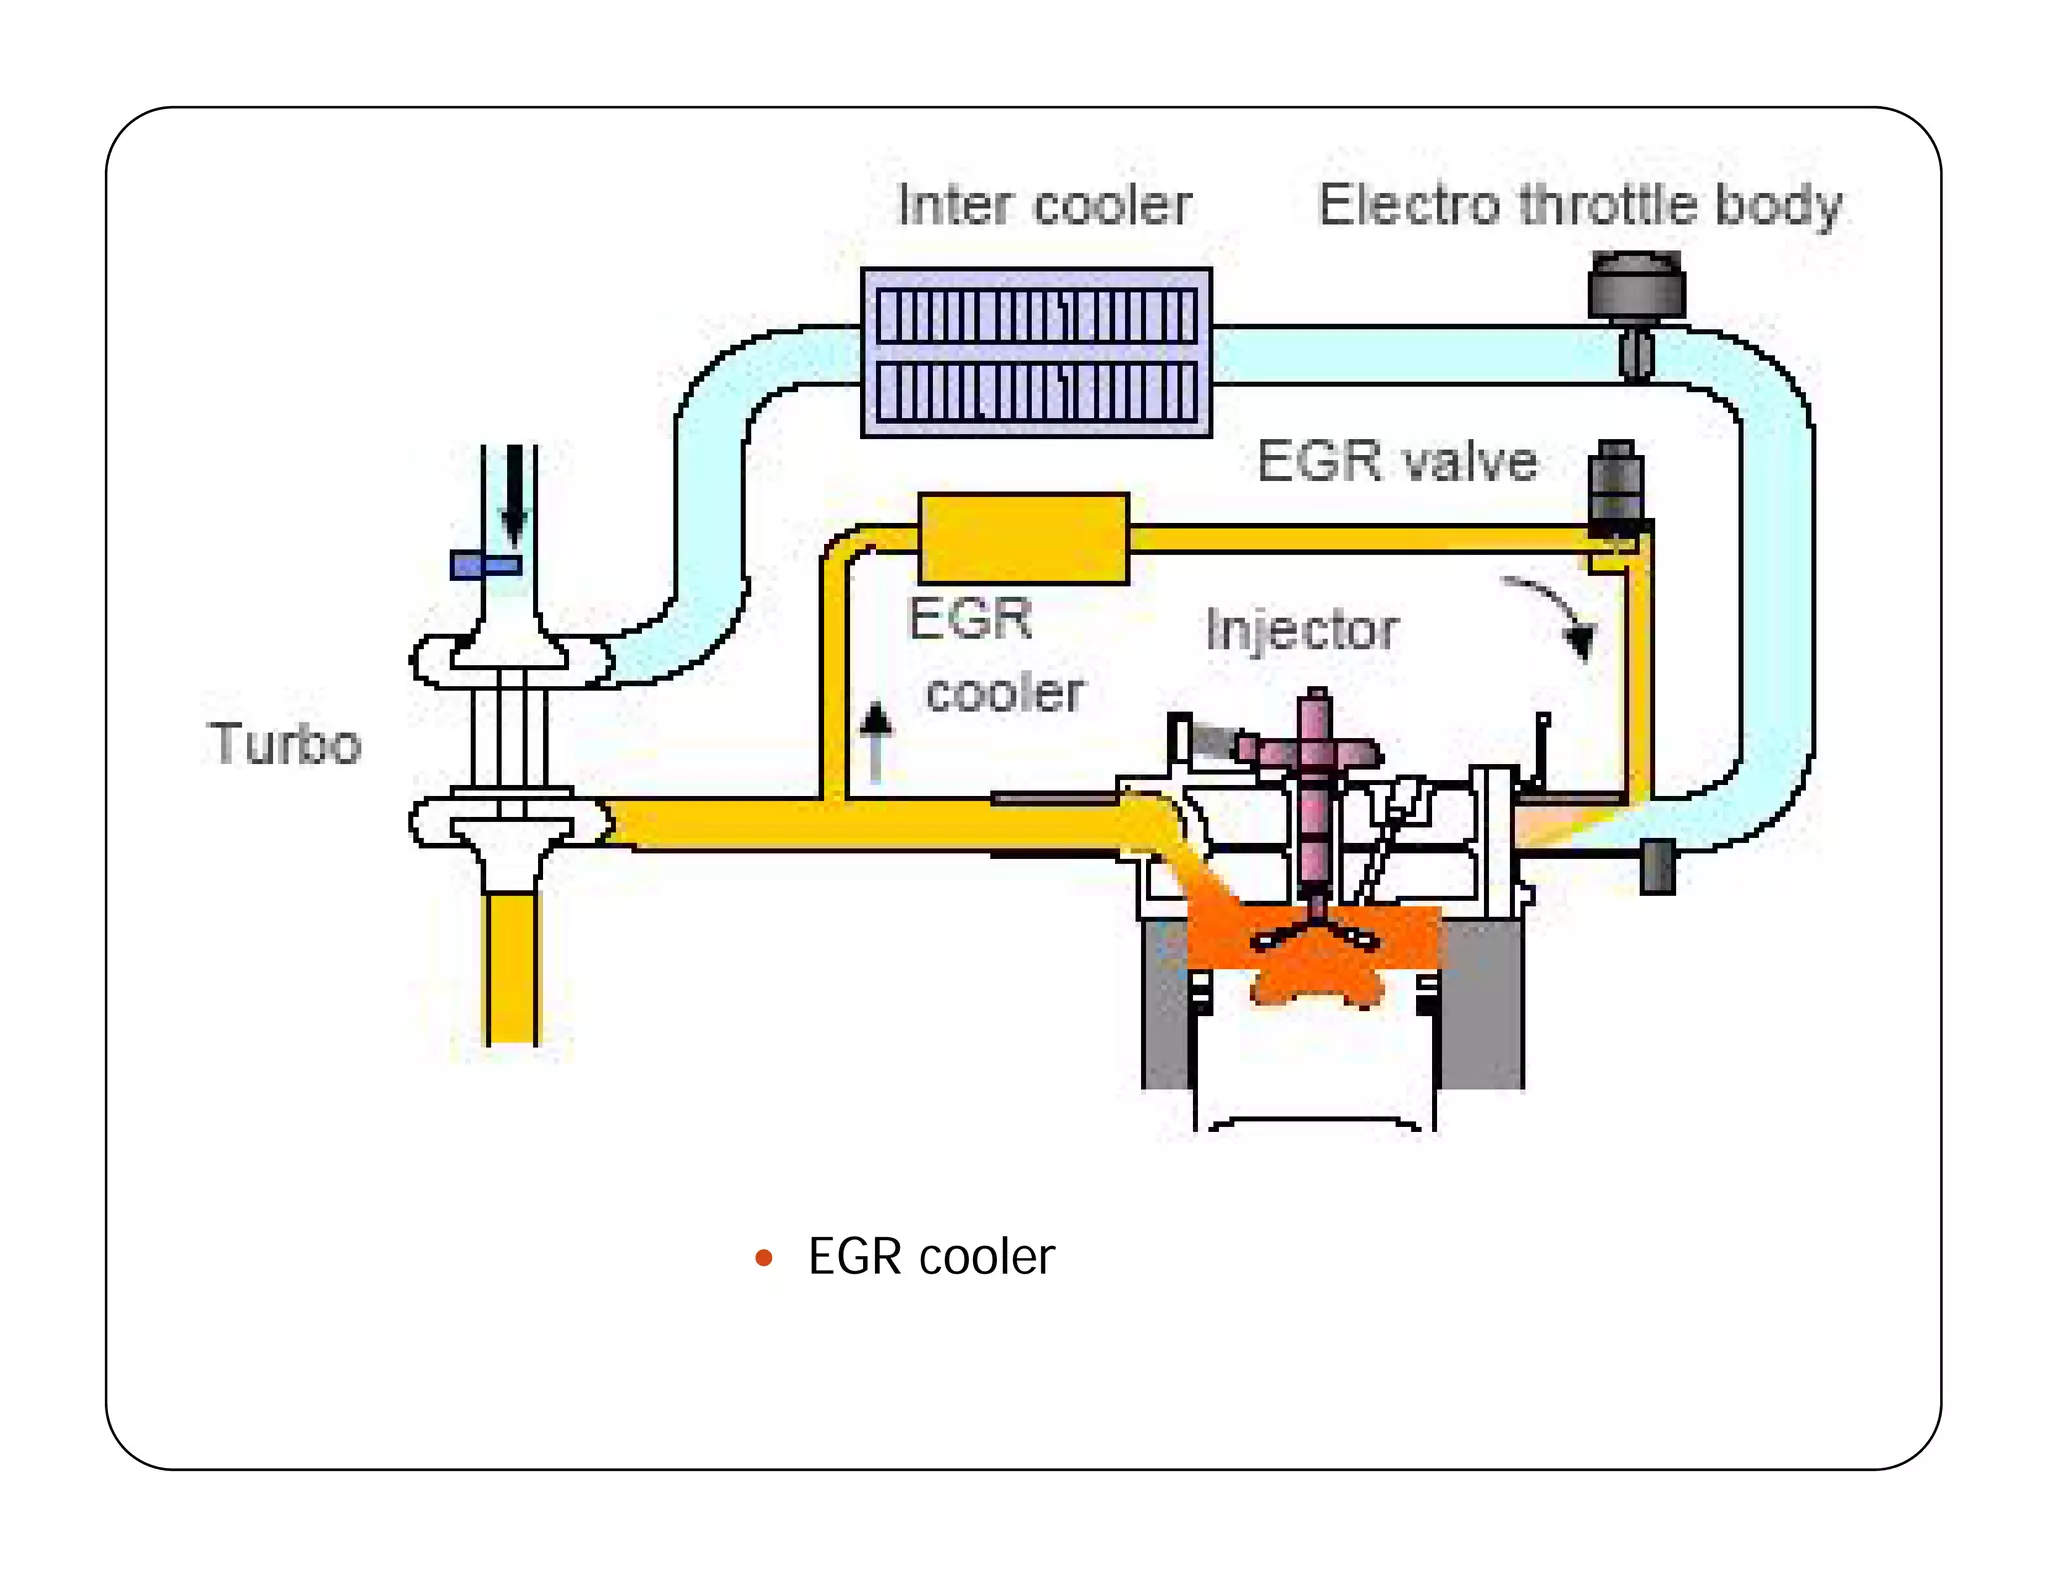
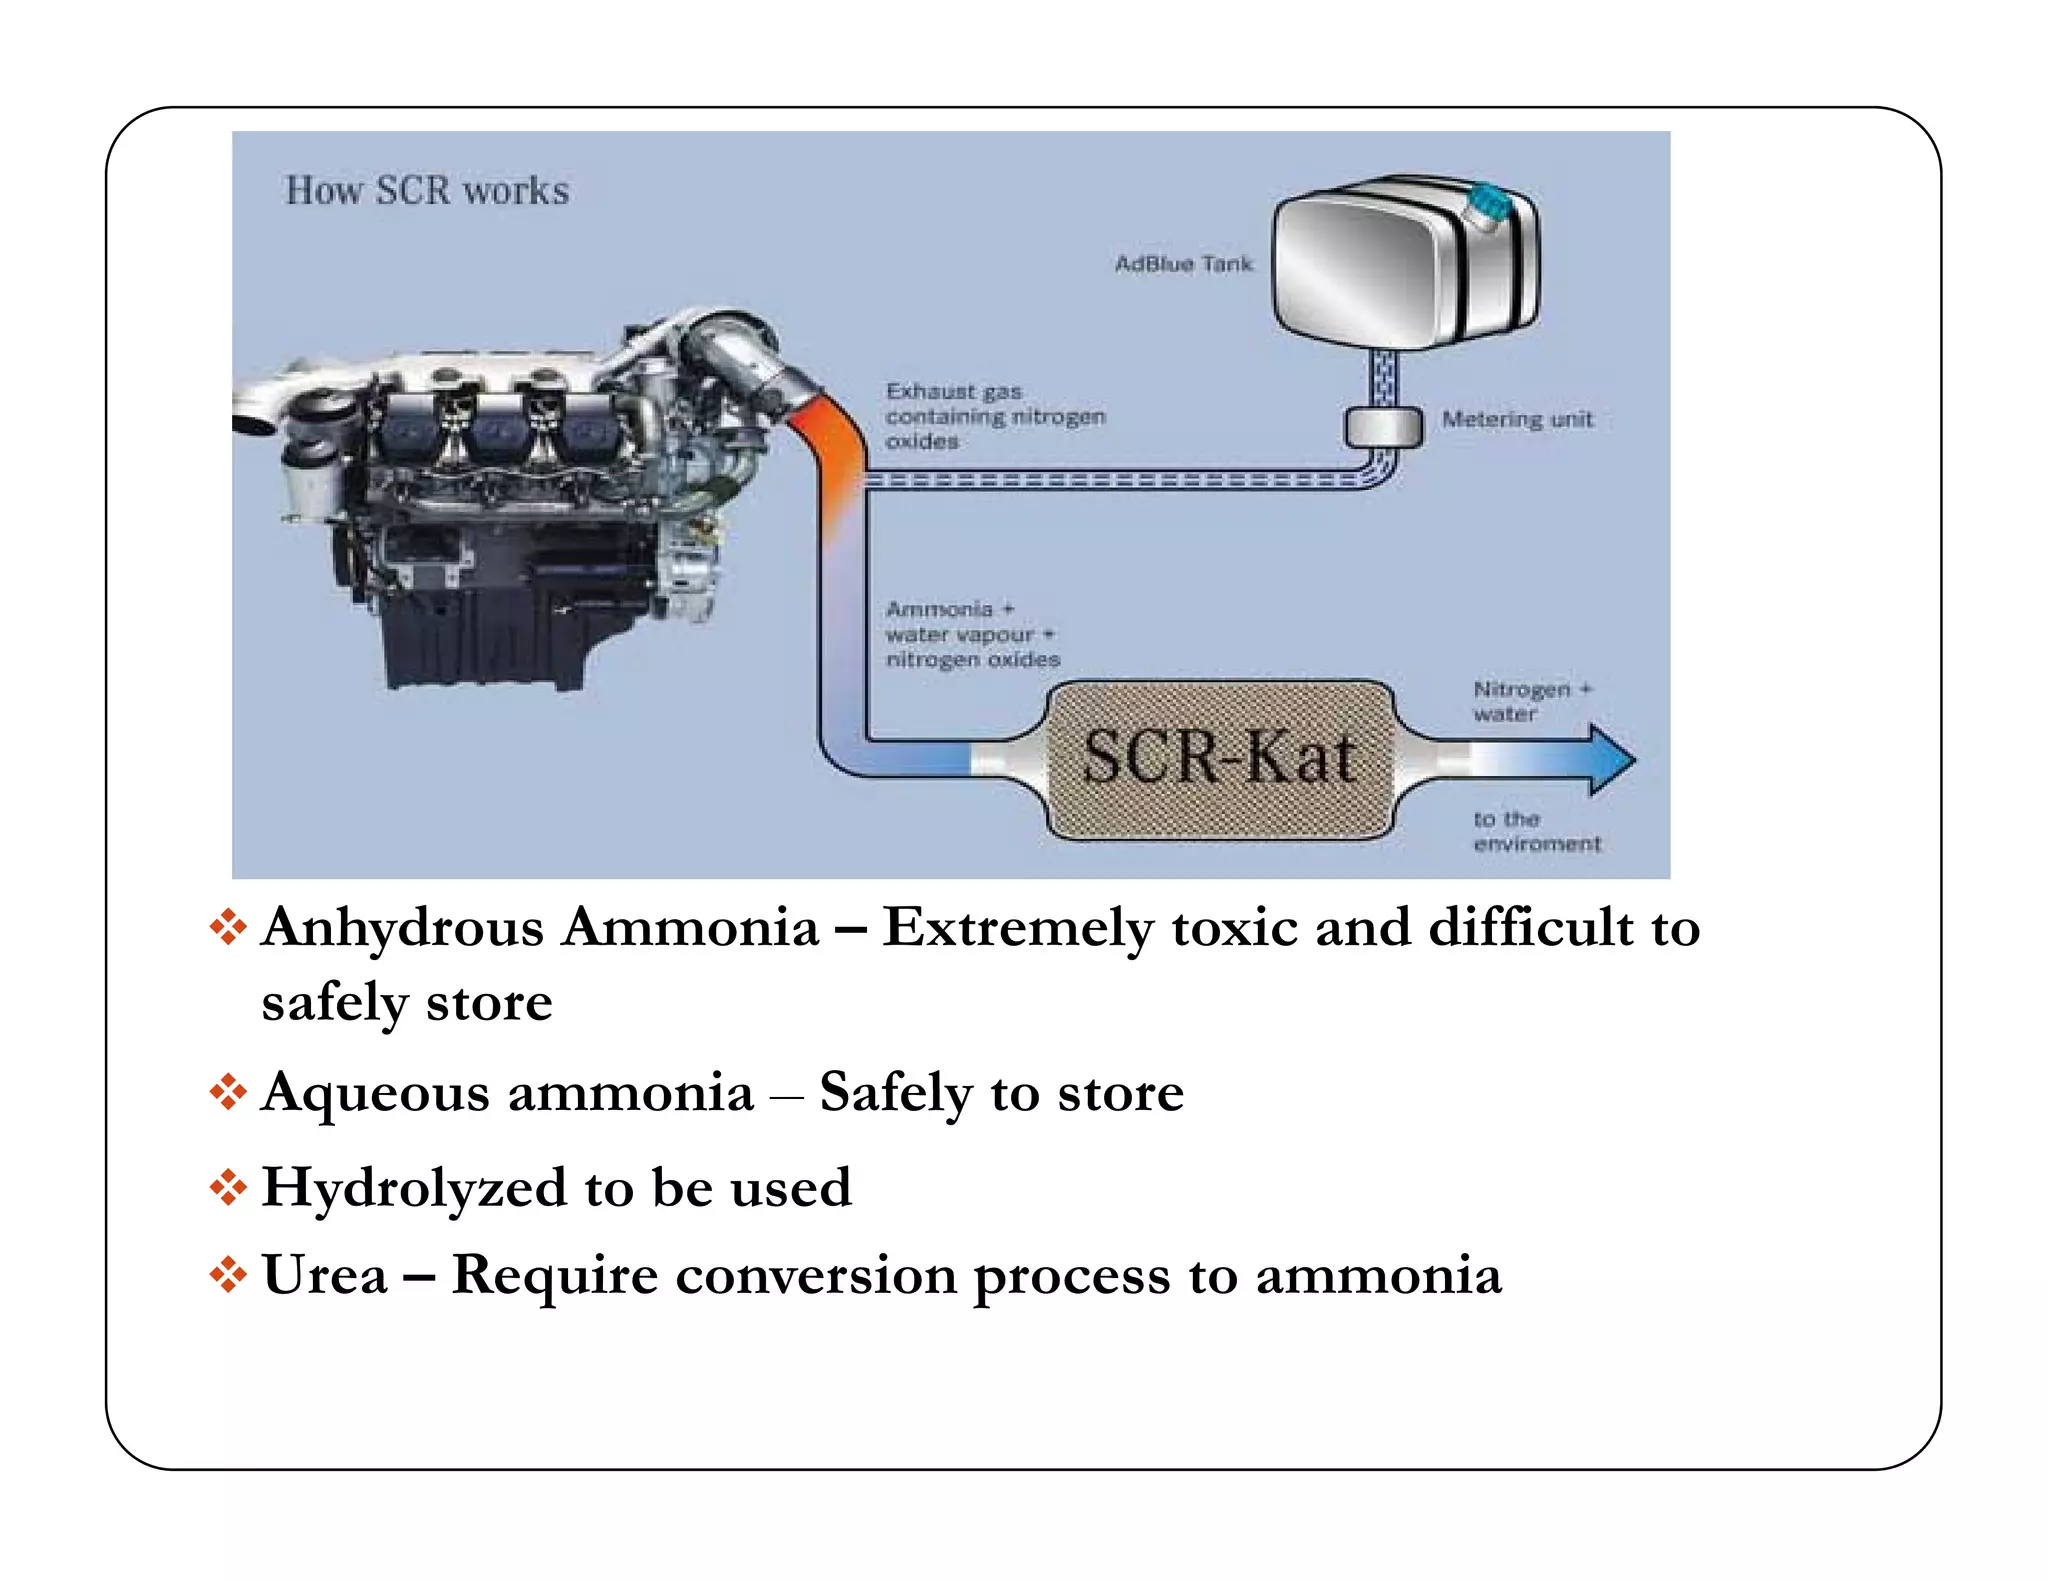
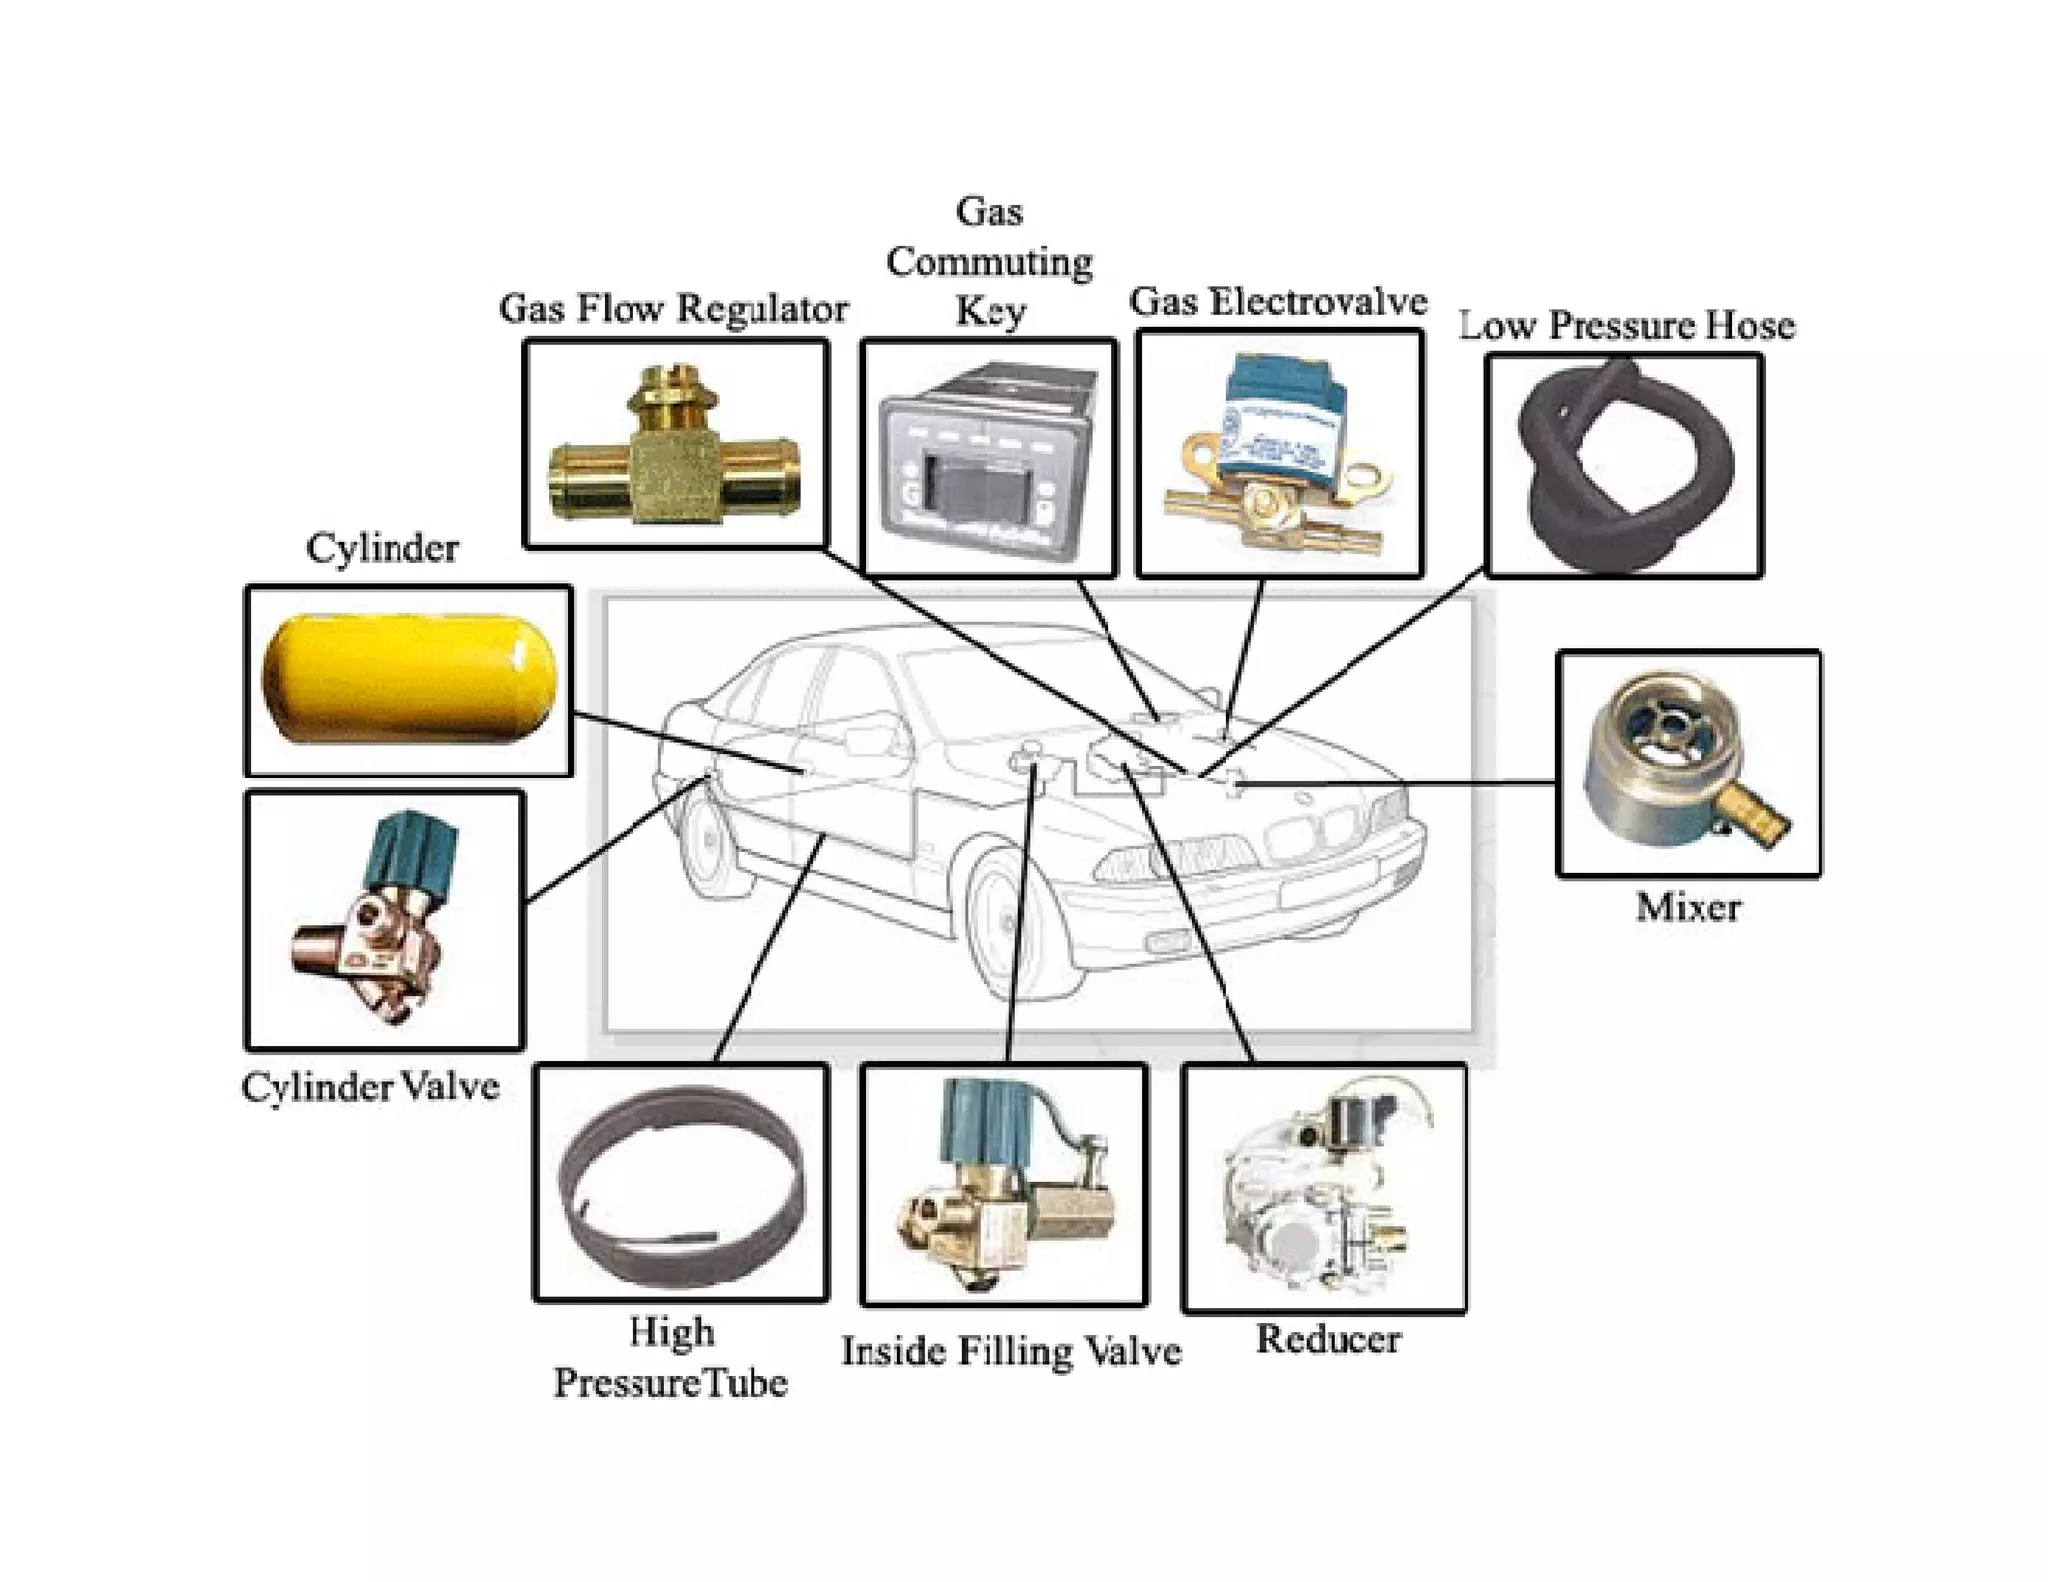
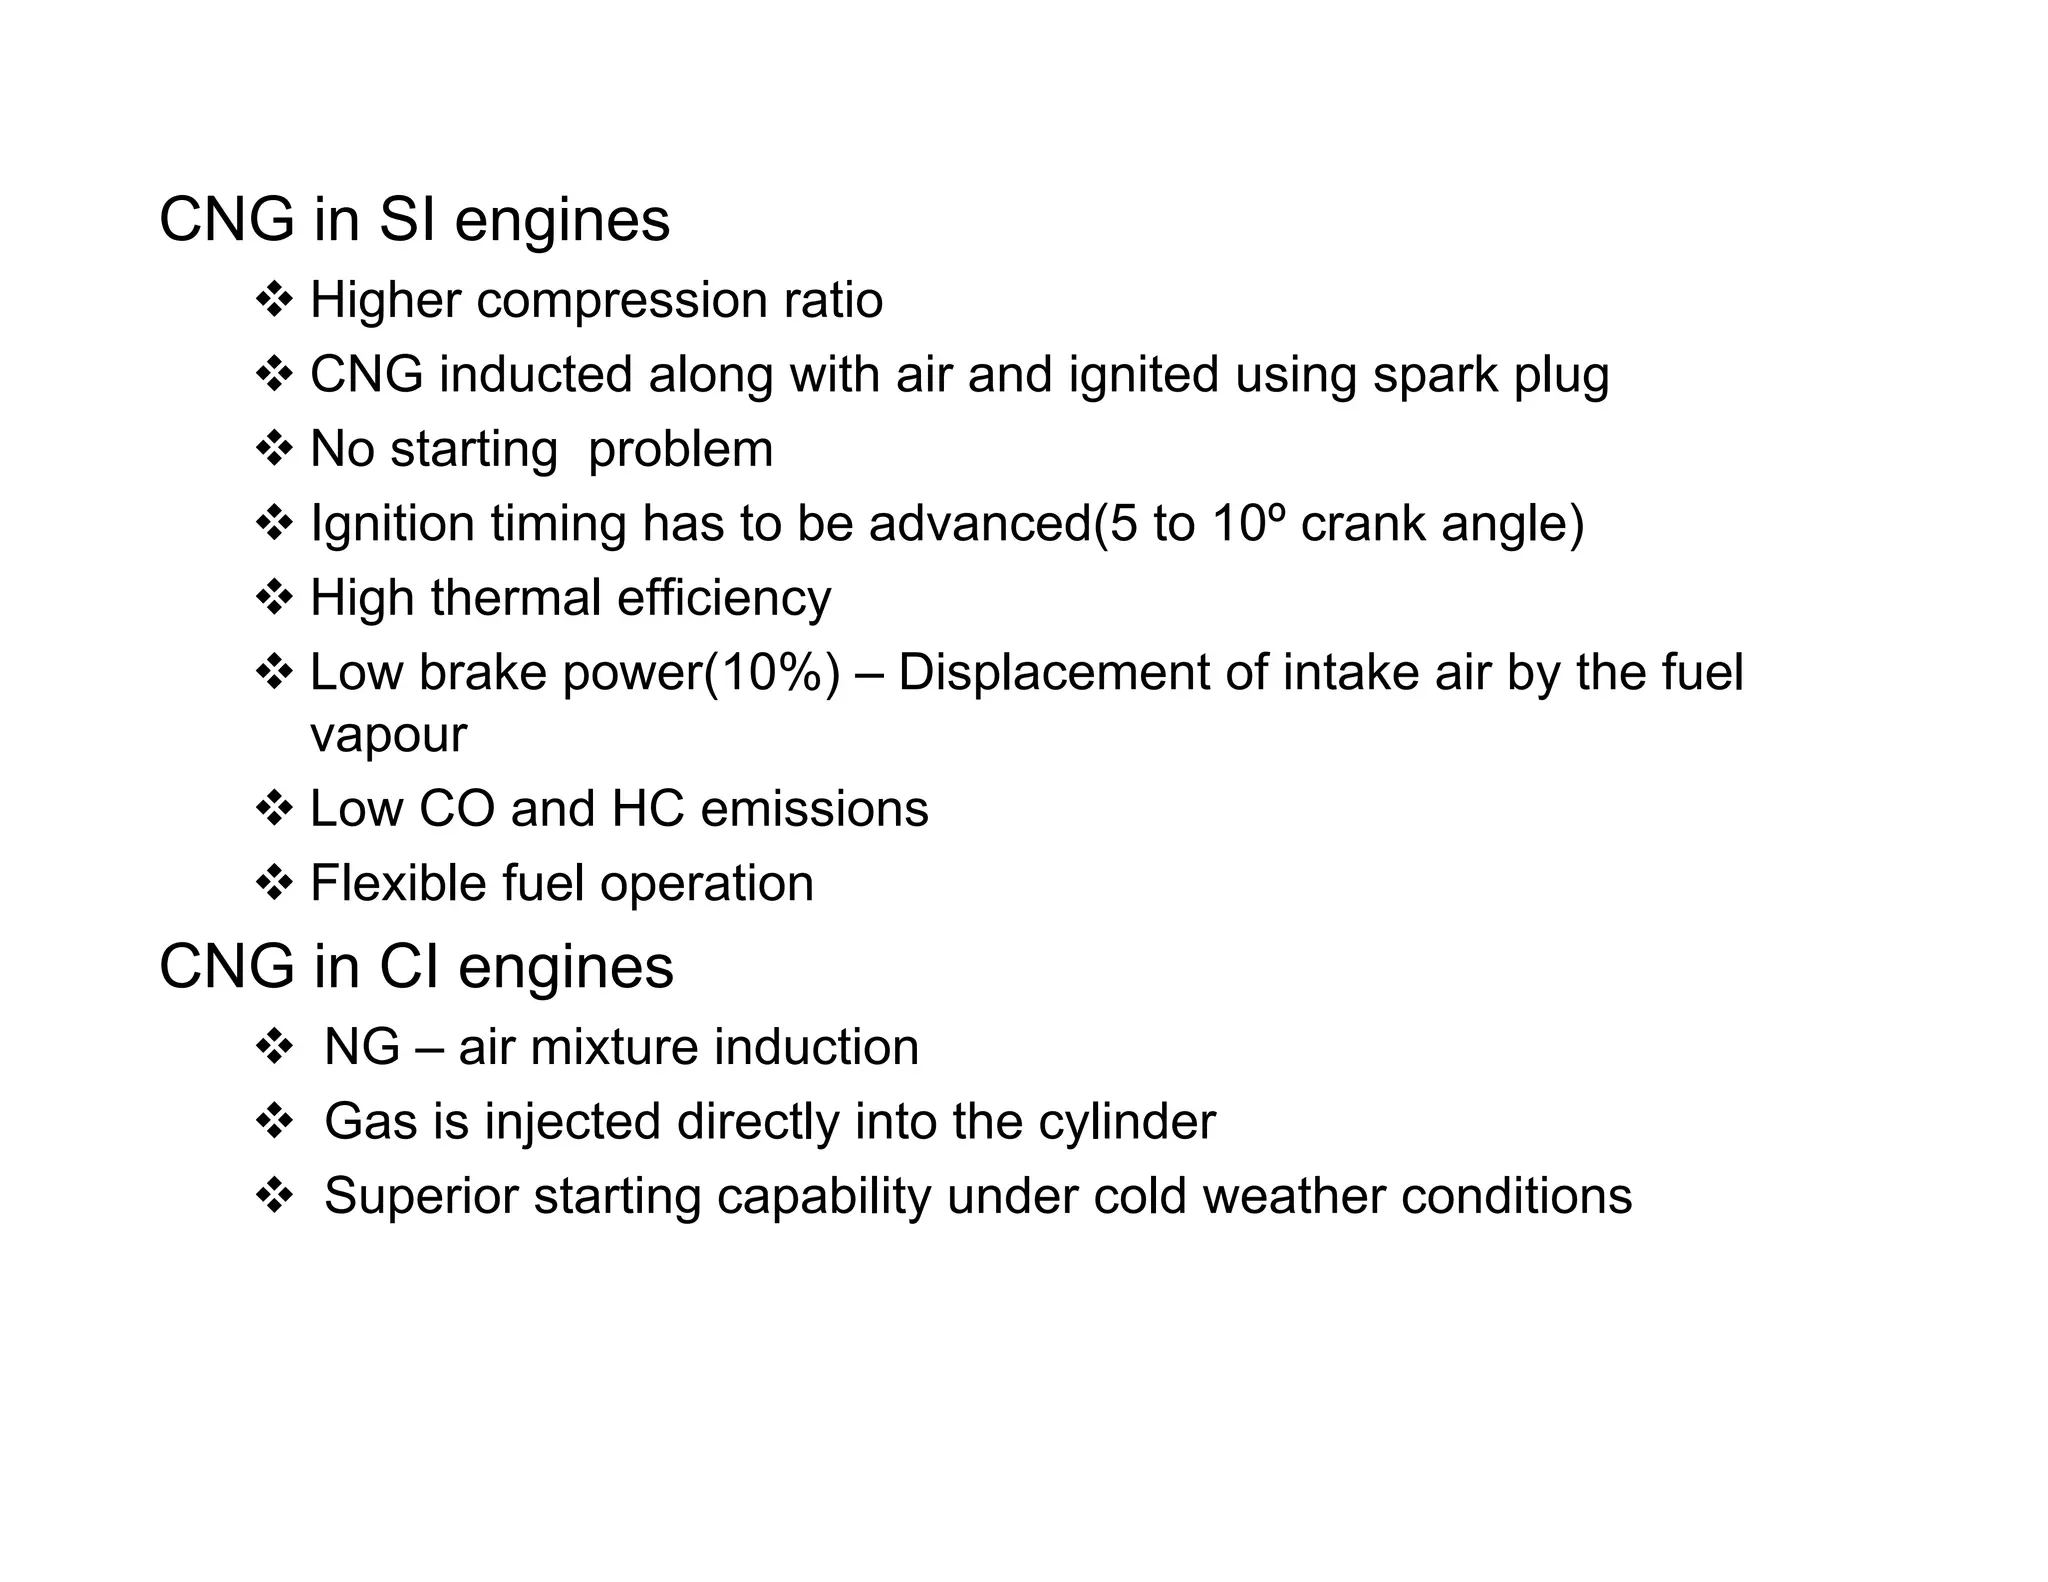
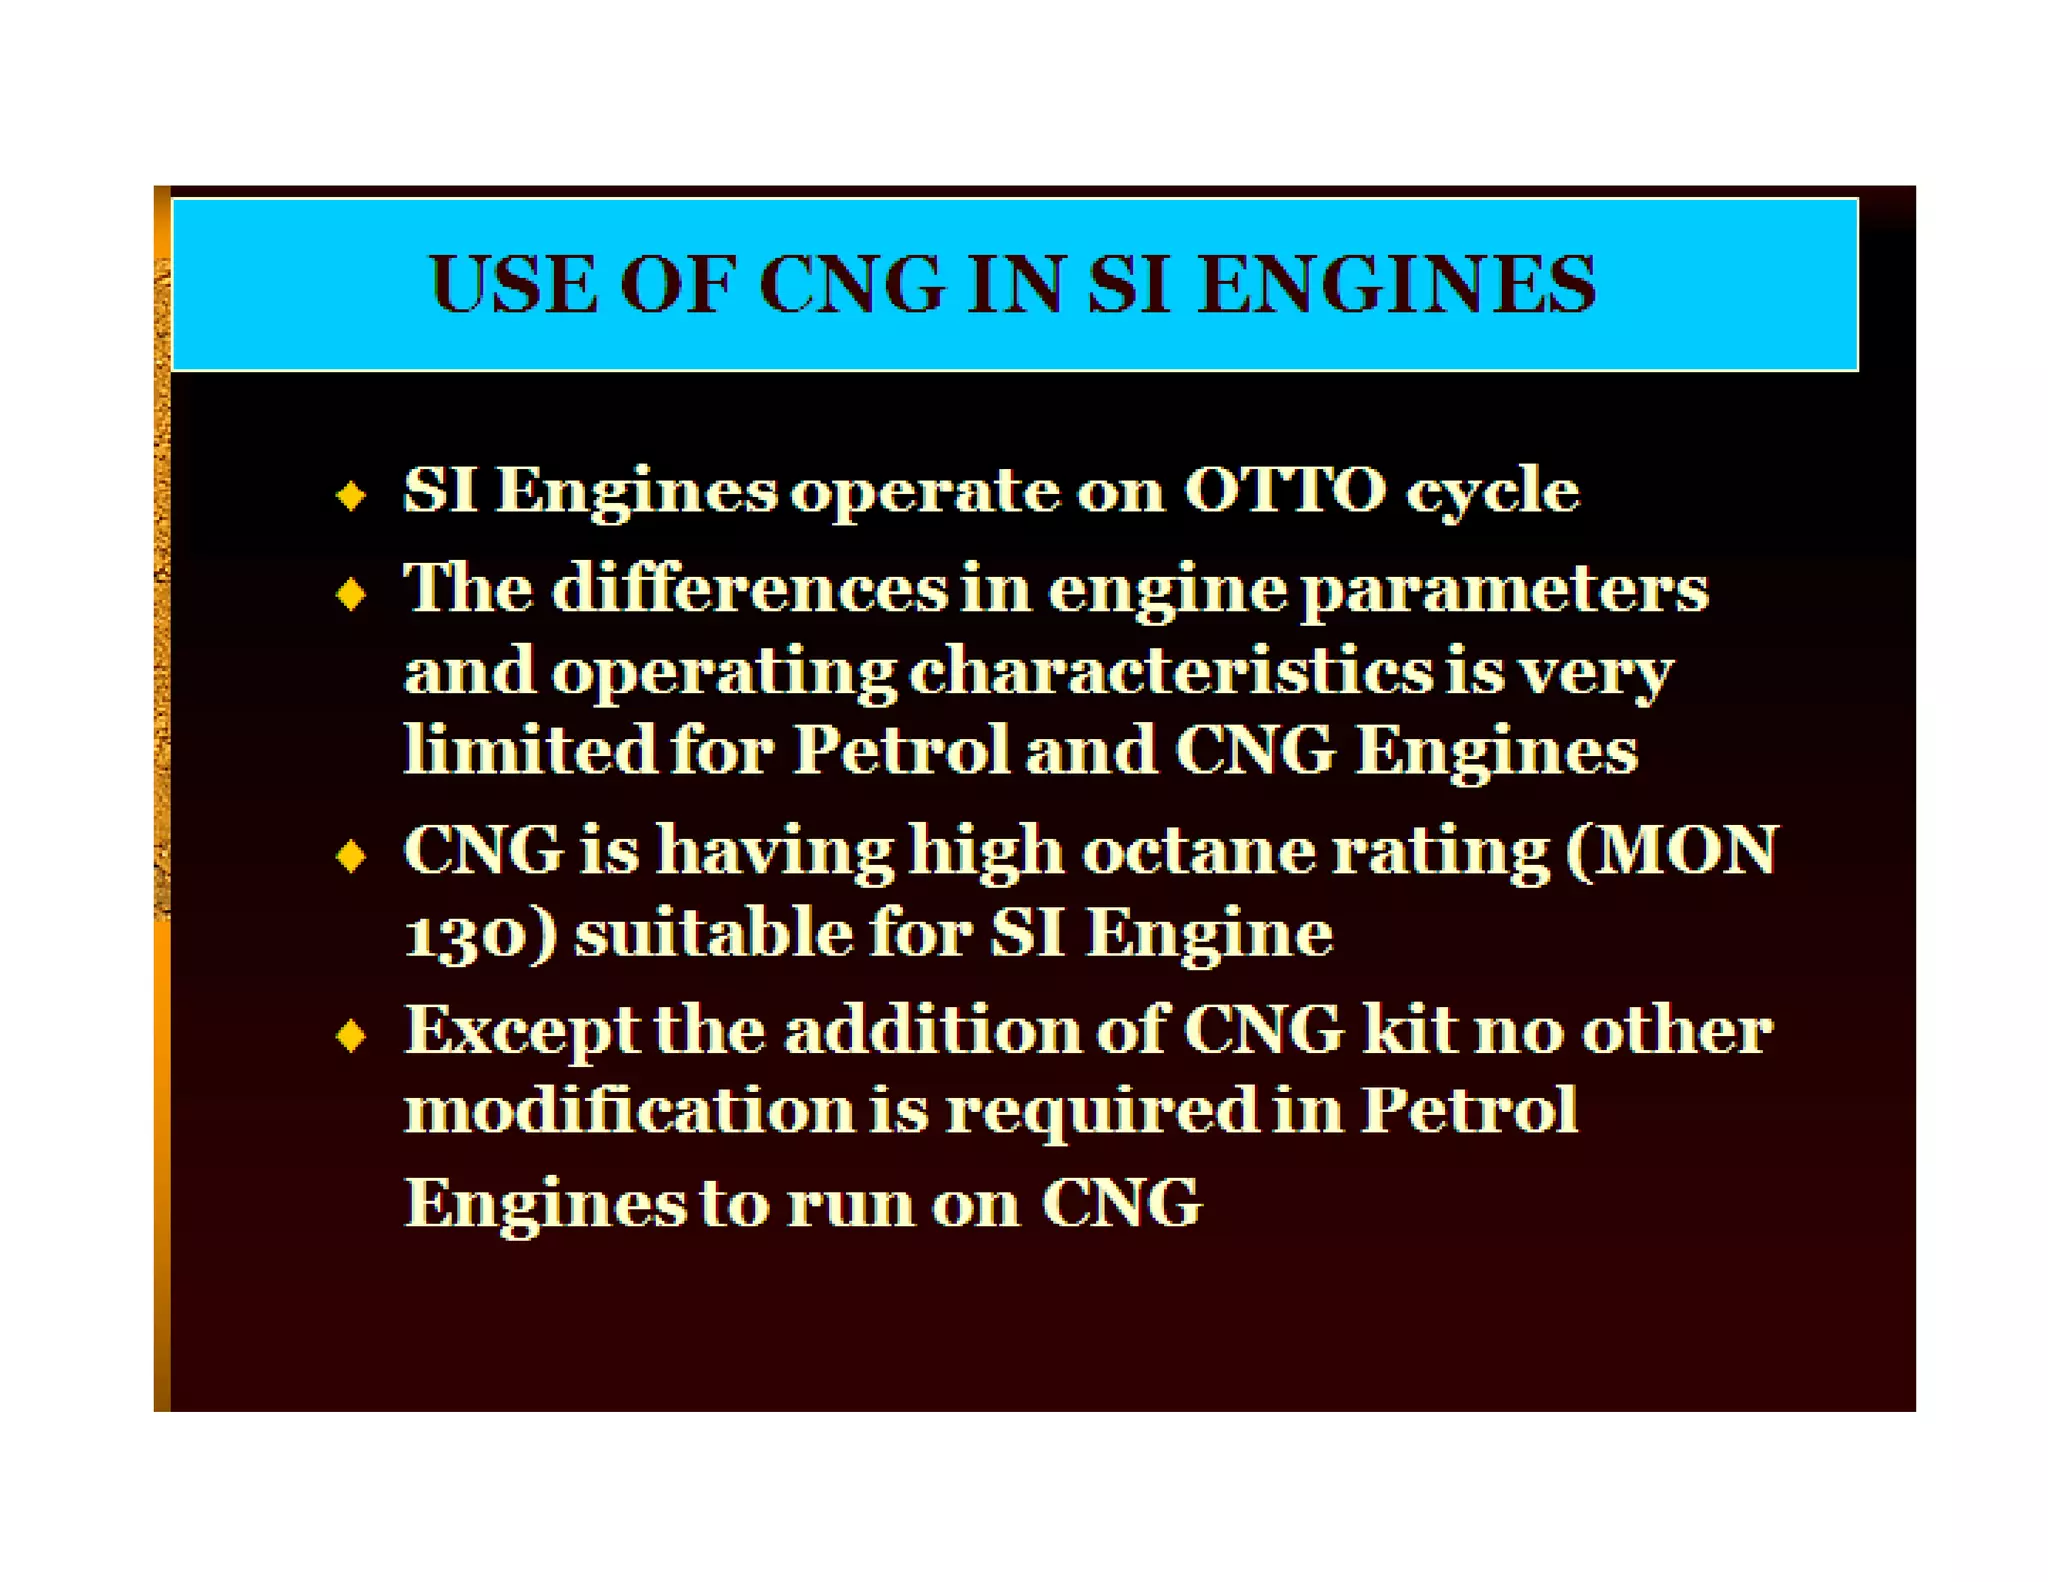
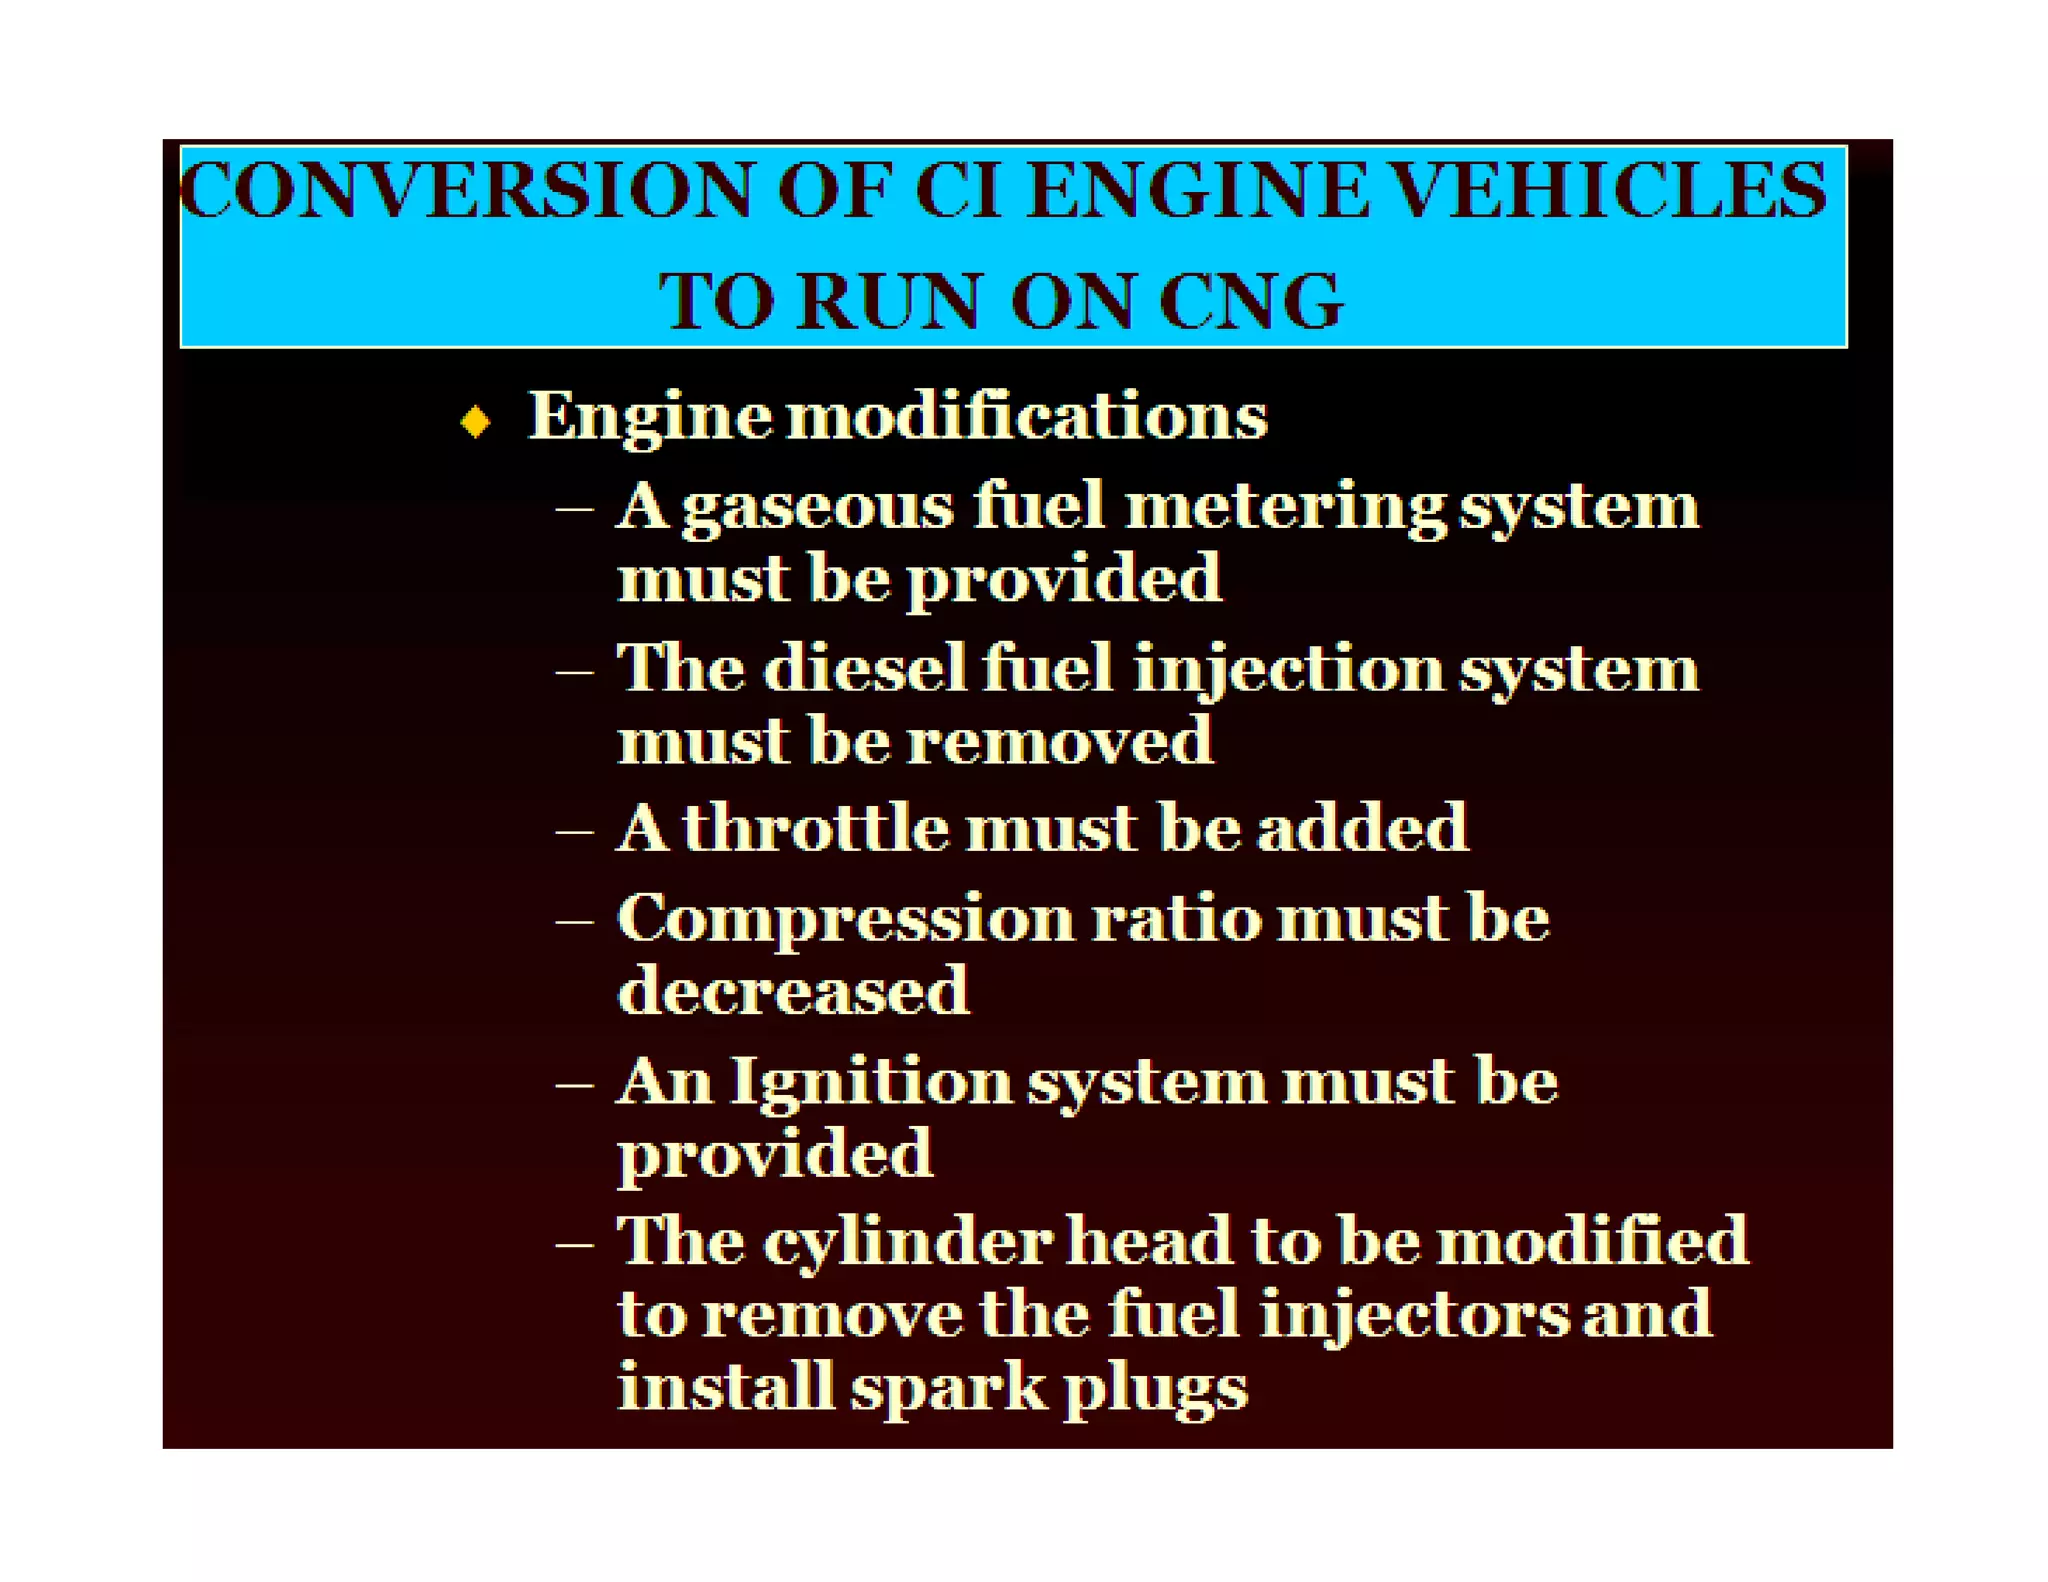
The document discusses engine emissions and their control. It describes the various pollutants emitted from internal combustion engines like hydrocarbons, carbon monoxide, nitrogen oxides, sulfur oxides and particulate matter. It explains the formation mechanisms of different pollutants and the factors affecting their production. The document also covers evaporative, crankcase and non-exhaust emissions from vehicles. It discusses various approaches to control emissions from spark ignition and compression ignition engines like modifying engine design, operating parameters, using emission treatment devices and reformulating fuels.


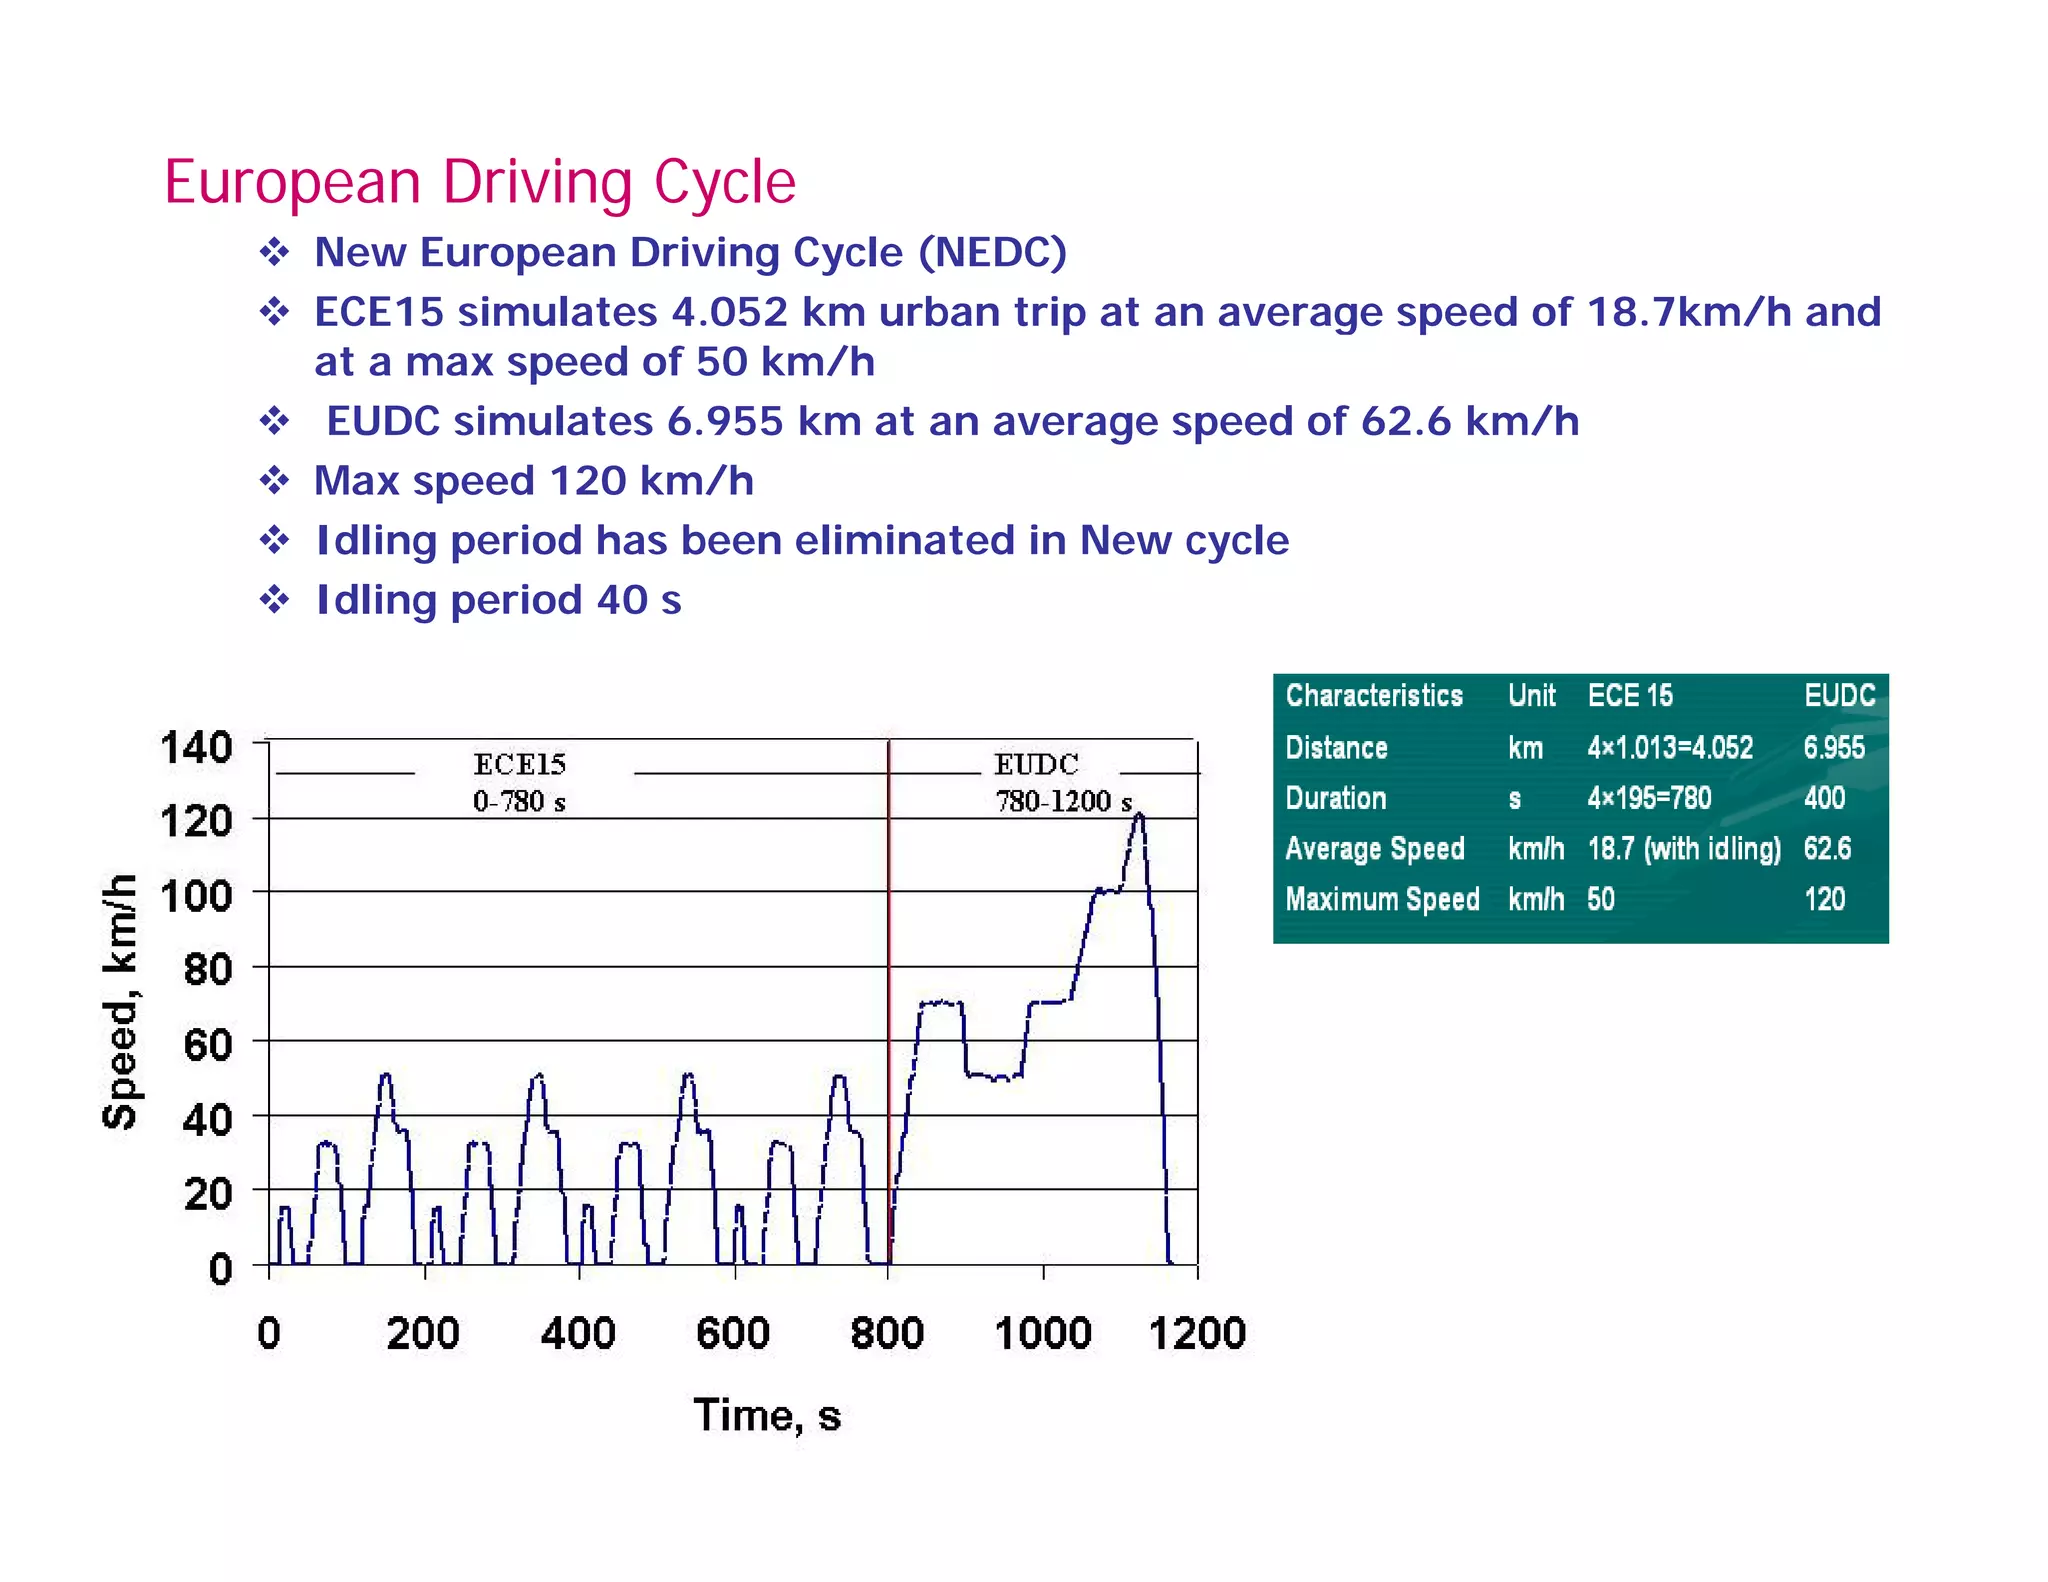
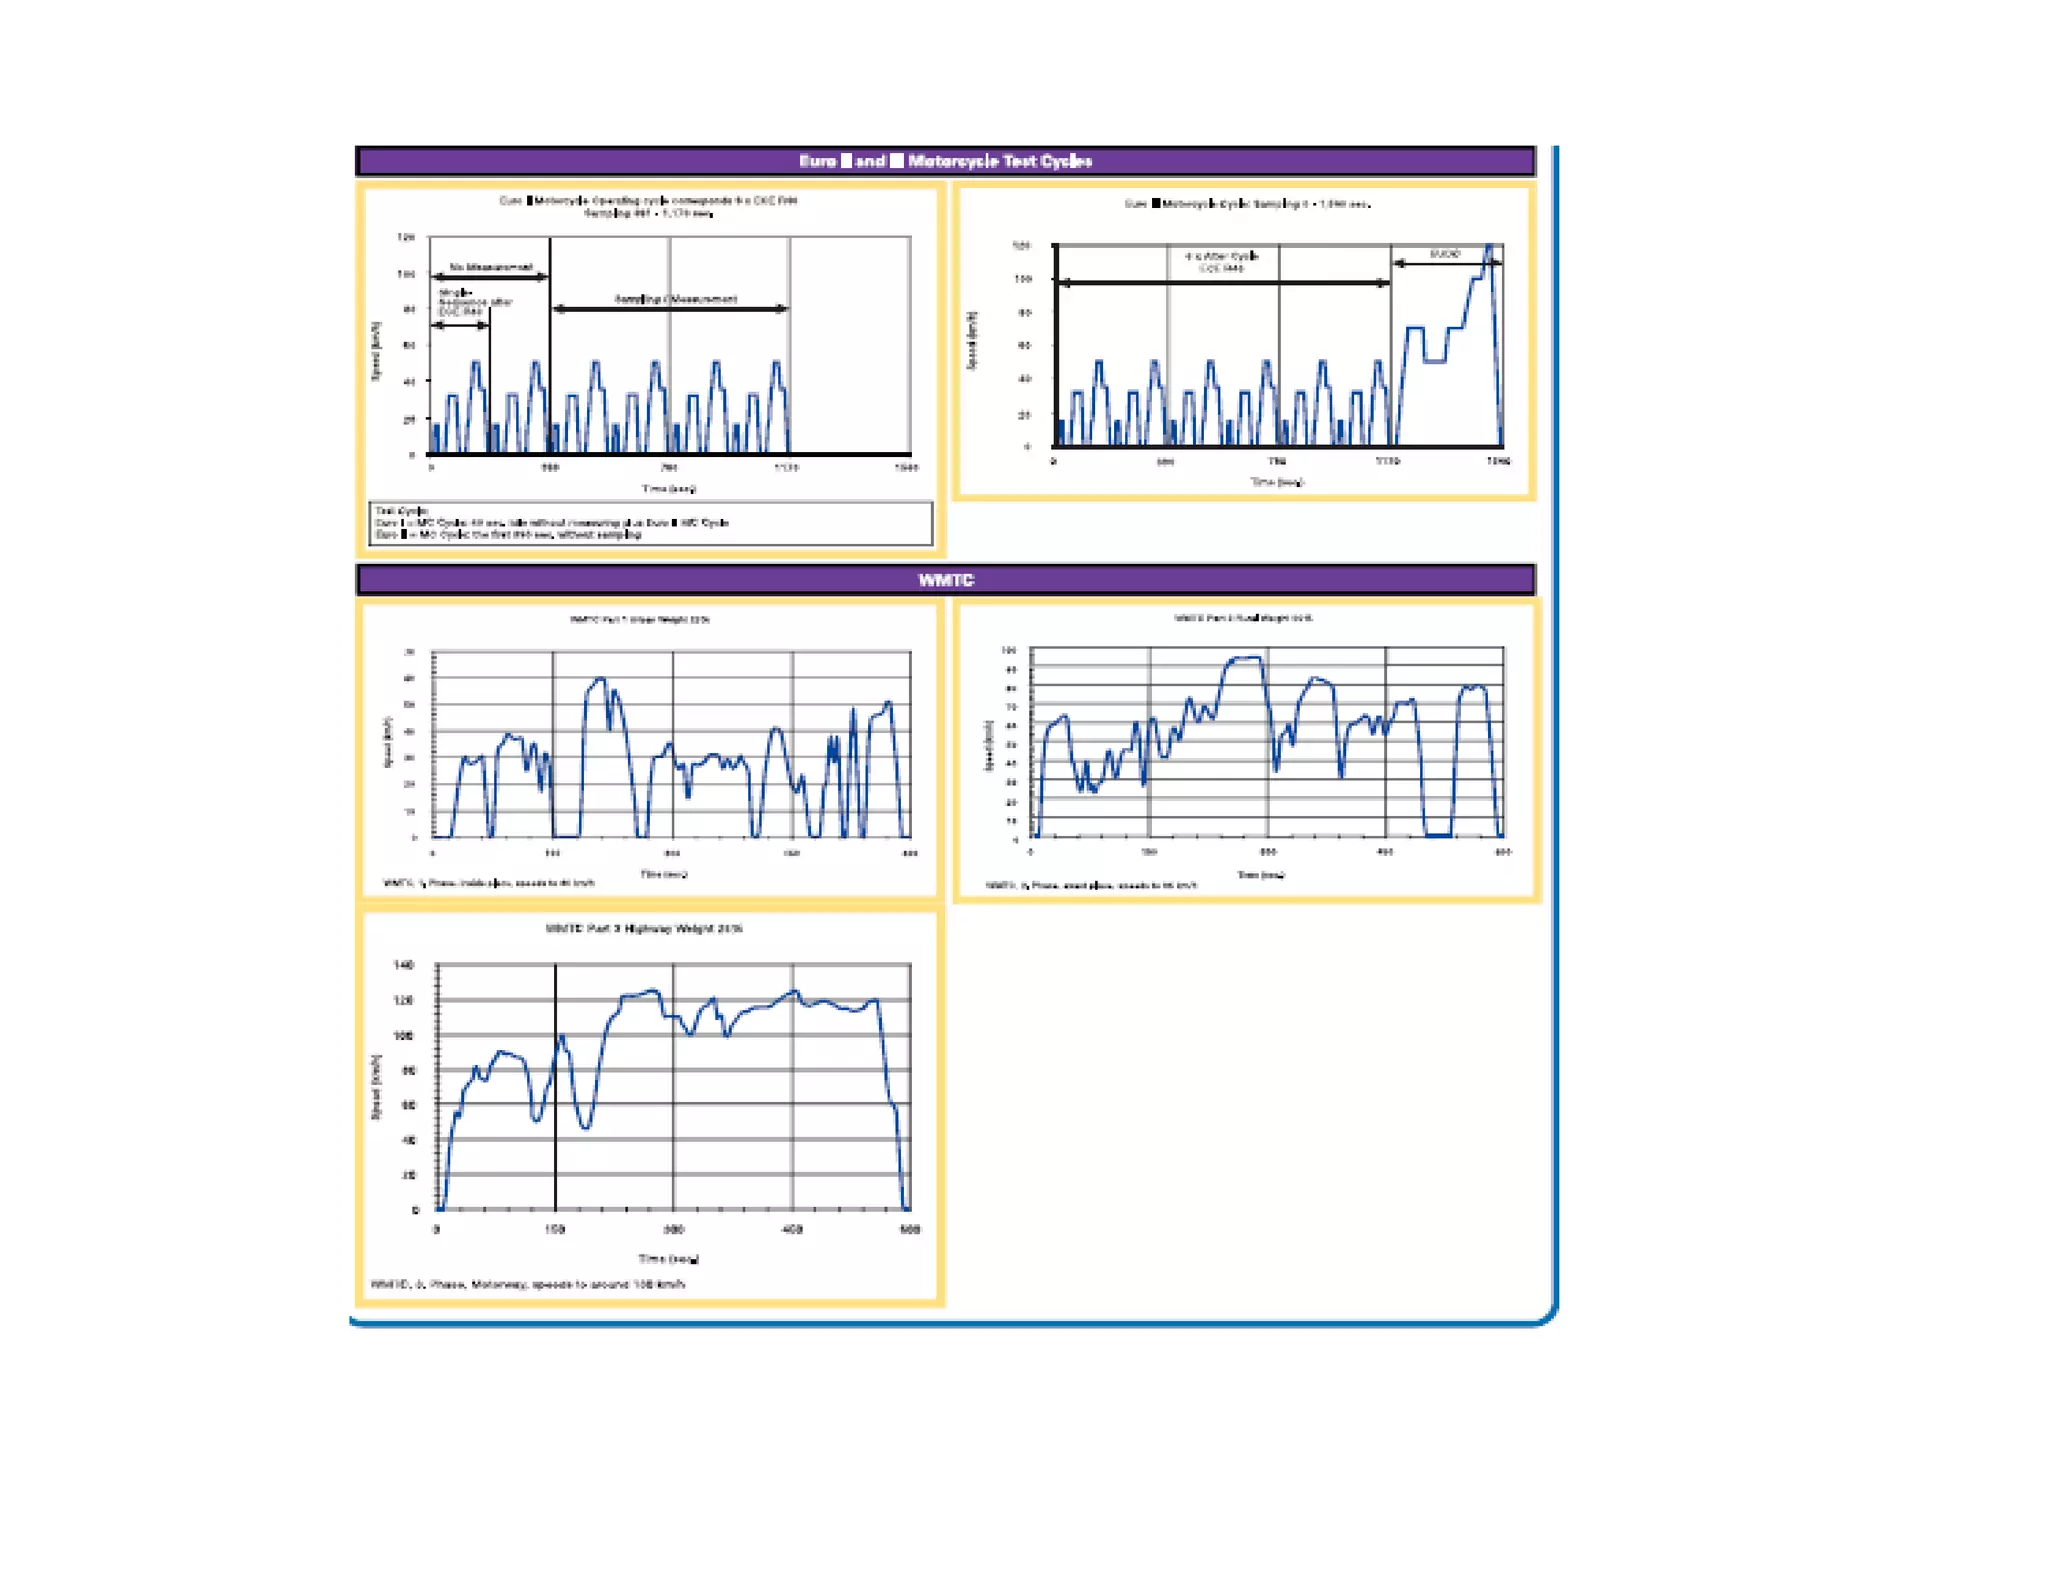
![Typical Driving Cycle
EMISSION CYCLE
130
100
110
120
130
60
70
80
90
EED[KMPH]
30
40
50
60
SPEE
0
10
20
0 100 200 300 400 500 600 700 800 900 1000 1100 1200
SECONDSSECONDS
EURO II BS II](https://image.slidesharecdn.com/engineemissionandtheircontrol-160403142310/75/Engine-emission-and-their-control-74-2048.jpg)


![Fuels Characteristics
Natural Gas Diesel Oil
Carbon content [mass %] 73,3 85,9
Hydrogen content [mass %] 23,9 14,0
Oxygen content [mass %] 0,4 0,05
Carbon-to-hydrogen ratio 0 25 - 0 33 0 16Carbon to hydrogen ratio 0,25 0.33 0,16
Relative molar mass 17 - 20 ~170
Density at 0 oC and 1,013 bar [kg/m3] ~0,83 840
B ili t t [°C / 1 b ] 162 f 170 t 380Boiling temperature [°C / 1 bar] -162 from 170 to 380
Autoignition temperature [°C] 540 - 560 320 – 330
Octane number 120 -130 -
Cetane number - 52 - 56
Methane number 69 - 99 -](https://image.slidesharecdn.com/engineemissionandtheircontrol-160403142310/75/Engine-emission-and-their-control-134-2048.jpg)
![Natural Gas Diesel Oil
• Stoichiometric air/fuel ratio [mass] 17.2 14,5
• Vapour flammability limits [Volume %] 5 - 15 -
• Flammability limits [lambda] 0,7 – 2,1 0,19 - 0,98
• Lower heating/calorific value [MJ/kg] 38 - 50 42,6
• Methane concentration [Volume %] 80 - 99 -
• Ethane concentration [Volume %] 2,7 – 4.6 -
• Nitrogen concentration [Volume %] 0,1 - 15 -
• Carbon dioxide concentration [Volume %] 1 – 5 -
• Sulphur concentration [ppm, mass] < 5 < 50
• Specific CO2 formation [g/MJ] 38 - 50 72](https://image.slidesharecdn.com/engineemissionandtheircontrol-160403142310/75/Engine-emission-and-their-control-135-2048.jpg)


![Dual Fuel Engine Performanceg
CATERPILLAR
C-10 DFNG
ENGINE [9]](https://image.slidesharecdn.com/engineemissionandtheircontrol-160403142310/75/Engine-emission-and-their-control-149-2048.jpg)