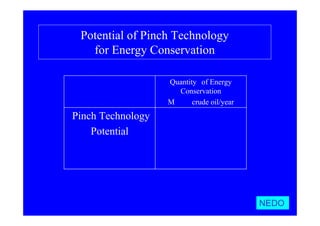
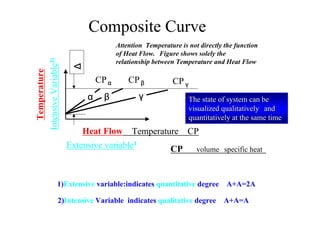
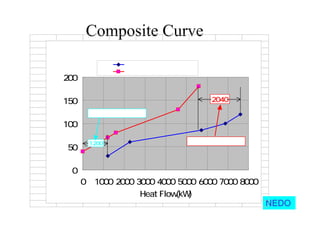
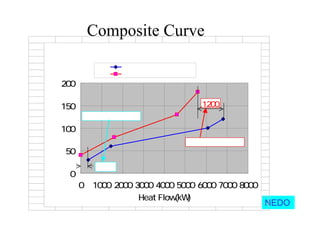
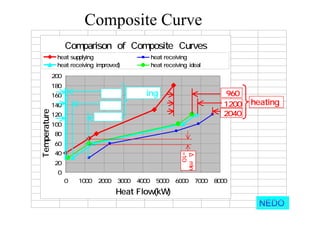
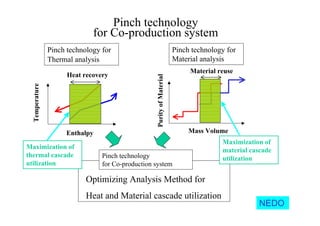
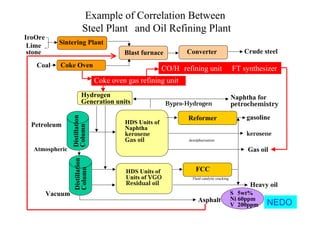
Pinch Technology forPinch Technology for
Energy Conservation ActivitiesEnergy Conservation Activities
19.1.2004
Shigeaki Tonomura
Energy Conservation Technology Development Department
NEDO Technology Development Organization
IEA INTERNATIONAL WORKSHOP
NEDO
2.Programs、Strategic R&D on Energy Conservation
& Business-units subsidy system in NEDO
Fundamental Technology Projects
Practical Application Projects
Promoting Efficient Energy Utilization
in Industry/Housing/ Buildings
Businessstage
R&D steps
Programs 、Strategic R&D on Energy Conservation
& Business -units supporting system
Corroboration Projects
Programs
NEDO
TechnologyTechnology  MapMap
Commercial Improvement of Heat Utilization Air Conditioning,
Heating,Hot-water supply system
/Domestic use Energy conservation of Structure
Energy Conservation of Lightning, other Electrical Equi
New Energy Management technology development
in Domestic Use
Energy Conservation of off-duty equipment
ex. Charger, power adopter
Commercial Energy Control of Lightning, Air Conditioning
/Business use Energy Conservation of main body
Energy conservation of Structure
Energy conservation for Information Technology
On Site Dispersed Power Supply ・Storage of Electricity
Transportation improvement with Conventional Power System
use improvement with Advanced Power System
Introduction of Advanced Motor Fuel and Spread
Improvement of Distribution/ Transportation System
Industrial use Reduction of Fixed Energy of Industrial Region
Improvement of Steam Utilization
Energy conservation of Motor, Power electronics
Improvement of Heating, drying system
Energy conservation of Utilization Process of Cold
Temperature
Utilization of Heat NEDO
Potential of Pinch Technology
for Energy Conservation
500
∼
1000
Pinch Technology
Potential
Quantity of Energy
Conservation
(Mliter・crude oil/year)
Items
NEDO
Conventional Process(example)
Heater 2040KW
Cooler 1200KW
R1 R2H
H
30℃ 120℃
100℃
180℃
72℃
1240KW
800KW
A
86℃
180℃80℃
2000KW
C
condencer
reboiler
60℃ 90℃ 40℃
70℃
130℃
80℃
1200KW
Distillation Column
B
2400KW
130℃
Product2
Product1
in Temp out Temp ΔT UnitVolume Heat Unit
30 85.6 55.56 36 2000
180 80 -100 20 -2000
A
in Temp out Temp ΔT UnitVolume Heat Unit
60 90 30 80 2400
130 70 -60 40 -2400
B
ΔT=50℃ ΔT=10℃
NEDO
Improved Process(example)
Heater 1200KW
Cooler  360W
R1
R2
H
30℃ 120℃
100℃ 180℃ 80℃
1200KW
A
B
49℃
120℃
130℃
85℃ 60℃
3240KW
2000KW
C
condencer
reboiler
72℃ 60℃
130℃
Product1
Product2
360KW
Distillation Column
40℃49℃
60℃
in Temp out Temp ΔT Volume Heat Unit
30 120 90 36 3240
130 49 -81 40 -3240
A
in Temp out Temp ΔT Volume Heat Unit
60 85 25 80 2000
180 80 -100 20 -2000
B
ΔT=19℃ ΔT=20℃
NEDO
Comparison of Processes
Conventional Process
0
20
40
60
80
100
0 20 40 60 80 100 120 140 160 180 200
Tempetature
volume
heat serverA
heat serverB
heat recieverA
heat recieverB
Improved Process
0
20
40
60
80
100
0 20 40 60 80 100 120 140 160 180 200
Tempetature
volume
heat serverA
heat serverB
heat recieverA
heat recieverB
Required
40℃
Required
80℃
Required
40℃
Required
80℃
ΔT=50℃
problem1
problem2
ΔT=10℃
ΔT=19℃
ΔT=20℃
NEDO
Composite Curve (0)
CP=f(volume,specific heat)
Heat Flow
Temperature
IntensiveVariable2)
Extensive variable1)
=Temperature*CP
ΔT CPα
・α
< CPβ
・β
CPγ
・γ
1)Extensive variable:indicates quantitative degree/A+A=2A
2)Intensive Variable:indicates qualitative degree/A+A=A
The state of system can beThe state of system can be
visualized qualitativelyvisualized qualitatively  andand
quantitatively at the same timequantitatively at the same time.
<
Attention;Temperature is not directly the function
of Heat Flow. Figure shows solely the
relationship between Temperature and Heat Flow
Composing the Curves
H
T
180° -
130° -
80° -
40° -
CP
=
40
CP
=20
1
2
H
T
180° -
130° -
80° -
40° -
C
P
=
40
CP
=
20
1
2
CP = 60
only
only
1 2and
NEDO
Composite Curve(1)
NEDO
Conventional Process
0
50
100
150
200
0 1000 2000 3000 4000 5000 6000 7000 8000
Heat Flow(kW)
Temperature
heat recieveing curve
heat supplying curve
2040
1200
extra cooling
extra heating
Composite Curve(2)
NEDO
Improved Process
0
50
100
150
200
0 1000 2000 3000 4000 5000 6000 7000 8000
Heat Flow(kW)
Temperature
heat recieveing curve
heat supplying curve
1200
360
extra heating
extra cooling
Composite Curve(3)
NEDO
Comparison of Composite Curves
0
20
40
60
80
100
120
140
160
180
200
0 1000 2000 3000 4000 5000 6000 7000 8000
Heat Flow(kW)
Temperature(℃)
heat supplying heat receiving(conventional)
heat receiving(improved) heat receiving(ideal)
360 1200
 960
ΔTmin
=10℃
2040
heating
1200
120 cooling
Pinch technology
for Co-production system
Pinch technology for
Thermal analysis
Pinch technology for
Material analysis
Heat recovery
Enthalpy
Temperature
Material reuse
Mass Volume
PurityofMaterial
Optimizing Analysis Method for
Heat and Material cascade utilization
Pinch technology
for Co-production system
Maximization of
material cascade
utilization
Maximization of
thermal cascade
utilization
NEDO
cost analysis of gasification process
0
20,000
40,000
60,000
80,000
100,000
conventional pinch,thermal
& material
seperately
co-pro pinch
cost($/day) energy & Material cost co-pro operation cost
Analysis Example of
Co-production System
NEDO
-
18%
-
26%
Example of Correlation Between
Steel Plant and Oil Refining Plant
NEDO
Coke oven gas refining unit
CO/H2 refining unit  FT synthesizer
Crude steel
IroOre
Lime
stone Blast furnace Converter
Coal
Sintering Plant
Coke Oven
Naphtha for
petrochemistry
gasoline
kerosene
Gas oil
Heavy oil
FCC
Reformer
HDS Units of
Naphtha,
kerosene,
Gas oil
Hydrogen
Generation units
Petroleum
Distillation
Column
Atmospheric
Vacuum
Distillation
Column
HDS Units of
Units of VGO,
Residual oil
Asphalt
S 5wt%
Ni 60ppm
V 200ppm
Bypro-Hydrogen
Fluid catalytic cracking
Hydrogen desulphurization
ConclusionConclusion
1.1.Pinch Technology visualizes waste heatPinch Technology visualizes waste heat
panoramicallypanoramically,,qualitatively and quantitativelyqualitatively and quantitatively..
2.. Potential of Pinch technologyPotential of Pinch technology  for Energy Conservationfor Energy Conservation
is notis not  less than 500less than 500∼1000∼1000MM・・LiterLiter・・crude oil/yearcrude oil/year..
3.3. Moreover Pinch technology for Co-productionMoreover Pinch technology for Co-production
system may enlarge the Energy Conservation effectsystem may enlarge the Energy Conservation effect..
NEDO

Energy conversation

  • 1.
    Pinch Technology forPinchTechnology for Energy Conservation ActivitiesEnergy Conservation Activities 19.1.2004 Shigeaki Tonomura Energy Conservation Technology Development Department NEDO Technology Development Organization IEA INTERNATIONAL WORKSHOP NEDO
  • 2.
    2.Programs、Strategic R&D onEnergy Conservation & Business-units subsidy system in NEDO Fundamental Technology Projects Practical Application Projects Promoting Efficient Energy Utilization in Industry/Housing/ Buildings Businessstage R&D steps Programs 、Strategic R&D on Energy Conservation & Business -units supporting system Corroboration Projects Programs NEDO
  • 3.
    TechnologyTechnology  MapMap Commercial Improvement ofHeat Utilization Air Conditioning, Heating,Hot-water supply system /Domestic use Energy conservation of Structure Energy Conservation of Lightning, other Electrical Equi New Energy Management technology development in Domestic Use Energy Conservation of off-duty equipment ex. Charger, power adopter Commercial Energy Control of Lightning, Air Conditioning /Business use Energy Conservation of main body Energy conservation of Structure Energy conservation for Information Technology On Site Dispersed Power Supply ・Storage of Electricity Transportation improvement with Conventional Power System use improvement with Advanced Power System Introduction of Advanced Motor Fuel and Spread Improvement of Distribution/ Transportation System Industrial use Reduction of Fixed Energy of Industrial Region Improvement of Steam Utilization Energy conservation of Motor, Power electronics Improvement of Heating, drying system Energy conservation of Utilization Process of Cold Temperature Utilization of Heat NEDO
  • 4.
    Potential of PinchTechnology for Energy Conservation 500 ∼ 1000 Pinch Technology Potential Quantity of Energy Conservation (Mliter・crude oil/year) Items NEDO
  • 5.
    Conventional Process(example) Heater 2040KW Cooler 1200KW R1R2H H 30℃ 120℃ 100℃ 180℃ 72℃ 1240KW 800KW A 86℃ 180℃80℃ 2000KW C condencer reboiler 60℃ 90℃ 40℃ 70℃ 130℃ 80℃ 1200KW Distillation Column B 2400KW 130℃ Product2 Product1 in Temp out Temp ΔT UnitVolume Heat Unit 30 85.6 55.56 36 2000 180 80 -100 20 -2000 A in Temp out Temp ΔT UnitVolume Heat Unit 60 90 30 80 2400 130 70 -60 40 -2400 B ΔT=50℃ ΔT=10℃ NEDO
  • 6.
    Improved Process(example) Heater 1200KW Cooler  360W R1 R2 H 30℃120℃ 100℃ 180℃ 80℃ 1200KW A B 49℃ 120℃ 130℃ 85℃ 60℃ 3240KW 2000KW C condencer reboiler 72℃ 60℃ 130℃ Product1 Product2 360KW Distillation Column 40℃49℃ 60℃ in Temp out Temp ΔT Volume Heat Unit 30 120 90 36 3240 130 49 -81 40 -3240 A in Temp out Temp ΔT Volume Heat Unit 60 85 25 80 2000 180 80 -100 20 -2000 B ΔT=19℃ ΔT=20℃ NEDO
  • 7.
    Comparison of Processes Conventional Process 0 20 40 60 80 100 020 40 60 80 100 120 140 160 180 200 Tempetature volume heat serverA heat serverB heat recieverA heat recieverB Improved Process 0 20 40 60 80 100 0 20 40 60 80 100 120 140 160 180 200 Tempetature volume heat serverA heat serverB heat recieverA heat recieverB Required 40℃ Required 80℃ Required 40℃ Required 80℃ ΔT=50℃ problem1 problem2 ΔT=10℃ ΔT=19℃ ΔT=20℃ NEDO
  • 8.
    Composite Curve (0) CP=f(volume,specificheat) Heat Flow Temperature IntensiveVariable2) Extensive variable1) =Temperature*CP ΔT CPα ・α < CPβ ・β CPγ ・γ 1)Extensive variable:indicates quantitative degree/A+A=2A 2)Intensive Variable:indicates qualitative degree/A+A=A The state of system can beThe state of system can be visualized qualitativelyvisualized qualitatively  andand quantitatively at the same timequantitatively at the same time. < Attention;Temperature is not directly the function of Heat Flow. Figure shows solely the relationship between Temperature and Heat Flow
  • 9.
    Composing the Curves H T 180°- 130° - 80° - 40° - CP = 40 CP =20 1 2 H T 180° - 130° - 80° - 40° - C P = 40 CP = 20 1 2 CP = 60 only only 1 2and NEDO
  • 10.
    Composite Curve(1) NEDO Conventional Process 0 50 100 150 200 0 10002000 3000 4000 5000 6000 7000 8000 Heat Flow(kW) Temperature heat recieveing curve heat supplying curve 2040 1200 extra cooling extra heating
  • 11.
    Composite Curve(2) NEDO Improved Process 0 50 100 150 200 0 10002000 3000 4000 5000 6000 7000 8000 Heat Flow(kW) Temperature heat recieveing curve heat supplying curve 1200 360 extra heating extra cooling
  • 12.
    Composite Curve(3) NEDO Comparison of Composite Curves 0 20 40 60 80 100 120 140 160 180 200 0 10002000 3000 4000 5000 6000 7000 8000 Heat Flow(kW) Temperature(℃) heat supplying heat receiving(conventional) heat receiving(improved) heat receiving(ideal) 360 1200  960 ΔTmin =10℃ 2040 heating 1200 120 cooling
  • 13.
    Pinch technology for Co-productionsystem Pinch technology for Thermal analysis Pinch technology for Material analysis Heat recovery Enthalpy Temperature Material reuse Mass Volume PurityofMaterial Optimizing Analysis Method for Heat and Material cascade utilization Pinch technology for Co-production system Maximization of material cascade utilization Maximization of thermal cascade utilization NEDO
  • 14.
    cost analysis ofgasification process 0 20,000 40,000 60,000 80,000 100,000 conventional pinch,thermal & material seperately co-pro pinch cost($/day) energy & Material cost co-pro operation cost Analysis Example of Co-production System NEDO - 18% - 26%
  • 15.
    Example of CorrelationBetween Steel Plant and Oil Refining Plant NEDO Coke oven gas refining unit CO/H2 refining unit  FT synthesizer Crude steel IroOre Lime stone Blast furnace Converter Coal Sintering Plant Coke Oven Naphtha for petrochemistry gasoline kerosene Gas oil Heavy oil FCC Reformer HDS Units of Naphtha, kerosene, Gas oil Hydrogen Generation units Petroleum Distillation Column Atmospheric Vacuum Distillation Column HDS Units of Units of VGO, Residual oil Asphalt S 5wt% Ni 60ppm V 200ppm Bypro-Hydrogen Fluid catalytic cracking Hydrogen desulphurization
  • 16.
    ConclusionConclusion 1.1.Pinch Technology visualizeswaste heatPinch Technology visualizes waste heat panoramicallypanoramically,,qualitatively and quantitativelyqualitatively and quantitatively.. 2.. Potential of Pinch technologyPotential of Pinch technology  for Energy Conservationfor Energy Conservation is notis not  less than 500less than 500∼1000∼1000MM・・LiterLiter・・crude oil/yearcrude oil/year.. 3.3. Moreover Pinch technology for Co-productionMoreover Pinch technology for Co-production system may enlarge the Energy Conservation effectsystem may enlarge the Energy Conservation effect.. NEDO