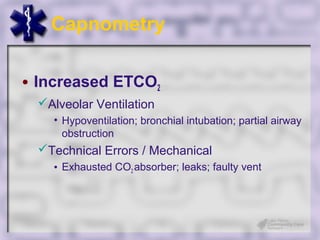
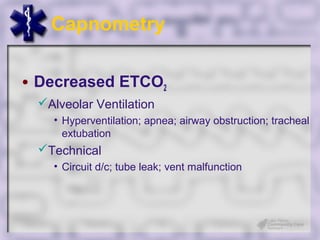
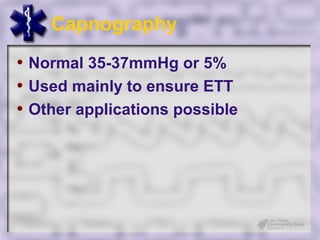
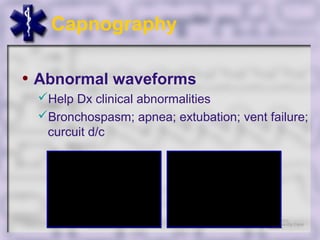
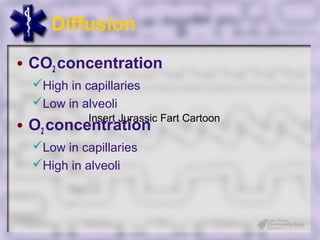
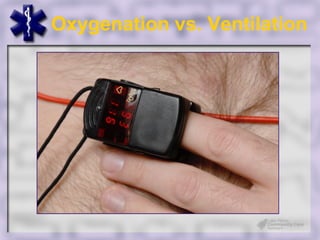
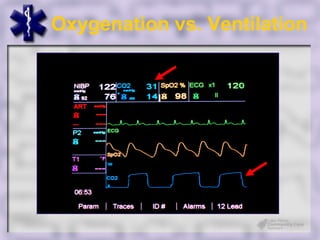
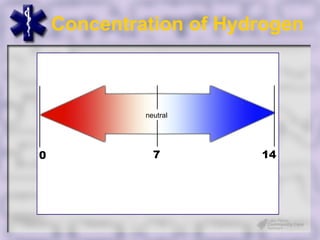
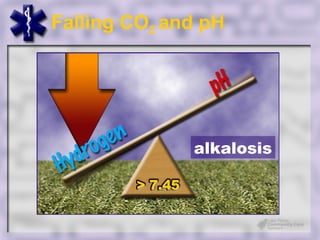
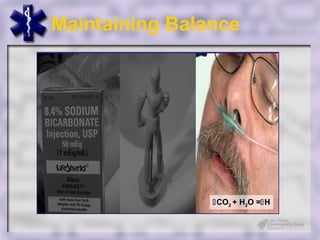
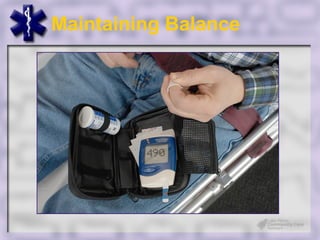
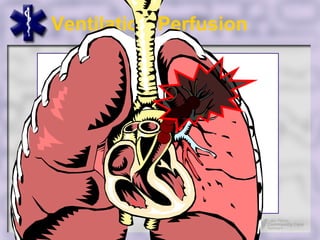
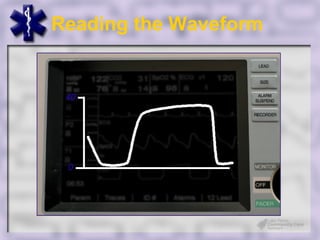
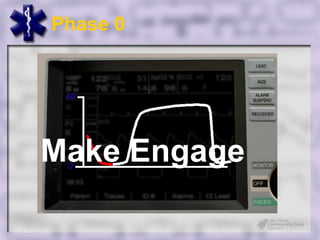
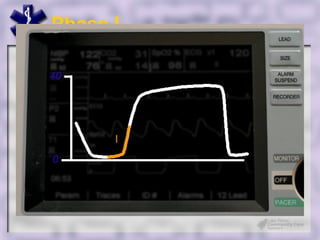
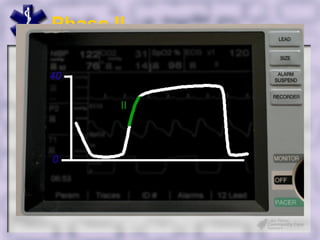
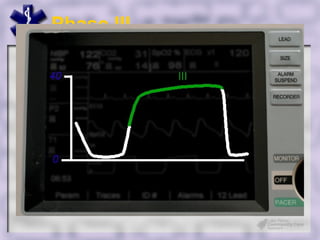
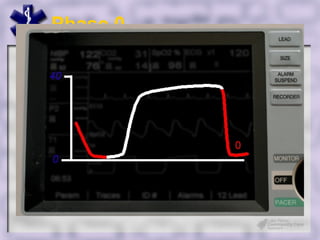
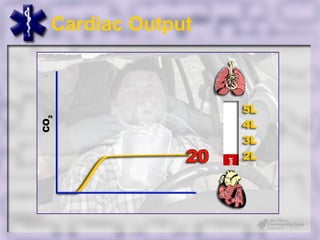
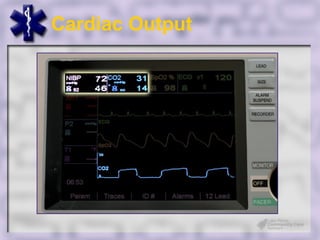
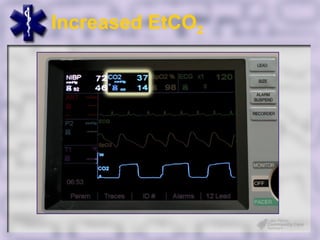
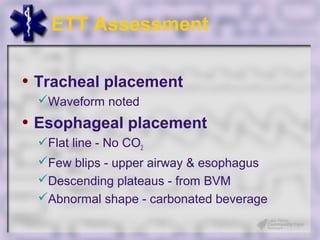
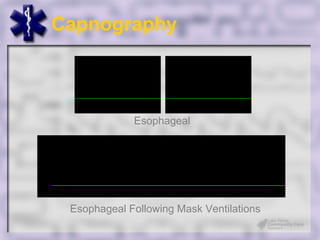
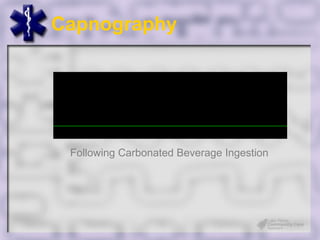
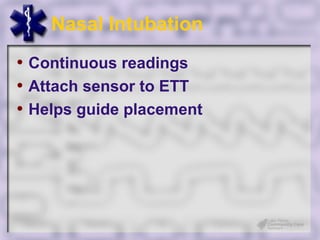
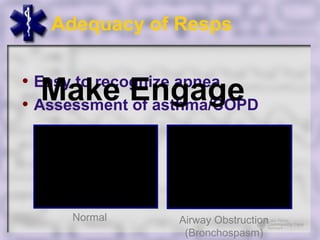
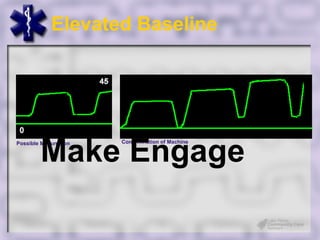
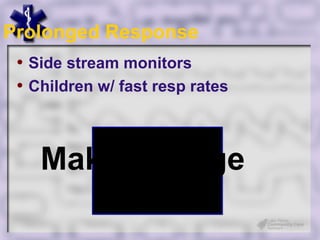
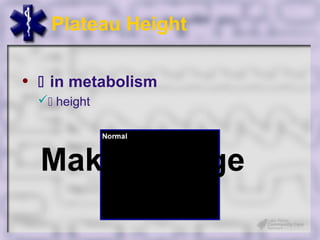
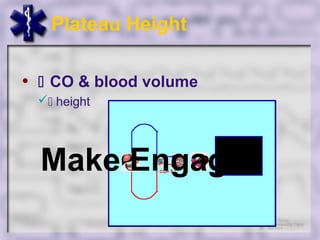
Capnography
    the ventilation vital sign
                 Developed by Kyle David Bates, MS, NR/CCEMT-P, FP-C
Goals of Lesson


• Understand CO2 physiology
• Defend waveform capnography
• Use waveform capnography
Capnometry

• Increased ETCO2
 Alveolar Ventilation
   • Hypoventilation; bronchial intubation; partial airway
     obstruction
 Technical Errors / Mechanical
   • Exhausted CO2 absorber; leaks; faulty vent
Capnometry

• Decreased ETCO2
 CO2 Output
   • Hypothermia
 Pulmonary Perfusion
   • Decreased CO2; hypotension; hypovolemia; PE;
     cardiac arrest
Capnometry

• Decreased ETCO2
 Alveolar Ventilation
   • Hyperventilation; apnea; airway obstruction; tracheal
     extubation
 Technical
   • Circuit d/c; tube leak; vent malfunction
Capnography

• GOLD STANDARD!
• Only guide to find leaks
  Waveform is key
Capnography
• Normal 35-37mmHg or 5%
• Used mainly to ensure ETT
• Other applications possible
Capnography

• Abnormal waveforms
 Help Dx clinical abnormalities
 Bronchospasm; apnea; extubation; vent failure;
  curcuit d/c
Capnography
              Hypoventilation


              Hyperventilation
Diffusion

• CO2 concentration
  High in capillaries
  Low in alveoli
            Insert Jurassic Fart Cartoon
• O2 concentration
  Low in capillaries
  High in alveoli
Oxygenation vs. Ventilation


        oxygen
Cellular Metabolism
Cellular Metabolism
                 Carbon Dioxide
Carbon Dioxide
What is Carbon Dioxide?
Joseph Black
•   Born in France
•   Schooled in Scotland
•   University of Edinburgh
•   Fixed air
Removal of CO2

 CO2 diffuses into                                          7% remains
                                                            dissolved in
  bloodstream                                                 plasma


                                93% diffuses into
                                    RBCs


     23% binds to hemoglobin
                                                      70% converted to
             forming
                                                        carbonic acid
      carbaminohemoglobin


                                                     Carbonic acid breaks
                                                    down into hydrogen and
                                                         bicarbonate


                    Hydrogen
                   removed by
                     buffers                                       Bicarbonate
                                                                 moves out of RBC

                                                                     Adapted from Anatomy and Physiology for Emergecy Care
Oxygenation vs. Ventilation


    Car
       bon
       Dio
         xid
             e


                 Carbon Dioxide
Breakdown of CO2


     CO2 + H2O = H2CO3
  Carbon Dioxide   Water   Carbonic Acid
Breakdown of CO2


    H2CO3 = H + HCO3
   Carbonic Acid   Hydrogen Bicarbonate
Concentration of Hydrogen


             neutral


0              7        14
Acid-Base Balance
Acid-Base Balance

              acidosis
Rising CO2 and pH


CO22 + H22O = H22CO33 = H + HCO33
Rising CO2, pH, and You


Respiratory Acidosis
Falling CO2 and pH


CO2 + H2O = H2CO3 = H + HCO3

                   alkalosis
Falling CO2, pH, and You


Respiratory Alkalosis
Alterations in Hydrogen


H + 2 HCO3 = H2CO3 3= CO++ H2O3
CO + H2O = H2CO = H 2 HCO
Hydrogen and pH
Rising Hydrogen and pH


Metabolic Acidosis
Lowered Hydrogen and pH


Metabolic Alkalosis
Maintaining Balance


• Linked to many processes
 Tissue metabolism
 Systemic circulation
 Ventilation


                         cdc.gov
Maintaining Balance


CO2 + HCO= H
 H H 2O 3       CO2 + H2O =H
Maintaining Balance
How does this relate?
CO2 Concentration


• Linked to many processes
 Tissue metabolism
 Systemic circulation
 Ventilation


                         cdc.gov
Ventilation:Perfusion


                  CO2
 V/Q
Ventilation:Perfusion


V/Q
Ventilation:Perfusion


                   CO2
V/Q
Ventilation:Perfusion
CO2 Concentration
Fick Principle
Fick Principle


                 Nikki Boertman The Commercial Appeal
Fick Principle
Fick Principle
Fick Principle
Measuring EtCO2


    • Colorimetry
    • Capnometry
    • Capnography
Colormetry


Make Engge
Colormetry


Make Engge
Capnometry


Make Engage
Capnography


Make Engage
Capnography


Make Engage
Capnographers


    Image of Zoll and LP


Make Engage
Capnography


ZOLL and close up

Photo illustration of this graphic

Make Engage
Capnography


Main Stream Table


Make Engage
Capnography


LP and close up

Photo illustration of this graphic

Make Engage
Capnography


Side stream Table


Make Engage
Reading the Waveform
Phase 0


Make Engage
Phase I


Make Engage
Phase II


Make Engage
Phase III


Make Engage
Phase 0


Make Engage
Waveform Analysis
Cardiac Output
Cardiac Output
Increased EtCO2
Increased EtCO2
Increased EtCO2
Summary
Clinical Uses
     how to to use this stuff
ETT Assessment

• Tracheal placement
 Waveform noted
• Esophageal placement
 Flat line - No CO2
 Few blips - upper airway & esophagus
 Descending plateaus - from BVM
 Abnormal shape - carbonated beverage
Capnography


             Esophageal


 Esophageal Following Mask Ventilations
Capnography


 Following Carbonated Beverage Ingestion
ETT Assessment
• Waveform monitor best
 Only way to confirm placement
 Traditional can be misleading
Nasal Intubation
• Continuous readings
• Attach sensor to ETT
• Helps guide placement
Hypermetabolic

•  in metabolic rate
   CO2 production
   ETCO2
  Malignant hyperthermia; severe sepsis

  Make Engage
CPR
• Effectiveness of efforts
• Chest compressions
  Lung blood flow low
  Few alveoli perfused
• BVM ventilations
   Make Engage
  Alveoli ventilated, not perfused (V/Q)
   CO2
CPR

• Improve blood flow to lungs
  More alveoli perfused
   ETCO2

• ETCO2 correlates to CO
  Make Engage
  ETCO2 used to judge resuscitation
  Technique change = improve outcome
CPR

• Prognosis based upon ETCO2
 Non-survivors lower than survivors
 No survivors < 10 mm Hg


  Make Engage
Adequacy of Resps


  Make Engage
• Easy to recognize apnea
• Assessment of asthma/COPD


     Normal      Airway Obstruction
                  (Bronchospasm)
Unusual Waveforms
       factors that effect the waveform
Elevated Baseline


         Make Engage
Possible Malfunction   Contamination of Machine
Prolonged I & II
• Obstruction in expiration
  Asthma; bronchospasm; COPD; kinked ETT;
   leaks


   Make Engage
Slope of III Increase
• Normal in pregnancy
 Physiological variations


  Make Engage
Curare Cleft
• Dip in plateau
  Spontaneous resp effort of patient


   Make Engage
Terminal Dip
• Detection of a leak


   Make Engage
Prolonged Response
 • Side stream monitors
 • Children w/ fast resp rates


    Make Engage
Plateau Height

•  in metabolism
   height


  Make Engage
Plateau Height

•  CO & blood volume
  height


  Make Engage
Plateau Height

• Ht dependant upon ventilation
  Hyperventilation =  height (low CO2)
  Hypoventilation =  height (high CO2)


  Make Engage
Capnography vs. Pulse Ox
Circulation & Metabolism
Summary

• ETCO2 becoming popular
• ETT assessment standard
 Placement suggested w/ typical means
 Confirmed w/ number & waveform
Summary

• Factors may affect readings
  ETCO2 may not be detected
    • Low cardiac outputs (shock & arrest)
    • False Negative
  Carbonated beverages/mouth-to-mouth
    • CO2 detected after esophageal intubation
    • False Positive
    • CO2 should diminish after 3-6 breaths
References
Alcamo, I. E. (1996). Anatomy and Physiology: The Easy Way. Hauppauge, New York:Barron’s
    Educational Services.

Huether, S. E. & McCance, K. L. (2004). Understanding Pathophysiology (3rd ed.). St.
   Louis:Mosby.

Kodali B. (2008). Retrieved from www.capnography.com on

Wikipedia

Martini, F. H., Bartholomew, E. F., & Bledsoe, B. E. (2002) Anatomy and Physiology for Emergency
   Care. Upper Saddle River, NJ:Prentice Hall.
Credits
• Author                     • Images / Animation
   Kyle David Bates            www.Capnography.com
      MS, NR/CCEMT-P, FP-C

• Reviewers
   Charlotte Crawford
      RN, MSN, MBA, EMT-P
   Scott Wander
      BS, EMT-P

End tidal

Editor's Notes

  • #2 Welcome to Capnography, wave of the future
  • #11 To truly understand capnography to its fullest extent there are some things that we must first cover. Throughout this lesson we will be discussing the movement of gases, such as oxygen, but more specifically carbon dioxide. This movement occurs through a process called diffusion which is the movement of particles from an area of higher concentration - to an area of lower concentration. You can compare it to farting, you smell it right away because, as we all know “whoever smelt it dealt it” as it is very concentrated around you. As time progresses and the particles spread to areas of lesser concentration, people across the room would begin smelling it and pointing at you.
  • #12 Next, we must discuss the difference between oxygenation and ventilation.* Oxygenation is the process of getting oxygen to the tissues. * It involves taking oxygen into the lungs and transporting it to the cells. * Your pulse ox measures oxygenation.
  • #13 Once the oxygen enters the cells, it combines with glucose to produce * energy.
  • #14 Think of your cells as the factories of the body. They bring in raw materials to manufacture their products. However, as with any factory, there will always be waste products. In the case of cellular metabolism the specific * byproduct produced is carbon dioxide.
  • #15 What is carbon dioxide? Essentially it is a chemical compound composed of two oxygen atoms bonded * to a single carbon atom. It is a gas at standard temperature and pressure and exists in Earth&apos;s atmosphere. It is produced by all animals, plants, fungi and microorganisms during respiration and is used by plants during photosynthesis.
  • #16 Dr. Joseph Black, born in France but schooled in Scotland studied properties of carbon dioxide while at the University of Edinburgh. For an experiment, Black placed a flame and mice into the carbon dioxide, both entities died and therefore he determined that the air was not breathable and termed it “fixed air” in 1754. He was the first person to isolate carbon dioxide in a perfectly pure state. This was an important step in the history of chemistry as it helped people to realize that air was not an element, but rather was composed of many different things and created by all living creatures as a waste product. [Wiki]
  • #17 As with any waste product, it must be disposed of.* As carbon dioxide diffuses out of the cells and into the bloodstream it does one of 2 things. * The first is that a small amount will dissolve in to the plasma.* The remainder diffuses into the red blood cells.* There some will combine with the hemoglobin, the same substance that carried the oxygen* and carried to the lungs for disposal but the majority will be converted into an acid * only to be broken down further into hydrogen and bicarbonate.* * These then are taken care of through other means.
  • #18 This leads us back to the differences between oxygenation and ventilation. Remember that oxygenation is the process by which oxygen is delivered to the tissues whereas ventilation is the movement of air in and out of the body.* Ventilation is the primary method of the * disposal of carbon dioxide * via the alveoli.* Capnography is how we measure ventilation.
  • #19 About 10% of the carbon dioxide that diffuses out of the cells and into the blood dissolves within the plasma and measured as P-C-O-2. It then diffuses into red blood cells, the same ones that carried oxygen to the cells*, and combines with water to form an acid known* as carbonic acid. This whole process of carbon dioxide plus water creates carbonic acid is represented by the equation: * CO2 plus H2O Equals H2CO3.
  • #20 Luckily the carbonic acid is only a temporary state for the carbon dioxide. It breaks down into * hydrogen and bicarbonate ions expressed * as H plus H-C-O-3. These excess hydrogen ions are then excreted in the urine. [UP]
  • #21 As we start talking about hydrogen, we should talk briefly about measuring the concentration of it. This concentration, or power of hydrogen, is expressed by the letters P-H, and represents the balance of acids, bases, and salts within the body. It is measured on a scale that goes * from 0 or a strong acid up to * 14 which is a strong base, a pH of * 7 is neutral such as with pure water. An example of a strong acid is stomach hydrochloric acid measuring a pH between 1 and 3 whereas a strong base such as oven cleaner may measure nearly a 14. [APEC]
  • #22 Hydrogen is needed to allow the body to perform its day-to-day activities but the body has a very narrow window to maintain its natural * balance, or homeostasis. This balance between the acids and the bases is referred to as the acid-base balance. In fact, we are slightly on the alkalotic side with the ph range of 7.35 to 7.45
  • #23 To disrupt this balance is to alter the levels of hydrogen and therefore the pH. The relationship between hydrogen and pH are opposite of each other. The higher the levels of hydrogen, the lower the pH.* In the body, a pH less then 7.35 is referred to as acidosis.*
  • #24 Now, if we return to our equation we can see that carbon dioxide and pH are directly related.* As the *carbon dioxide levels on the one side * increase, the amount of carbonic acid and *respectively the amount of hydrogen levels on the other side of the equation will increase as well.* This then lowers the pH creating an acidotic environment. [Display the equation as narrator talks CO2 + H2O = H2CO3 = H + HCO3]
  • #25 Take for example this patient who is unconscious and not breathing. Her cells are still working, still producing carbon dioxide, but her apnea is preventing it from being excreted. If she remains without ventilation, then carbon dioxide being created by her cells and that which is not being excreted, * will combine with water only to form additional hydrogen ions thusly lowering her pH and making her acidotic. Since the acidosis is the result of her impaired ventilation, she would be in what we * call respiratory acidosis.
  • #26 Going back to our equation, if you decrease the *carbon dioxide levels on the one side,* you decrease the amount of carbonic acid and then *respectively you will decrease the hydrogen levels on the other side of the equation.* This then * lowers the hydrogen levels which in turn raises the pH creating an alkalotic environment.
  • #27 Imagine this woman just sees a child getting stuck by a car. Her stress level is so great that she begins to hyperventilate. This causes her to blow off carbon dioxide faster then she can make it. As she continues she ,may start to get dizzy, her hands may tingle, and may even get a headache as all of the blood vessels in her brain constrict, preventing blood to her brain. If she continues to long, she may actually effect her pH, increasing it to above 7.45 therefore becoming alkalotic. Once again, since this is a result of breathing* , it is called respiratory alkalosis.
  • #28 Up to this point we have been focusing upon how impaired ventilation causes respiratory acidosis and respiratory alkalosis. However there may also be metabolic causes as well that alter the * hydrogen levels in the body. * In fact we can use the same equation, we will just reverse * it but the rule stays the same: * what happens to one side happens to the other. * Therefore if more hydrogen ions are produced then the more carbon dioxide is created.
  • #29 We will use the same terms in regards to the change in pH, we will just replace respiratory with the term metabolic.
  • #30 For example, you are called to a business for a sick male. You notice that he has an altered mental status, appears flushed, has dry mucous membranes, and a fruity odor to his breath. You check his blood glucose to find that it is high, this patient is in diabetic ketoacidosis or DKA. This state, causes his hydrogen to increase thereby lowering his pH placing him into a metabolic acidosis.
  • #31 On the other hand, a patient may develop a metabolic alkalosis * as they lose hydrogen, or acids * such as a patient with excessive vomiting.
  • #32 The body maintains its environment similar to how we maintain our environments. We keep what is good, throw out what is bad and not useful anymore, and recycle the rest for future use.
  • #33 We maintain this acid-base balance through a buffer system that consists of 3 parts.* The first is the bicarb buffer system. * It adds hydrogen ions to the system by combining water and carbon dioxide and * removes hydrogen by combining it with bicarbonate.* The second system, the renal system, modifies the pH by either excreting hydrogen ions through the urine or reabsorbing bicarbonate in the kidneys. * Then there is the part of the buffer system that we are going to be most concerned about, the Pulmonary System. Not only will the * respiratory rate directly impact the amount of carbon dioxide in the body butl the levels of carbon dioxide in the body will directly effect the respiratory rate.
  • #34 Using our DKA patient from earlier we can see how the buffer system can play a role in maintaining balance. As his hydrogen ions increase and the patient starts to develop a metabolic acidosis, the the bicarb system releases more bicarbonate to combine with the hydrogen ions which in turn increases the amount of carbon dioxide in the body. As this carbon dioxide is absorbed into the red blood cells it is transported to the lungs where it diffuses out of cells and into the alveoli. As these levels increase, the patient’s body begins to breath faster to keep up with the increasing levels of carbon dioxide. In fact, these patients are often breathing so fast that, although they may be in a metabolic acidosis, their hyperventilation places them into a relative respiratory alkalosis as well. Finally, the renal system expels the excess hydrogen via the urine and reabsorbs the bicarbonate for later use. This is why many of your DKA patients are hyperventilating and dehydrated, it is the buffer systems at work.
  • #35 So, what does all of this have to do with capnography? As we have discussed here, carbon dioxide is a waste product from the cells and also an end-product when hydrogen is combined with bicarbonate. By definition, capnography is the measurement of carbon dioxide and since we measure it upon exhalation we use the term end-tidal capnography or E-T-C-O-2. Therefore not only does capnography measure ventilation but indirectly measures metabolism and circulation. An increase in metabolism, such as with a fever, we will see an increase in the end-tidal CO2. Whereas a decrease in circulation to the lungs will decrease the amount of CO2 being exhaled thus showing a lower end-tidal reading. [“CO2 is the smoke from the flames of metabolism.”– Ray Fowler, M.D. Dallas, Street Doc’s Society] (blogspot)
  • #36 Therefore the amount of carbon dioxide that we measure as end-tidal is dependant upon those 3 things: tissue metabolism, systemic circulation, and ventilation. Each one of these will play a part in how much is generated and how much is excreted however since we will be measuring the amount of carbon dioxide upon exhalation, the lungs, and their perfusion, will play a vital role.
  • #37 The ventilation to perfusion ratio deals with the amount of air compared to the amount of blood that an area of the lung receives. Generally speaking, the upper areas of the lungs, being closer to the bronchioles and above the heart, receive more air than blood. Therefore it is said that there is a higher ventilation to perfusion ratio, or big V small Q
  • #38 As you move down the lungs into the middle lobes the ventilation to perfusion ratio, or V-Q, is almost equal. However, since the bases are lower, bigger, and below the heart, they often receive less blood when compared to air thereby causing a lower ventilation to perfusion ratio. These are examples of physiological, or normal ratio differences.
  • #39 You can alter the ventilation side of the ratio, causing more or less carbon dioxide to be expelled. Hyperventilation will remove carbon dioxide faster then the body can make it and deliver it to the lungs. This then creates a ratio whereby ventilation if greater than perfusion. On the other hand, a patient not breathing but still has an adequate pulse, is adding to the amount of carbon dioxide in the lungs but not removing it . This would then lead to ventilation that is lesser than the perfusion.
  • #40 If ventilation or perfusion are unstable, a Ventilation/Perfusion (V/Q) mismatch can occur. This will alter the correlation between the amount of carbon dioxide in the blood (PaC02) and upon exhalation (PetCO2). This V/Q mismatch can be caused by blood shunting such as occurs during atelectasis (perfusing unventilated lung area) or by dead space in the lungs (Ventilating unperfused lung area) such as occurs with a pulmonary embolisim or hypovolemia.
  • #41 How does this apply to you? Well, the more CO2 that builds up, the greater the concentration of acid. However the end-tidal carbon dioxide reading could be deceiving for the amount of carbon dioxide being expelled may be much lower then the amount of carbon dioxide in the blood. As we mentioned earlier, the amount of end-tidal carbon dioxide is dependant upon several functions including circulation.
  • #42 To help us understand this let’s look at * Fed-Ex. Packages arrive, distributed, shipped, dropped off, new packages picked-up, brought back and then sent out. This is a similar process within your body. All packages arrive via the airport. This is you taking a breath, oxygen is delivered.
  • #43 In the warehouse the packages, or oxygen, are distributed to the trucks, or hemaglobin, for shipment.* The truck then leave the warehouse via a complex road system, the arteries * and then shipped to the businesses. * When they arrive at the business, in this case the body’s cells, they deliver their packages, oxygen, but at the same time* pick-up packages as well, carbon dioxide.
  • #44 The trucks, now loaded with carbon dioxide, travel the roads, or veins, returning the the warehouse where they are off loaded and then shipped out.
  • #45 The problem arises when few planes are coming in - hypoventilation. There are still packages in the warehouse to be delivered and the businesses are still receiving and shipping. The problem arises when there are no more packages in the warehouses, yet the businesses are still producing, delivering them to the warehouse. Here we would see a high end-tidal carbon dioxide.
  • #46 However we may have low end-tidal carbon dioxide in the instance of hemorrhage or decreased cardiac output. This would be like if there were an earthquake that takes out the main roadways. As we lose trucks, we lose the ability to carry packages back to the warehouse however the businesses continue to produce but delivery to the warehouse has diminished.
  • #47 Knowing all of this, we can now begin to discuss the measurement of carbon dioxide. We can measure it by 3 different ways: We can use litmus paper that changes color in its presence, known as colormetry or We can measure, numerically, the amount of carbon dioxide that is expelled, called capnometry and finally, we can graphically measure the expulsion of carbon dioxide - capnography.
  • #48 The type of device almost everyone is familiar with is this color changing device. It uses pH-sensitve paper that changes color in the presence of carbon dioxide and once again in its absence If the paper stays, or turns purple, there is &lt; 4 mm Hg or &lt; 0.5% carbon dioxide. If the paper turns tan, then there is 4-15 mm Hg or 0.5% - 2.0% carbon dioxide. If the paper turns yellow then there is 20 mm Hg or &gt; 2.0% carbon dioxide. We typically remember these colors as Yellow YES, Tan, think about it, and purple PULL Or Big bird good, Barney bad.
  • #49 The color change of the device is fairly quick, breath-by breath however this device is not very sensitive when carbon dioxide output is low as is during CPR potentially giving a false negative thereby to lead the user to think that the endotracheal tube is misplaced. On the other hand, if the endotracheal tube is placed into the stomach, any residue carbon dioxide from carbonated beverages or from mouth-to-mouth may be detected by the colormetric device falsely identifying that the endotracheal tube is properly placed. These device are not meant for long term, in line measurement, generally being good for about 2 hours however their life may be shortened if they get wet with emesis or medications. Gastric contents, mucus, and drugs such as epinephrine can also cause false positive results a false positive result causes a permanent color change in the device; hence, the color does not vary with ventilation. [cap.com]
  • #50 To better determine how much carbon dioxide a patient is expelling, the use of a capnometer may be beneficial. A capnometer is a digital display that gives numbers in mm of mercury or by percentage. They are more costly than the color detectors but allow for continuous measurement giving the maximum inspiratory and expiratory carbon dioxide concentrations during the respiratory cycle. However, it too is subject to many of the same false negatives and positives in the presence of decreased cardiac output or residual gastric carbon dioxide.
  • #51 Only through a capnogram, a graphic display of instantaneous carbon dioxide concentration versus time or expired volume during a respiratory cycle [cap.com] is it possible to not only significantly decrease the likelihood of false readings, but through waveform capnography you may also use it as a diagnostic tool similar to your cardiac monitor.
  • #52 Many waveform capnography units also incorporate capnometry as well. This allows the user to correlate the numerical values with the graphical display allowing them to make an informed decision as the readings.
  • #53 There are two types of capnography units out there and they are defined by how they obtain their samples. One uses infrared right at the tube, the other draws in a sample and measures it within the monitor.
  • #54 Mainstream units use an airway adapter placed between the endotracheal tube and the manual resuscitator or ventilation tubing. An infrared sensor, that emits infrared light is then attached to the adapter with the infrared light going through a window in the adapter to a photodetector on the other side of the sensor. The sensor is then connected to the machine via a cable. Since the measurement device is in the direct ventilatory circuit , analysis of the end-tidal carbon dioxide is measured in the airway and is real time giving cripser waveforms. To prevent condensation of water vapor, which if not compensated for can cause falsely high CO2 readings, the mainstream sensor is heated to slightly above body temperature. This heating process helps keep the windows of the airway adapter clear so the sensor can tolerate high moisture environments. New mainstream sensors use circuitry, which limits the power delivered so the sensor never reaches a temperature high enough to cause even redness of the skin eliminating the concern of patient burns. There have been many advances in mainstream technology over the years. Older generation mainstream analyzers have had the reputation of being fragile, bulky and heavy which put traction on the ET tube and made them prone to breakage. New generation mainstream sensor design addresses many of these issues. They are smaller and weigh less than 80 grams (2.8 ounces) and some utilize a “solid state” design, so there are no moving parts, which make them very durable and less prone to breakage. A variety of single patient use airway adapters are available eliminating the issue of sterilization or cross contamination. In addition, low deadspace versions which add less than 0.5cc of deadspace make the technology a viable ETCO2 monitor for the neonatal patient. In summary, recent technological advances have overcome some of earlier disadvantages of main stream sensors to match side stream sensors in terms of weight and size.]
  • #55 Common issues with this type of measurement is that condensation may build up on he sensor giving a falsely high reading. To help address this, many sensors are heated, newer technologies use circuitry, which limits the power delivered so the sensor therefore never reaches a temperature high enough to cause even redness and the ap and since the sensor is attached directly to the endotracheal tube it is subject to occlusion from secretions and medications as well as the heavy sensor pulling traction on the tube. Advantages Disadvantages No sampling tube No obstruction No affect due to pressure drop No affect due to changes in water vapor pressure No pollution No deformity of capnograms due to non dispersion of gases No delay in recording Suitable for neonates and children Disadvantages Contrary to the earlier versions, the newer sensors are light weight minimizing traction on the endotracheal tube. Long electrical cord, but it is lightweight. Facial burns have been reported with earlier versions. This has been eliminated with newer sensors (see below) Sensor windows may clog with secretions. However, they can be replaced easily as they are disposable. Difficult to use in unusual patient positioning such as in prone positions. The newer versions use disposable sensor windows thereby eliminating sterilization problem (see below)
  • #56 Other devices have the carbon dioxide sensor within the machine, these are known as side stream These units have a tiny pump within that pulls samples into the machine for analysis. Since these units perform their measurements within the device, there is a slight delay in readings. However, this technique allows for easier measurement of non-intubated patients since there is only a small tube connected to an adapter. Some know issues that affect side stream monitors include occlusion of the sampling tube as well as water vapor and pressure can affect the readings. [In side-stream capnography, the CO2 sensor is located in the main unit itself (away from the airway) and a tiny pump aspirates gas samples from the patient&apos;s airway through a 6 foot long capillary tube into the main unit. The sampling tube is connected to a T-piece inserted at the endotracheal tube or anesthesia mask connector. The gas that is withdrawn from the patients often contains anesthetic gases and so the exhausted gas from the capnograph should be routed to a gas scavenger or returned to the patient breathing system. The sampling flow rate may be high (&gt;400 ml.min-1) or low (&lt;400 ml.min-1). The optimal gas flow is considered to be 50-200 ml.min-1 which ensures that the capnographs are reliable in both children and adults.1,2 The side-stream capnographs have a unique advantage: they allows monitoring of non-intubated subjects, as sampling of the expiratory gases can be obtained from the nasal cavity using nasal adaptors.3-5 Further, gases can also be sampled from the nasal cavity during the administration of oxygen using a simple modification of the standard nasal cannulae.6,7 This feature enables monitoring of expired CO2 in subjects receiving simultaneous oxygen administration using nasal cannulae.]
  • #57 Some know issues that affect side stream monitors include occlusion of the sampling tube as well as water vapor and pressure can affect the readings. Advantages Easy to connect No problems with sterilization Can be used in awake patients Easy to use when patient is in unusual positions such as in prone position Can be used in collaboration with simultaneous oxygen administration via a nasal prong Disadvantages Delay in recording due to movement of gases from the ET to the unit Sampling tube obstruction Water vapor pressure changes affect CO2 concentrations Pressure drop along the sampling tube affects CO2 measurements Deformity of capnograms in children due to dispersion of gases in sampling tubes
  • #58 Now that we have discussed the process of capnography and the devices, let’s look at analyzing the waveform. Unlike a cardiac monitor and an ECG, capnographs are relatively easy. They represent the evolution of carbon dioxide from alveoli to mouth, each healthy person has generally the same waveform. Each aspect of the waveform signifies a part in the ventilatory phase as well as the presence and amount of carbon dioxide being exhaled.
  • #59 The first aspect, Phase zero represents the end of inspiration as carbon dioxide-free gases move into the alveoli and diffusing into the capillaries. It is also during this phase that carbon dioxide diffuses out of the capillaries and into the alveoli. Remember that the amount of carbon dioxide that diffuses into the alveoli depends upon the V/Q, or ventilation to perfusion ratio. A: End of inhalation; B: Beginning of exhalation; B ミ D : Exhalation of alveolar gas; D: End exhalation and point of maximal or highest CO2concentration {end-tidal CO2(EtCO2)}; D ミ E : Inhalation. A-B: Dead space ventilation (no CO2in the initial breath); B-C: Ascending phase (rapid rise in CO2); C-D: Alveolar plateau (steady state of CO2); D: End-tidal CO2(the maximum CO2in each breath); D-E: Inspiration (CO2falls to zero).
  • #60 The next aspects are all written as roman numerals. Phase 1 is the beginning of exhalation. Remember that as you take a breath in, not all of it reaches the alveoli for exchange. In fact some of the inhaled air never reaches the lungs, it remains in the trachea and bronchi. This is know as dead space. Since there is no exchange of gases in the dead space, the first part of phase 1, there is little carbon dioxide measured.
  • #61 Upon continued exhalation, the carbon dioxide levels slowly start increasing as the air in the alveoli that did not get full exchange of gases begins to get measured. This is identified as Phase 2 This is where the air in the anatomical dead space, that from the trachea and bronchi, mixes with the non-exchanged air in the alveoli, alveolar dead space.
  • #62 Phase 2 quickly becomes Phase 3 as the air from the lungs that are better ventilated and better perfused are measured and carbon dioxide rich air from these areas reaches the sensing point. As exhalation comes to an end, the right corner of the plateau rises up sharply representing the maximum carbon dioxide exhaled and is generally the carbon dioxide from the base of the lungs. This is the end-tidal carbon dioxide reading. Better ventilated &amp; better perfused Lower relatively more perfusion (v/Q) Therefore higher CO 2 Late emptying of alveoli w/ low V/Q Contain high CO 2
  • #63 Finally, the waveform terminates the same way that it began, at Phase zero. This is the beginning of inhalation and thus the end of carbon dioxide exhalation. The waveform drops to baseline, or zero, as there is no carbon dioxide to measure.
  • #64 5 characteristics Frequency Rhythm Height Baseline Shape Identical to all humans w/ healthy lungs
  • #65 Since the amount of carbon dioxide that is expelled depends upon adequate perfusion to the lungs, one can use capnography as a tool in determining cardiac output for end-tidal carbon dioxide reflects pulmonary blood flow. For example, an end-tidal greater than 30 mm of mercury may reflect a cardiac output of 4 litres per minute where an end-tidal greater than 34 denotes a pulmonary blood flow of 5 litres per minute. Simply put, no blood going to the lungs, no carbon dioxide getting out. But remember that carbon dioxide is still being created and building up in the blood making the patient acidotic.
  • #66   
  • #67 Looking at our previous patient, as resuscitation and treatment of shock progresses, the patient’s blood pressure will increase improving lung perfusion and subsequently elimination of carbon dioxide. You would then see an increase in the capnometry and the waveform thus signifying patient improvement. However, if the end-tidal is increasing, yet the blood pressure is not changing, one may consider that the blood is becoming saturated with carbon dioxide, known as hypercarbic, and it is not that more blood is returning to the lungs just that the blood that IS returning has a higher concentration of carbon dioxide. If you recall from earlier, the CO 2 Output Fever; sodium bicarb; tourniquet release Pulmonary Perfusion Increased CO 2 or blood pressure
  • #68 Other causes of an increased end-tidal reading make you recall the things that we talked about at the beginning of this course. If someone has a fever their metabolic rate is high and therefore producing large amounts of carbon dioxide. If you recall from earlier, the CO 2 Output Fever; sodium bicarb; tourniquet release Pulmonary Perfusion Increased CO 2 or blood pressure
  • #69 Looking at our previous patient, as resuscitation and treatment of shock progresses, the patient’s blood pressure will increase improving lung perfusion and subsequently elimination of carbon dioxide. You would then see an increase in the capnometry and the waveform thus signifying patient improvement. However, if the end-tidal is increasing, yet the blood pressure is not changing, one may consider that the blood is becoming saturated with carbon dioxide, known as hypercarbic, and it is not that more blood is returning to the lungs just that the blood this IS retruning has a higher concentration of carbon dioxide. If you recall from earlier, the CO 2 Output Fever; sodium bicarb; tourniquet release Pulmonary Perfusion Increased CO 2 or blood pressure
  • #92 Capnography provides an immediate picture of patient condition. Pulse oximetry is delayed. Hold your breath. Capnography will show immediate apnea, while pulse oximetry will show a high saturation for several minutes.
  • #93 While capnography is a direct measurement of ventilation in the lungs, it also indirectly measures metabolism and circulation. For example, an increased metabolism will increase the production of carbon dioxide increasing the ETCO2. A decrease in cardiac output will lower the delivery of carbon dioxide to the lungs decreasing the ETCO2.
  • #96 http://emscapnography.blogspot.com/2006/08/10-things-every-paramedic-should-know.html#comments (27 mar 2008)