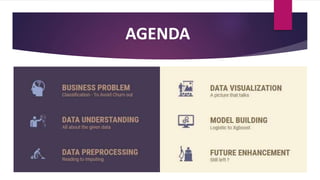
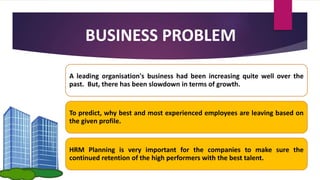
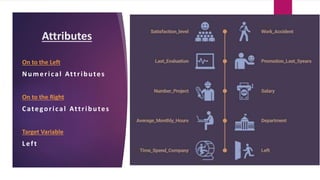
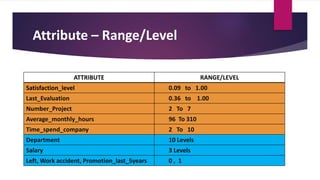
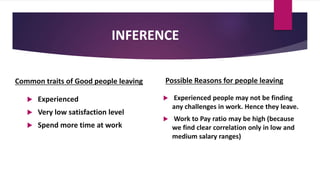
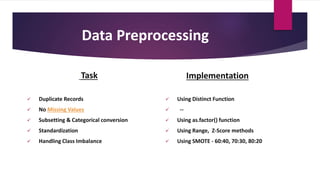
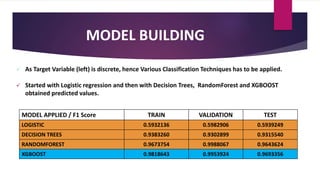
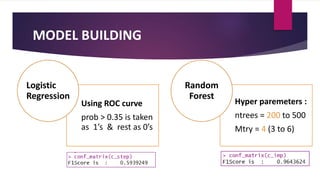
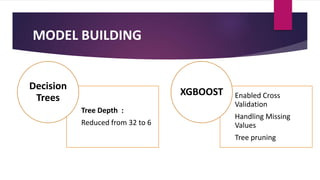
Employee
Attrition
Analysis
- GOPINADH . L
AGENDA
BUSINESS PROBLEM
A leading organisation's business had been increasing quite well over the
past. But, there has been slowdown in terms of growth.
To predict, why best and most experienced employees are leaving based on
the given profile.
HRM Planning is very important for the companies to make sure the
continued retention of the high performers with the best talent.
“
”
DATA UNDERSTANDING
Attributes
On to the Left
Numerical Attributes
On to the Right
Categorical Attributes
Target Variable
Left
Attribute – Range/Level
ATTRIBUTE RANGE/LEVEL
Satisfaction_level 0.09 to 1.00
Last_Evaluation 0.36 to 1.00
Number_Project 2 To 7
Average_monthly_hours 96 To 310
Time_spend_company 2 To 10
Department 10 Levels
Salary 3 Levels
Left, Work accident, Promotion_last_5years 0 , 1
Data Understanding
ATTRIBUTE 0’s 1’s
Left 11428 3571
Left (Distinct) 10000 1991
 Total number of observations is 14999 with 9 independent attributes.
 The given data has mix of Numerical & Categorical Attributes.
 Target variable is left & it is discrete, which has high class imbalance.
Binary
Classification
(Approach)
 Given, Target variable is left
& it is discrete which has two classes.
 Where as ‘1’ is considered as left &
that of ‘0’ is considered as not left .
 This is supervised learning classification
model building approach.
 Error Metric to be worked on
is F1Score .
“
”
DATA VISUALISATION
Correlation Plot
Positive Correlation
Number_project , last_evaluation,
Average_monthly_hours,
Time_spend_company
Negative Correlation
Satisfaction_level,
Number_project ,
Time_spend_company
Neutral /No Correlation
Average_monthly_hours,
satisfaction_level
Random Forest
(Attribute’s Significance)
Satisfaction_level
Number_Project
Average_monthly_hours
Time_spend_company
Last evaluation
DATA VISUALISATION
Department v/s Left
(Salary)
Attrition rate for the low
salary is high.
Sales, Support, Technical
departments has high
attrition.
Avg. Satisfaction Level
v/s
Avg. Monthly Hours
Monthly hours does have effect
on satisfaction level
More monthly hours have less
satisfaction level
Reason :
Human capacity per day
DATA VISUALISATION
INFERENCE
Common traits of Good people leaving
 Experienced
 Very low satisfaction level
 Spend more time at work
Possible Reasons for people leaving
 Experienced people may not be finding
any challenges in work. Hence they leave.
 Work to Pay ratio may be high (because
we find clear correlation only in low and
medium salary ranges)
“
”
DATA PRE-PROCESSING
Data Preprocessing
Task
 Duplicate Records
 No Missing Values
 Subsetting & Categorical conversion
 Standardization
 Handling Class Imbalance
Implementation
 Using Distinct Function
 --
 Using as.factor() function
 Using Range, Z-Score methods
 Using SMOTE - 60:40, 70:30, 80:20
MODEL BUILDING
 As Target Variable (left) is discrete, hence Various Classification Techniques has to be applied.
 Started with Logistic regression and then with Decision Trees, RandomForest and XGBOOST
obtained predicted values.
MODEL APPLIED / F1 Score TRAIN VALIDATION TEST
LOGISTIC 0.5932136 0.5982906 0.5939249
DECISION TREES 0.9383260 0.9302899 0.9315540
RANDOMFOREST 0.9673754 0.9988067 0.9643624
XGBOOST 0.9818643 0.9953924 0.9693356
MODEL BUILDING
Using ROC curve
prob > 0.35 is taken
as 1’s & rest as 0’s
Logistic
Regression
Hyper paremeters :
ntrees = 200 to 500
Mtry = 4 (3 to 6)
Random
Forest
MODEL BUILDING
Tree Depth :
Reduced from 32 to 6
Decision
Trees Enabled Cross
Validation
Handling Missing
Values
Tree pruning
XGBOOST
FUTURE ENHANCEMENTS
 With the use of functional/domain knowledge,
Feature engineering will be done by generating a new columns or attributes.
 Other Classification models will be applied with the respective hyper parameter tuning.
Thank you

Employee Attrition Analysis / Churn Prediction

  • 1.
  • 2.
  • 3.
    BUSINESS PROBLEM A leadingorganisation's business had been increasing quite well over the past. But, there has been slowdown in terms of growth. To predict, why best and most experienced employees are leaving based on the given profile. HRM Planning is very important for the companies to make sure the continued retention of the high performers with the best talent.
  • 4.
  • 5.
    Attributes On to theLeft Numerical Attributes On to the Right Categorical Attributes Target Variable Left
  • 6.
    Attribute – Range/Level ATTRIBUTERANGE/LEVEL Satisfaction_level 0.09 to 1.00 Last_Evaluation 0.36 to 1.00 Number_Project 2 To 7 Average_monthly_hours 96 To 310 Time_spend_company 2 To 10 Department 10 Levels Salary 3 Levels Left, Work accident, Promotion_last_5years 0 , 1
  • 7.
    Data Understanding ATTRIBUTE 0’s1’s Left 11428 3571 Left (Distinct) 10000 1991  Total number of observations is 14999 with 9 independent attributes.  The given data has mix of Numerical & Categorical Attributes.  Target variable is left & it is discrete, which has high class imbalance.
  • 8.
    Binary Classification (Approach)  Given, Targetvariable is left & it is discrete which has two classes.  Where as ‘1’ is considered as left & that of ‘0’ is considered as not left .  This is supervised learning classification model building approach.  Error Metric to be worked on is F1Score .
  • 9.
  • 10.
    Correlation Plot Positive Correlation Number_project, last_evaluation, Average_monthly_hours, Time_spend_company Negative Correlation Satisfaction_level, Number_project , Time_spend_company Neutral /No Correlation Average_monthly_hours, satisfaction_level
  • 11.
  • 12.
  • 13.
    Department v/s Left (Salary) Attritionrate for the low salary is high. Sales, Support, Technical departments has high attrition.
  • 14.
    Avg. Satisfaction Level v/s Avg.Monthly Hours Monthly hours does have effect on satisfaction level More monthly hours have less satisfaction level Reason : Human capacity per day
  • 15.
  • 16.
    INFERENCE Common traits ofGood people leaving  Experienced  Very low satisfaction level  Spend more time at work Possible Reasons for people leaving  Experienced people may not be finding any challenges in work. Hence they leave.  Work to Pay ratio may be high (because we find clear correlation only in low and medium salary ranges)
  • 17.
  • 18.
    Data Preprocessing Task  DuplicateRecords  No Missing Values  Subsetting & Categorical conversion  Standardization  Handling Class Imbalance Implementation  Using Distinct Function  --  Using as.factor() function  Using Range, Z-Score methods  Using SMOTE - 60:40, 70:30, 80:20
  • 19.
    MODEL BUILDING  AsTarget Variable (left) is discrete, hence Various Classification Techniques has to be applied.  Started with Logistic regression and then with Decision Trees, RandomForest and XGBOOST obtained predicted values. MODEL APPLIED / F1 Score TRAIN VALIDATION TEST LOGISTIC 0.5932136 0.5982906 0.5939249 DECISION TREES 0.9383260 0.9302899 0.9315540 RANDOMFOREST 0.9673754 0.9988067 0.9643624 XGBOOST 0.9818643 0.9953924 0.9693356
  • 20.
    MODEL BUILDING Using ROCcurve prob > 0.35 is taken as 1’s & rest as 0’s Logistic Regression Hyper paremeters : ntrees = 200 to 500 Mtry = 4 (3 to 6) Random Forest
  • 21.
    MODEL BUILDING Tree Depth: Reduced from 32 to 6 Decision Trees Enabled Cross Validation Handling Missing Values Tree pruning XGBOOST
  • 22.
    FUTURE ENHANCEMENTS  Withthe use of functional/domain knowledge, Feature engineering will be done by generating a new columns or attributes.  Other Classification models will be applied with the respective hyper parameter tuning.
  • 23.