The document contains confidential information about AAUM. Disclosing this information could damage AAUM. AAUM owns all confidential information in any media.
This document containsinformation and data that AAUM considers confidential. Any disclosure of
Confidential Information to, or use of it by any other party, will be damaging to AAUM. Ownership of all
Confidential Information, no matter in what media it resides, remains with AAUM.
AAUM Confidential
Analytics
for
HR
2.
- 1 -
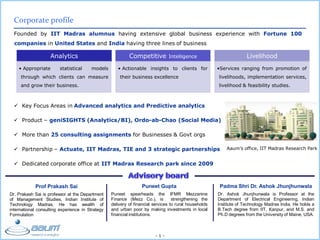
Corporateprofile
Founded by IIT Madras alumnus having extensive global business experience with Fortune 100
companies in United States and India having three lines of business
Prof Prakash Sai
Dr. Prakash Sai is professor at the Department
of Management Studies, Indian Institute of
Technology Madras. He has wealth of
international consulting experience in Strategy
Formulation
Puneet Gupta
Puneet spearheads the IFMR Mezzanine
Finance (Mezz Co.), is strengthening the
delivery of financial services to rural households
and urban poor by making investments in local
financial institutions.
Padma Shri Dr. Ashok Jhunjhunwala
Dr. Ashok Jhunjhunwala is Professor at the
Department of Electrical Engineering, Indian
Institute of Technology Madras India. He holds a
B.Tech degree from IIT, Kanpur, and M.S. and
Ph.D degrees from the University of Maine, USA.
Analytics
• Appropriate statistical models
through which clients can measure
and grow their business.
Competitive Intelligence
• Actionable insights to clients for
their business excellence
Livelihood
•Services ranging from promotion of
livelihoods, implementation services,
livelihood & feasibility studies.
Key Focus Areas in Advanced analytics and Predictive analytics
Product – geniSIGHTS (Analytics/BI), Ordo-ab-Chao (Social Media)
More than 25 consulting assignments for Businesses & Govt orgs
Partnership – Actuate, IIT Madras, TIE and 3 strategic partnerships
Dedicated corporate office at IIT Madras Research park since 2009
Aaum’s office, IIT Madras Research Park
3.
- 2 -
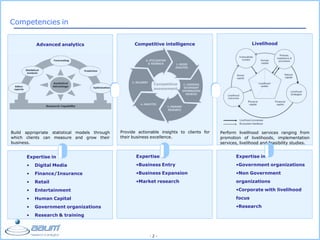
Competenciesin
Advanced analytics
Build appropriate statistical models through
which clients can measure and grow their
business.
Expertise in
• Digital Media
• Finance/Insurance
• Retail
• Entertainment
• Human Capital
• Government organizations
• Research & training
Competitive
assessment
Competitive intelligence
Provide actionable insights to clients for
their business excellence.
Expertise in
•Business Entry
•Business Expansion
•Market research
Livelihood
Perform livelihood services ranging from
promotion of livelihoods, implementation
services, livelihood and feasibility studies.
Expertise in
•Government organizations
•Non Government
organizations
•Corporate with livelihood
focus
•Research
- 4 -
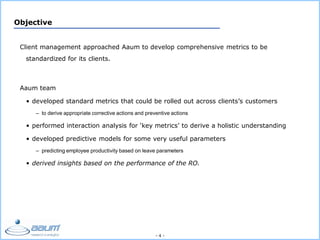
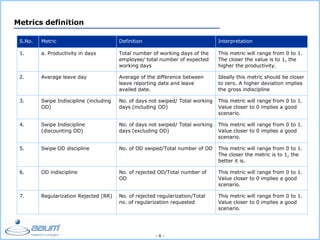
Objective
Clientmanagement approached Aaum to develop comprehensive metrics to be
standardized for its clients.
Aaum team
• developed standard metrics that could be rolled out across clients’s customers
– to derive appropriate corrective actions and preventive actions
• performed interaction analysis for ‘key metrics’ to derive a holistic understanding
• developed predictive models for some very useful parameters
– predicting employee productivity based on leave parameters
• derived insights based on the performance of the RO.
- 6 -
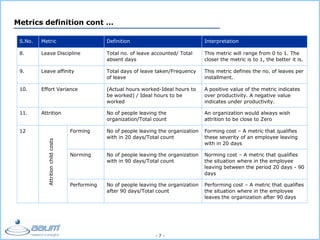
S.No.Metric Definition Interpretation
1. a. Productivity in days Total number of working days of the
employee/ total number of expected
working days
This metric will range from 0 to 1.
The closer the value is to 1, the
higher the productivity.
2. Average leave day Average of the difference between
leave reporting date and leave
availed date.
Ideally this metric should be closer
to zero. A higher deviation implies
the gross indiscipline
3. Swipe Indiscipline (including
OD)
No. of days not swiped/ Total working
days (including OD)
This metric will range from 0 to 1.
Value closer to 0 implies a good
scenario.
4. Swipe Indiscipline
(discounting OD)
No. of days not swiped/ Total working
days (excluding OD)
This metric will range from 0 to 1.
Value closer to 0 implies a good
scenario.
5. Swipe OD discipline No. of OD swiped/Total number of OD This metric will range from 0 to 1.
The closer the metric is to 1, the
better it is.
6. OD indiscipline No. of rejected OD/Total number of
OD
This metric will range from 0 to 1.
Value closer to 0 implies a good
scenario.
7. Regularization Rejected (RR) No. of rejected regularization/Total
no. of regularization requested
This metric will range from 0 to 1.
Value closer to 0 implies a good
scenario.
Metrics definition
8.
- 7 -
Metricsdefinition cont …
S.No. Metric Definition Interpretation
8. Leave Discipline Total no. of leave accounted/ Total
absent days
This metric will range from 0 to 1. The
closer the metric is to 1, the better it is.
9. Leave affinity Total days of leave taken/Frequency
of leave
This metric defines the no. of leaves per
installment.
10. Effort Variance (Actual hours worked-Ideal hours to
be worked) / Ideal hours to be
worked
A positive value of the metric indicates
over productivity. A negative value
indicates under productivity.
11. Attrition No of people leaving the
organization/Total count
An organization would always wish
attrition to be close to Zero
12 Forming No of people leaving the organization
with in 20 days/Total count
Forming cost – A metric that qualifies
these severity of an employee leaving
with in 20 days
Norming No of people leaving the organization
with in 90 days/Total count
Norming cost – A metric that qualifies
the situation where in the employee
leaving between the period 20 days - 90
days
Performing No of people leaving the organization
after 90 days/Total count
Performing cost – A metric that qualifies
the situation where in the employee
leaves the organization after 90 days
Attritionchildcosts
9.
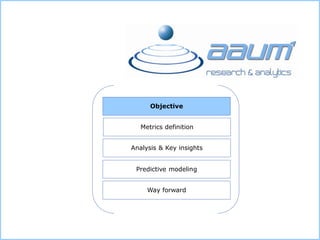
Objective
Metrics definition
Analysis &Key insights
Predictive modeling
Way forward
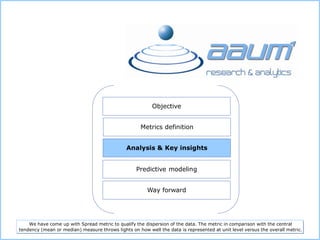
We have come up with Spread metric to qualify the dispersion of the data. The metric in comparison with the central
tendency (mean or median) measure throws lights on how well the data is represented at unit level versus the overall metric.
10.
- 9 -
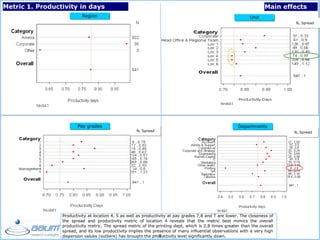
Metric1. Productivity in days
Region Unit
Pay grades Departments
Main effects
N, Spread
N, Spread N, Spread
Productivity at location 4, 5 as well as productivity at pay grades 7,8 and T are lower. The closeness of
the spread and productivity metric of location 4 reveals that the metric best mimics the overall
productivity metric. The spread metric of the printing dept, which is 2.8 times greater than the overall
spread, and its low productivity implies the presence of many influential observations with a very high
dispersion values (outliers) has brought the productivity level significantly down.
11.
- 10 -
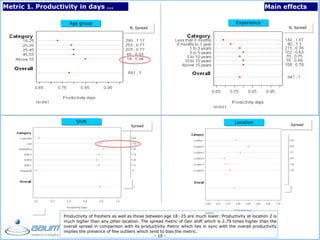
Metric1. Productivity in days … Main effects
Location
Age group Experience
N, Spread N, Spread
Shift
Spread Spread
Location
Productivity of freshers as well as those between age 18 -25 are much lower. Productivity at location 2 is
much higher than any other location. The spread metric of Gen shift which is 2.79 times higher than the
overall spread in comparison with its productivity metric which lies in sync with the overall productivity
implies the presence of few outliers which tend to bias the metric.
.
12.
- 11 -
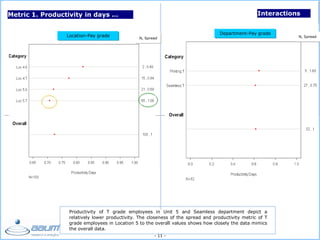
Metric1. Productivity in days … Interactions
Location-Pay grade
Department-Pay grade
Productivity of T grade employees in Unit 5 and Seamless department depict a
relatively lower productivity. The closeness of the spread and productivity metric of T
grade employees in Location 5 to the overall values shows how closely the data mimics
the overall data.
.
N, Spread N, Spread
13.
- 12 -
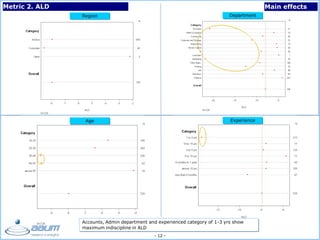
Metric2. ALD Main effects
Region Department
Age Experience
Accounts, Admin department and experienced category of 1-3 yrs show
maximum indiscipline in ALD
14.
- 13 -
Metric2. ALD Main effects
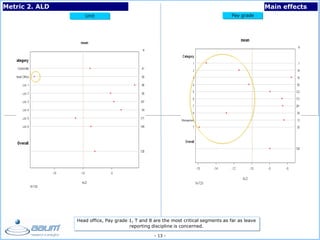
Unit Pay grade
Head office, Pay grade 1, T and 8 are the most critical segments as far as leave
reporting discipline is concerned.
15.
- 14 -
Metric2. ALD
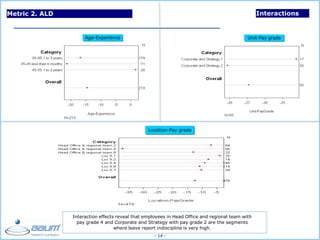
Age-Experience Unit-Pay grade
Location-Pay grade
Interaction effects reveal that employees in Head Office and regional team with
pay grade 4 and Corporate and Strategy with pay grade 2 are the segments
where leave report indiscipline is very high.
Location-Pay grade
Interactions
16.
- 15 -
SwipeIndiscipline (including OD)
Swipe Indiscipline (including OD)
Swipe Indiscipline (including OD)
Swipe Indiscipline (including OD)
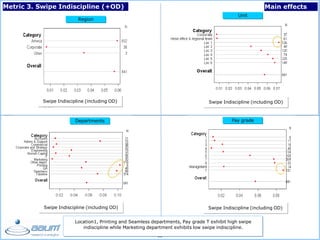
Region
Departments Pay grade
Metric 3. Swipe Indiscipline (+OD)
Unit
Main effects
Location1, Printing and Seamless departments, Pay grade T exhibit high swipe
indiscipline while Marketing department exhibits low swipe indiscipline.
17.
- 16 -
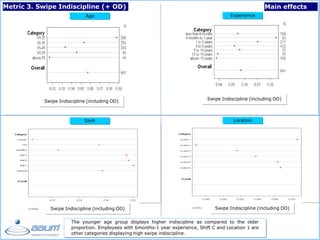
ShiftLocation
Age Experience
Metric 3. Swipe Indiscipline (+ OD) Main effects
Swipe Indiscipline (including OD)
Swipe Indiscipline (including OD)
Swipe Indiscipline (including OD) Swipe Indiscipline (including OD)
The younger age group displays higher indiscipline as compared to the older
proportion. Employees with 6months-1 year experience, Shift C and Location 1 are
other categories displaying high swipe indiscipline.
18.
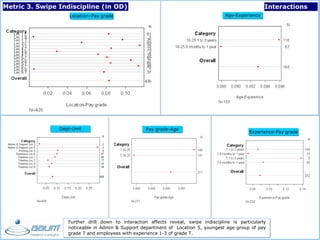
- 17 -
Metric3. Swipe Indiscipline (in OD)
Location–Pay grade
Dept-Unit
Experience-Pay grade
Age-Experience
Interactions
Pay grade-Age
Further drill down to interaction effects reveal, swipe indiscipline is particularly
noticeable in Admin & Support department of Location 5, youngest age group of pay
grade 7 and employees with experience 1-3 of grade T.
19.
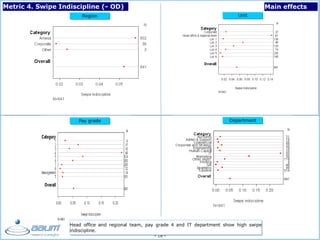
- 18 -
Region
Paygrade Department
Unit
Metric 4. Swipe Indiscipline (- OD) Main effects
Head office and regional team, pay grade 4 and IT department show high swipe
indiscipline.
20.
- 19 -
Age
ShiftLocation
Experience
Main effectsMetric 4. Swipe Indiscipline (- OD)
The middle age group of 25-45, employees with experience ranging from 6months to 3
years, Headoffice shift and employees belonging to Location 2 depict high swipe indiscipline.
21.
- 20 -
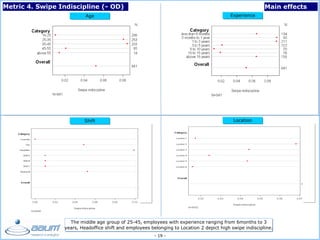
Unit-Paygrade
Age-Pay grade Age-Location
Dept-Pay grade
Metric 4. Swipe Indiscipline (- OD) Interactions
However interaction effects reveal that Head office and regional team employees of pay
grade 4, IT department employees with pay grade 5, middle aged proportion with pay grade
4 and experience of 1-3 years are the critical categories in terms of high swipe indiscipline.
22.
- 21 -
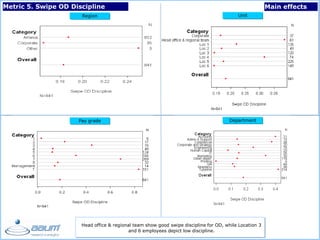
Region
Paygrade Department
Metric 5. Swipe OD Discipline
Head office & regional team show good swipe discipline for OD, while Location 3
and 6 employees depict low discipline.
Main effects
Unit
23.
- 22 -
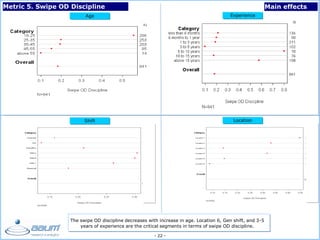
Age
ShiftLocation
Experience
Metric 5. Swipe OD Discipline Main effects
The swipe OD discipline decreases with increase in age. Location 6, Gen shift, and 3-5
years of experience are the critical segments in terms of swipe OD discipline.
24.
- 23 -
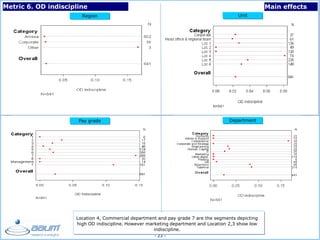
Region
Paygrade Department
Unit
Metric 6. OD indiscipline Main effects
Location 4, Commercial department and pay grade 7 are the segments depicting
high OD indiscipline. However marketing department and Location 2,3 show low
indiscipline.
25.
- 24 -
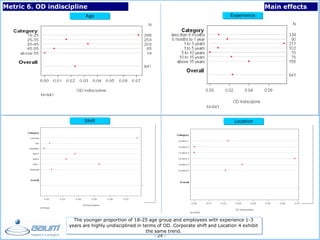
Age
ShiftLocation
Experience
Metric 6. OD indiscipline Main effects
The younger proportion of 18-25 age group and employees with experience 1-3
years are highly undisciplined in terms of OD. Corporate shift and Location 4 exhibit
the same trend.
26.
- 25 -
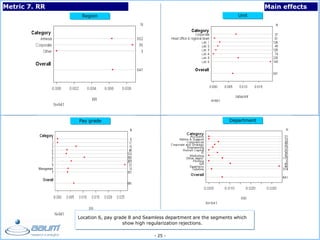
Region
Paygrade Department
Unit
Metric 7. RR Main effects
Location 6, pay grade 8 and Seamless department are the segments which
show high regularization rejections.
27.
- 26 -
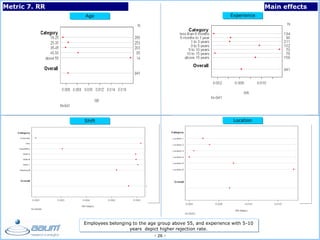
Age
ShiftLocation
Experience
Metric 7. RR Main effects
Employees belonging to the age group above 55, and experience with 5-10
years depict higher rejection rate.
28.
- 27 -
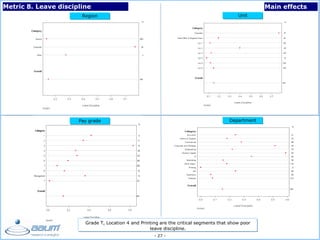
Metric8. Leave discipline Main effects
Region
Pay grade Department
Unit
Grade T, Location 4 and Printing are the critical segments that show poor
leave discipline.
29.
- 28 -
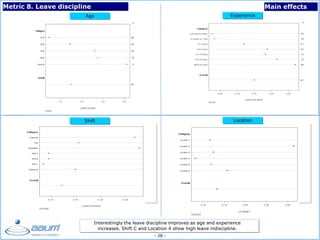
Metric8. Leave discipline Main effects
Age
Shift Location
Experience
Interestingly the leave discipline improves as age and experience
increases. Shift C and Location 4 show high leave indiscipline.
30.
- 29 -
Unit-Paygrade
Experience-Age Experience-Pay grade
Dept-Pay grade
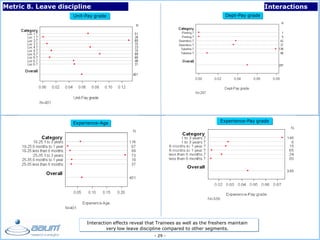
Metric 8. Leave discipline Interactions
Interaction effects reveal that Trainees as well as the freshers maintain
very low leave discipline compared to other segments.
31.
- 30 -
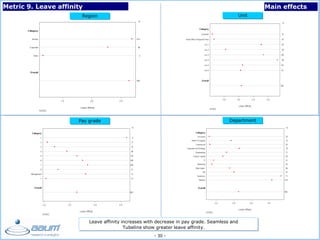
Metric9. Leave affinity Main effects
Region
Pay grade Department
Unit
Leave affinity increases with decrease in pay grade. Seamless and
Tubeline show greater leave affinity.
32.
- 31 -
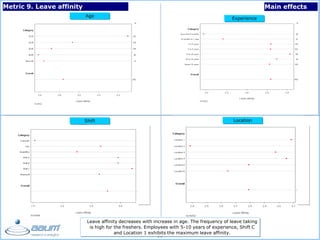
Metric9. Leave affinity Main effects
Age
Shift Location
Experience
Leave affinity decreases with increase in age. The frequency of leave taking
is high for the freshers. Employees with 5-10 years of experience, Shift C
and Location 1 exhibits the maximum leave affinity.
33.
- 32 -
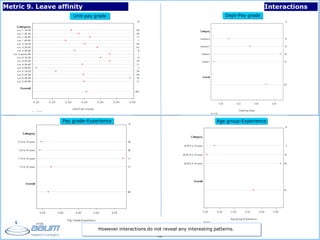
Metric9. Leave affinity Interactions
Unit-pay grade
Pay grade-Experience Age group-Experience
Dept-Pay grade
However interactions do not reveal any interesting patterns.
34.
- 33 -
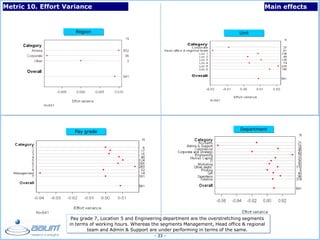
Metric10. Effort Variance Main effects
Region
Pay grade
Department
Unit
Pay grade 7, Location 5 and Engineering department are the overstretching segments
in terms of working hours. Whereas the segments Management, Head office & regional
team and Admin & Support are under performing in terms of the same.
35.
- 34 -
Metric10. Effort Variance Main effects
Age
Shift Location
Experience
The Effort Variance increases with increase in Age and when the experience is over 3
years. The critical segment here is the HeadOffice that shows a negative Effort
Variance
36.
- 35 -
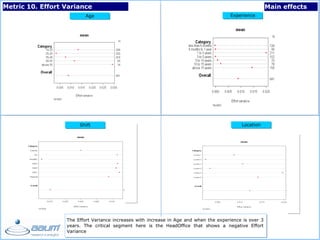
Interactions
Admin& Support department of the Head office and regional team depict very low
effort variance as compared to the other segments. However tying productivity and
effort variance together, it was noticed that the departments of Printing and Seamless
which exhibited low productivity in terms of days has actually overstretched
themselves to arrive at positive effort variance implying that these departments are
not actually underperforming.
Metric 10. Effort Variance
Unit-Dept Productivity Categorized
37.
- 36 -
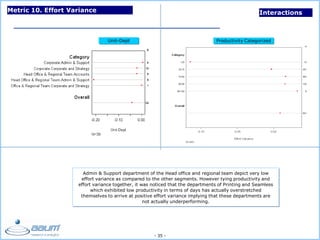
Metric11. Attrition Main effects
Region
Pay grade Department
Unit
Shift
Location 6, Pay grade 7 and Departments Laminator and
Printing show very high attrition rate.
38.
- 37 -
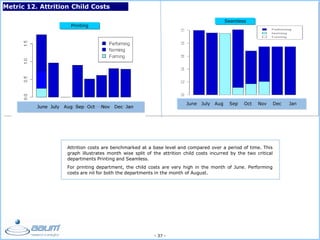
Metric12. Attrition Child Costs
June July Aug Sep Oct Nov Dec Jan
June July Aug Sep Oct Nov Dec Jan
Printing
Seamless
Attrition costs are benchmarked at a base level and compared over a period of time. This
graph illustrates month wise split of the attrition child costs incurred by the two critical
departments Printing and Seamless.
For printing department, the child costs are very high in the month of June. Performing
costs are nil for both the departments in the month of August.
- 39 -
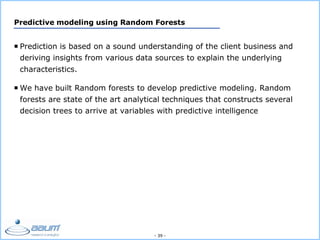
Predictivemodeling using Random Forests
Prediction is based on a sound understanding of the client business and
deriving insights from various data sources to explain the underlying
characteristics.
We have built Random forests to develop predictive modeling. Random
forests are state of the art analytical techniques that constructs several
decision trees to arrive at variables with predictive intelligence
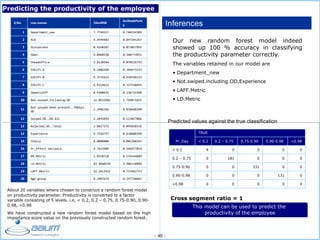
41.
- 40 -
Pr_Day
TRUE
<0.2 0.2 – 0.75 0.75-0.90 0.90-0.98 >0.98
< 0.2 4 0 0 0 0
0.2 – 0.75 0 181 0 0 0
0.75-0.90 0 0 331 0 0
0.90-0.98 0 0 0 131 0
>0.98 0 0 0 0 4
S,No. row.names %IncMSE
IncNodePurit
y
1 Department_new 7.7744527 0.784334305
2 ALD 9.4599482 0.897245267
3 SCorporate 0.4160107 0.073057995
4 SGen 9.0660538 0.340773951
5 SHeadoffice 3.8128584 0.070116793
6 SShift.A 9.1486368 0.346673313
7 SShift.B 9.3715632 0.410356133
8 SShift.C 6.9114632 0.337520495
9 SWeeklyOff 0.9108635 0.136731588
10 Not.swiped.including.OD 22.0522982 1.769871655
11
Not.swiped.when.present..TWDays.
OD
1.2986346 0.038448390
12 Swiped.OD..OD.All 2.2035039 0.123827886
13 Rejected.OD..Total 2.8027272 0.095028156
14 Experience 9.7536757 0.638688390
15 Status 0.0000000 0.002368345
16 Pr_Effort.Variance 9.7623909 0.546977854
17 RR.Metric 2.8510718 0.154144889
18 LD.Metric 42.9440334 3.486118889
19 LAFF.Metric 12.2612422 0.715462753
20 Age.group 8.2907674 0.297730402
Predicted values against the true classification
Predicting the productivity of the employee
About 20 variables where chosen to construct a random forest model
on productivity parameter. Productivity is converted to a factor
variable consisting of 5 levels. i.e. < 0.2, 0.2 – 0.75, 0.75-0.90, 0.90-
0.98, >0.98
We have constructed a new random forest model based on the high
importance score value on the previously constructed random forest.
Cross segment ratio = 1
Inferences
Our new random forest model indeed
showed up 100 % accuracy in classifying
the productivity parameter correctly.
The variables retained in our model are
• Department_new
• Not.swiped.including.OD,Experience
• LAFF.Metric
• LD.Metric
This model can be used to predict the
productivity of the employee
42.
- 41 -
Predictivemodeling …
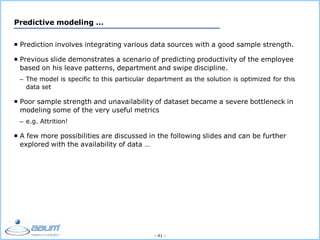
Prediction involves integrating various data sources with a good sample strength.
Previous slide demonstrates a scenario of predicting productivity of the employee
based on his leave patterns, department and swipe discipline.
– The model is specific to this particular department as the solution is optimized for this
data set
Poor sample strength and unavailability of dataset became a severe bottleneck in
modeling some of the very useful metrics
– e.g. Attrition!
A few more possibilities are discussed in the following slides and can be further
explored with the availability of data …
43.
- 42 -
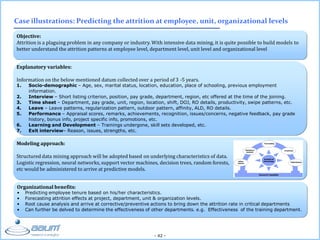
Objective:
Attritionis a plaguing problem in any company or industry. With intensive data mining, it is quite possible to build models to
better understand the attrition patterns at employee level, department level, unit level and organizational level
Case illustrations: Predicting the attrition at employee, unit, organizational levels
Explanatory variables:
Information on the below mentioned datum collected over a period of 3 -5 years.
1. Socio-demographic – Age, sex, marital status, location, education, place of schooling, previous employment
information.
2. Interview – Short listing criterion, position, pay grade, department, region, etc offered at the time of the joining.
3. Time sheet – Department, pay grade, unit, region, location, shift, DOJ, RO details, productivity, swipe patterns, etc.
4. Leave – Leave patterns, regularization pattern, outdoor pattern, affinity, ALD, RO details.
5. Performance – Appraisal scores, remarks, achievements, recognition, issues/concerns, negative feedback, pay grade
history, bonus info, project specific info, promotions, etc.
6. Learning and Development – Trainings undergone, skill sets developed, etc.
7. Exit interview– Reason, issues, strengths, etc.
Organizational benefits:
• Predicting employee tenure based on his/her characteristics.
• Forecasting attrition effects at project, department, unit & organization levels.
• Root cause analysis and arrive at corrective/preventive actions to bring down the attrition rate in critical departments
• Can further be delved to determine the effectiveness of other departments. e.g. Effectiveness of the training department.
Modeling approach:
Structured data mining approach will be adopted based on underlying characteristics of data.
Logistic regression, neural networks, support vector machines, decision trees, random forests,
etc would be administered to arrive at predictive models.
44.
- 43 -
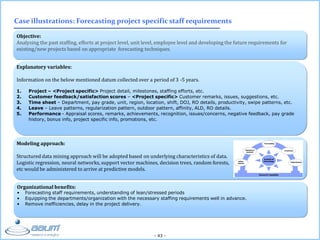
Objective:
Analyzingthe past staffing, efforts at project level, unit level, employee level and developing the future requirements for
existing/new projects based on appropriate forecasting techniques.
Case illustrations: Forecasting project specific staff requirements
Explanatory variables:
Information on the below mentioned datum collected over a period of 3 -5 years.
1. Project – <Project specific> Project detail, milestones, staffing efforts, etc.
2. Customer feedback/satisfaction scores – <Project specific> Customer remarks, issues, suggestions, etc.
3. Time sheet – Department, pay grade, unit, region, location, shift, DOJ, RO details, productivity, swipe patterns, etc.
4. Leave – Leave patterns, regularization pattern, outdoor pattern, affinity, ALD, RO details.
5. Performance - Appraisal scores, remarks, achievements, recognition, issues/concerns, negative feedback, pay grade
history, bonus info, project specific info, promotions, etc.
Organizational benefits:
• Forecasting staff requirements, understanding of lean/stressed periods
• Equipping the departments/organization with the necessary staffing requirements well in advance.
• Remove inefficiencies, delay in the project delivery.
Modeling approach:
Structured data mining approach will be adopted based on underlying characteristics of data.
Logistic regression, neural networks, support vector machines, decision trees, random forests,
etc would be administered to arrive at predictive models.
45.
- 44 -
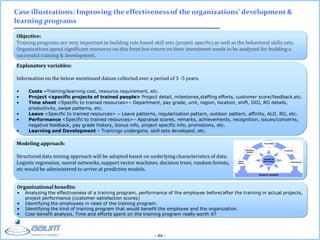
Objective:
Trainingprograms are very important in building role based skill sets (project specific) as well as the behavioral skills sets.
Organizations spend significant resources on this front but return on their investment needs to be analyzed for building a
successful training & development.
Case illustrations: Improving the effectiveness of the organizations’ development &
learning programs
Explanatory variables:
Information on the below mentioned datum collected over a period of 3 -5 years.
• Costs –Training/learning cost, resource requirement, etc.
• Project <specific projects of trained people> Project detail, milestones,staffing efforts, customer score/feedback,etc.
• Time sheet <Specific to trained resources>– Department, pay grade, unit, region, location, shift, DOJ, RO details,
productivity, swipe patterns, etc.
• Leave <Specific to trained resources> – Leave patterns, regularization pattern, outdoor pattern, affinity, ALD, RO, etc.
• Performance <Specific to trained resources>– Appraisal scores, remarks, achievements, recognition, issues/concerns,
negative feedback, pay grade history, bonus info, project specific info, promotions, etc.
• Learning and Development – Trainings undergone, skill sets developed, etc.
Organizational benefits:
• Analyzing the effectiveness of a training program, performance of the employee before/after the training in actual projects,
project performance (customer satisfaction scores)
• Identifying the employees in need of the training program.
• Identifying the kind of training program that would benefit the employee and the organization.
• Cost-benefit analysis. Time and efforts spent on the training program really worth it?
Modeling approach:
Structured data mining approach will be adopted based on underlying characteristics of data.
Logistic regression, neural networks, support vector machines, decision trees, random forests,
etc would be administered to arrive at predictive models.
46.
- 45 -
Objective:
Profilingof candidates to suit the specific roles and requirements of the organization with learning's from the past.
Case illustrations: Streamlining the hiring process with learnings’ from the past
Explanatory variables:
Data set covering the below mentioned datum collected over a period of 3 -5 years.
1. Socio-demographic – Age, sex, marital status, location, education, place of schooling, previous employment
information.
2. Interview – Short listing criterion, position, pay grade, department, region, etc offered at the time of the joining.
3. Time sheet – Department, pay grade, unit, region, location, shift, DOJ, RO details, productivity, swipe patterns, etc.
4. Leave – Leave patterns, regularization pattern, outdoor pattern, affinity, ALD, RO details.
5. Performance – Appraisal scores, remarks, achievements, recognition, issues/concerns, negative feedback, pay grade
history, bonus info, project specific info, promotions, etc.
Organizational benefits:
• Identifying if an employee is most suited to his role in the organization.
• Identifying other possible avenues in the organization where his skills would be most suited.
Modeling approach:
Structured data mining approach will be adopted based on underlying characteristics of data.
Logistic regression, neural networks, support vector machines, decision trees, random forests,
etc would be administered to arrive at predictive models.
47.
- 46 -
Questions/Feedback?
Contactus
01 N, 1st floor IIT Madras Research Park, Kanagam road, Chennai – 600113
Tel :` +91 44 66469877, Fax:+91 44 66469877
Email: info@aaumanalytics.com
Twitter: AaumAnalytics, Web: www.aaumanalytics.com
Facebook: http://www.facebook.com/AaumAnalytics
LinkedIn: http://www.linkedin.com/company/aaum-research-and-analytics-iit-madras
Aaum’s office at IIT Madras Research Park
About Aaum
Aaum Research and Analytics founded by IIT Madras alumnus brings in extensive global business experience
working with Fortune 100 companies in North America and Asia Pacific. Incubated at IIT Madras Incubator
ecosystem with a focus on researching and devising the sophisticated analytical techniques to solve the
pressing business needs of corporations ranging from finance, insurance, HR, Health Care, Entertainment,
FMCGs, retail, Telecom.


![The Datafication of HR [WHITE PAPER]](https://cdn.slidesharecdn.com/ss_thumbnails/visier-datafication-of-hr-graduating-from-metrics-to-analytics-150301134203-conversion-gate02-thumbnail.jpg?width=640&height=640&fit=bounds)


