Download to read offline
![Proceedings of the 2nd International Conference on Current Trends in Engineering and Management ICCTEM -2014
INTERNATIONAL JOURNAL OF ELECTRONICS AND
17 – 19, July 2014, Mysore, Karnataka, India
COMMUNICATION ENGINEERING & TECHNOLOGY (IJECET)
ISSN 0976 – 6464(Print)
ISSN 0976 – 6472(Online)
Volume 5, Issue 8, August (2014), pp. 160-170
© IAEME: http://www.iaeme.com/IJECET.asp
Journal Impact Factor (2014): 7.2836 (Calculated by GISI)
www.jifactor.com
IJECET
© I A E M E
EMOTIONAL ANALYSIS AND EVALUATION OF KANNADA SPEECH
DATABASE
Pallavi J1, Geethashree A2, Dr. D J Ravi3
1Student– Master of Technology, ECE, VVCE, Mysore, Karnataka, India
2Asst.Professor– Dept. of ECE, VVCE, Mysore, Karnataka, India
3Professor and HOD– Dept. of ECE, VVCE, Mysore, Karnataka, India
160
ABSTRACT
Emotion is an affective state of consciousness that involves feeling and plays a
significantrole in communication. So it is necessary to analyze and evaluate speech data base to
build an effective emotion recognition system and efficient man machine interface. This paper
presents and discusses development of emotional Kannada speech data base analysis and its
evaluation using Mean opinion score (MOS), PNN and k-NN.
Keywords: K-Neighbouring Numbers (K-NN), Probability Neural Network (PNN), Speech Corpus.
I. INTRODUCTION
Emotion plays an important role in day-to-day interpersonal human interactions. Recent
findings have suggested that emotion is integral to our rational and intelligent decisions. A
successful solution to this challenging problem would enable a wide range of important applications.
Correct assessment of the emotional state of an individual could significantly improve quality of
emerging, natural language based human-computer interfaces [1,3,6]. It helps us to relate with each
other by expressing our feelings and providing feedback.
There have been many studies [3,4,7-10] for emotional speech but it is observed that most of
the studies are for English, Hindi and other languages, there is also a need to study these aspects for
Kannada speech. The investigation of both prosody related features [13] and spectral features for the
evaluation of emotion recognition is necessary 50-500 LPC coefficients as spectral features, whereas
mean value of pitch (F0), intensity, pressure of sound, Power Spectral Density (PSD), pressure, as
prosody related features have been studied. The human capability to recognize the emotion from
speech was also studied and compared with machine classifiers.
This important aspect of human interaction needs to be considered in the design of human–
machine interfaces. Initially a listening test of sample Sentences was done to identify speaker’s](https://image.slidesharecdn.com/emotionalanalysisandevaluationofkannadaspeechdatabase-141110051409-conversion-gate01/75/Emotional-analysis-and-evaluation-of-kannada-speech-database-1-2048.jpg)
![Proceedings of the 2nd International Conference on Current Trends in Engineering and Management ICCTEM -2014
17 – 19, July 2014, Mysore, Karnataka, India
emotion based on auditory impressions and Mean opinion score was collected. Then speaker’s
emotion Identification of sample sentences was done with probabilistic neural network (PNN) and k-neighboring
numbers (KNN) using LPC and subsequently PRAAT software package was used to
extract the Pattern of acoustic parameters for sample sentences [2].
161
II. EMOTIONAL DATABASE
Obtaining emotional corpus is quite difficult in itself. Various methods have been utilized in
the past, like the use of acted speech, the speech obtained from movies or television shows and
speech recorded in event recall [2, 5, 6].
The database is composed of 4 different emotions (happy, sad, anger and fear) and neutral
emotion as uttered by two male Kannada actors, consisting of a total of 60 sentences containing
minimum 3 to maximum 7 words. The first step was to record the voice of each words and sentences.
The recordings of all the words and sentences were done using recording studio. These words and
sentences were recorded at a sample rate of 44100 Hz with a mono channel. The sentences used for
Statistical analysis is listed in table 1.
Table 1: Sentences used in analysis
Sent. KANNADA (English)
S2](https://image.slidesharecdn.com/emotionalanalysisandevaluationofkannadaspeechdatabase-141110051409-conversion-gate01/75/Emotional-analysis-and-evaluation-of-kannada-speech-database-2-2048.jpg)
![(long live like a wind)
S3
!.
( I am blessed ,as I protected the lives of elders)
S5
#$%'( )*+ ,-./0.
(I have fought and Experienced with so many people like you.)
S5
1023!
(Aravinda is my Disciple)
S6
40 0+5 6 78
(I study during night time)
S7
9% : ;10 8=8.
(He might be a Brahmin ,there is no doubt about it)
S8
11?$%@.5A?
(Father, who is that fellow who troubles us?)
III. ANALYSIS
Pitch is strongly correlated with the fundamental frequency of the sound. It occupies a central
place in the study of prosodic attributes as it is the perceived fundamental frequency of the sound [3,
4 8]. It differs from the actual fundamental frequency due to overtones inherent in the sound
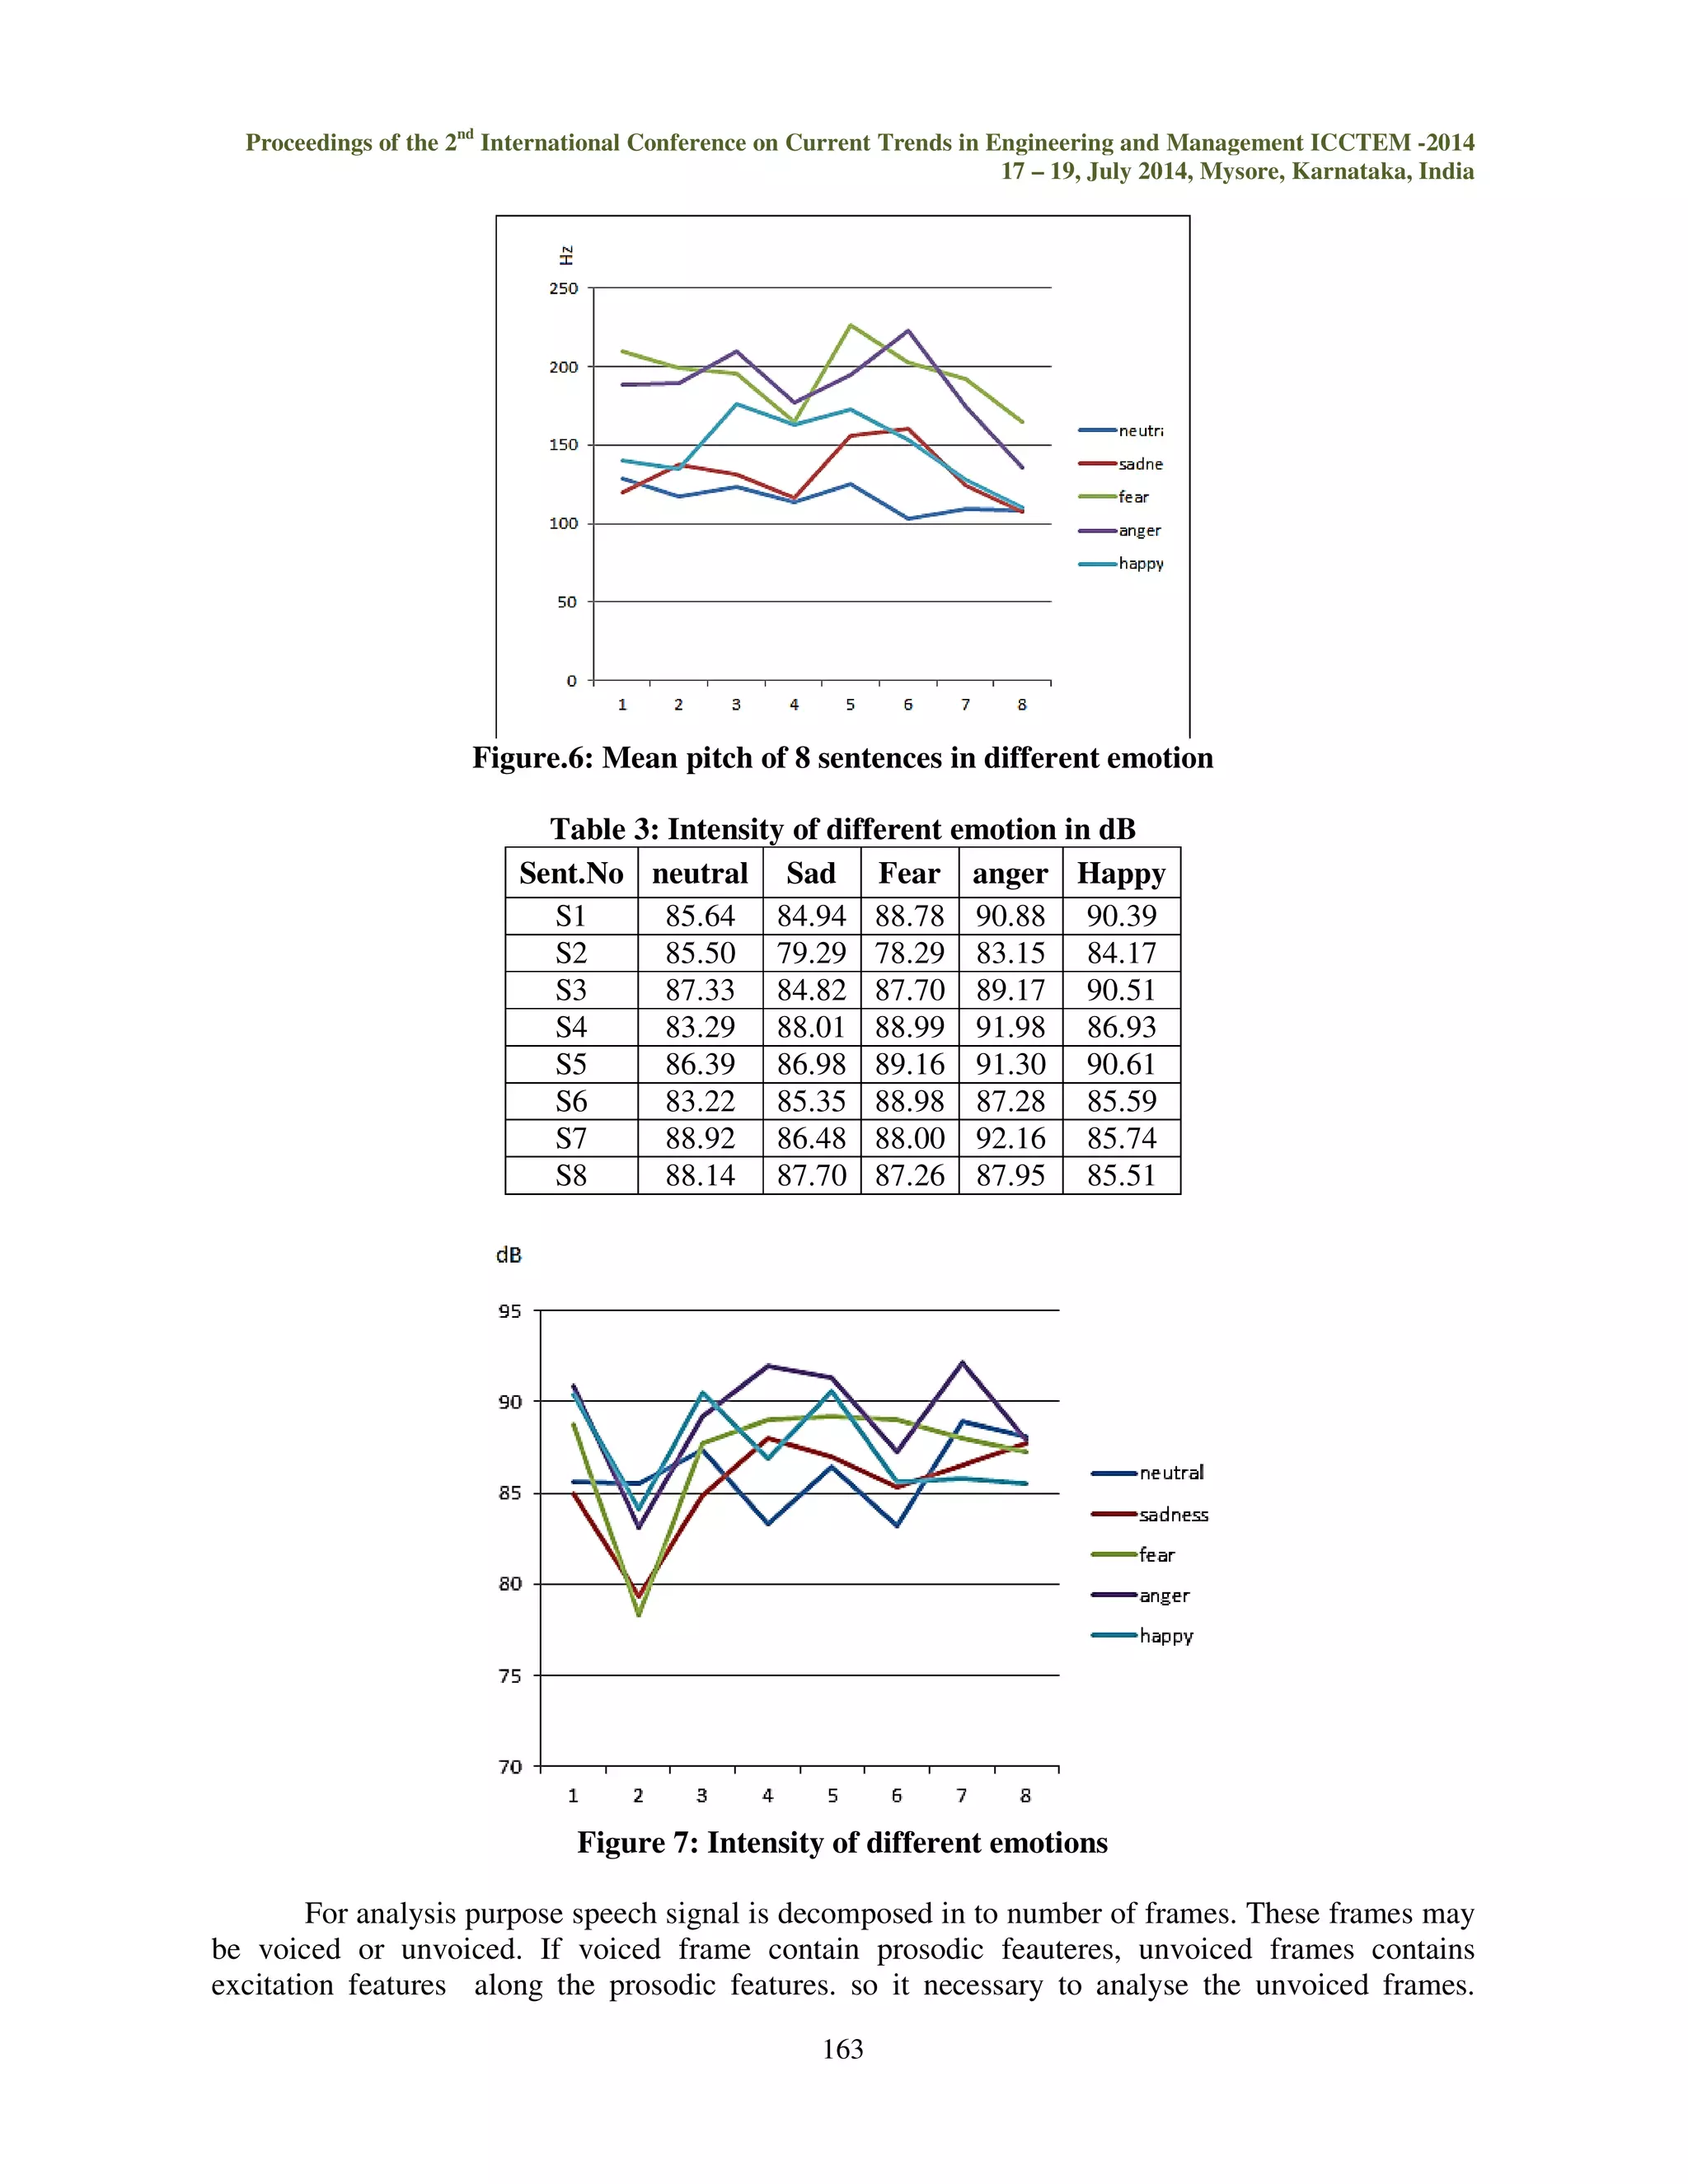
Fig 1 to Fig 5 shows the pitch and intensity of different emotions of Sentence 6. The table 2
shows the mean pitch of the different emotion and Fig.6 shows the variation of mean pitch in
different emotions. It shows that mean pitch is highest in fear and lowest in sadness when compare to
other emotions.](https://image.slidesharecdn.com/emotionalanalysisandevaluationofkannadaspeechdatabase-141110051409-conversion-gate01/75/Emotional-analysis-and-evaluation-of-kannada-speech-database-3-2048.jpg)
![Proceedings of the 2nd International Conference on Current Trends in Engineering and Management ICCTEM -2014
17 – 19, July 2014, Mysore, Karnataka, India
p is the order of the prediction filter polynomial, a = [1,a(2), ... a(p+1)]. If p is unspecified,
LPC uses as a default p = length(x)-1. If x is a matrix containing a separate signal in each column,
LPC returns a model estimate for each column in the rows of matrix and a column vector of
prediction error variances g. The length of p must be less than or equal to the length of x.
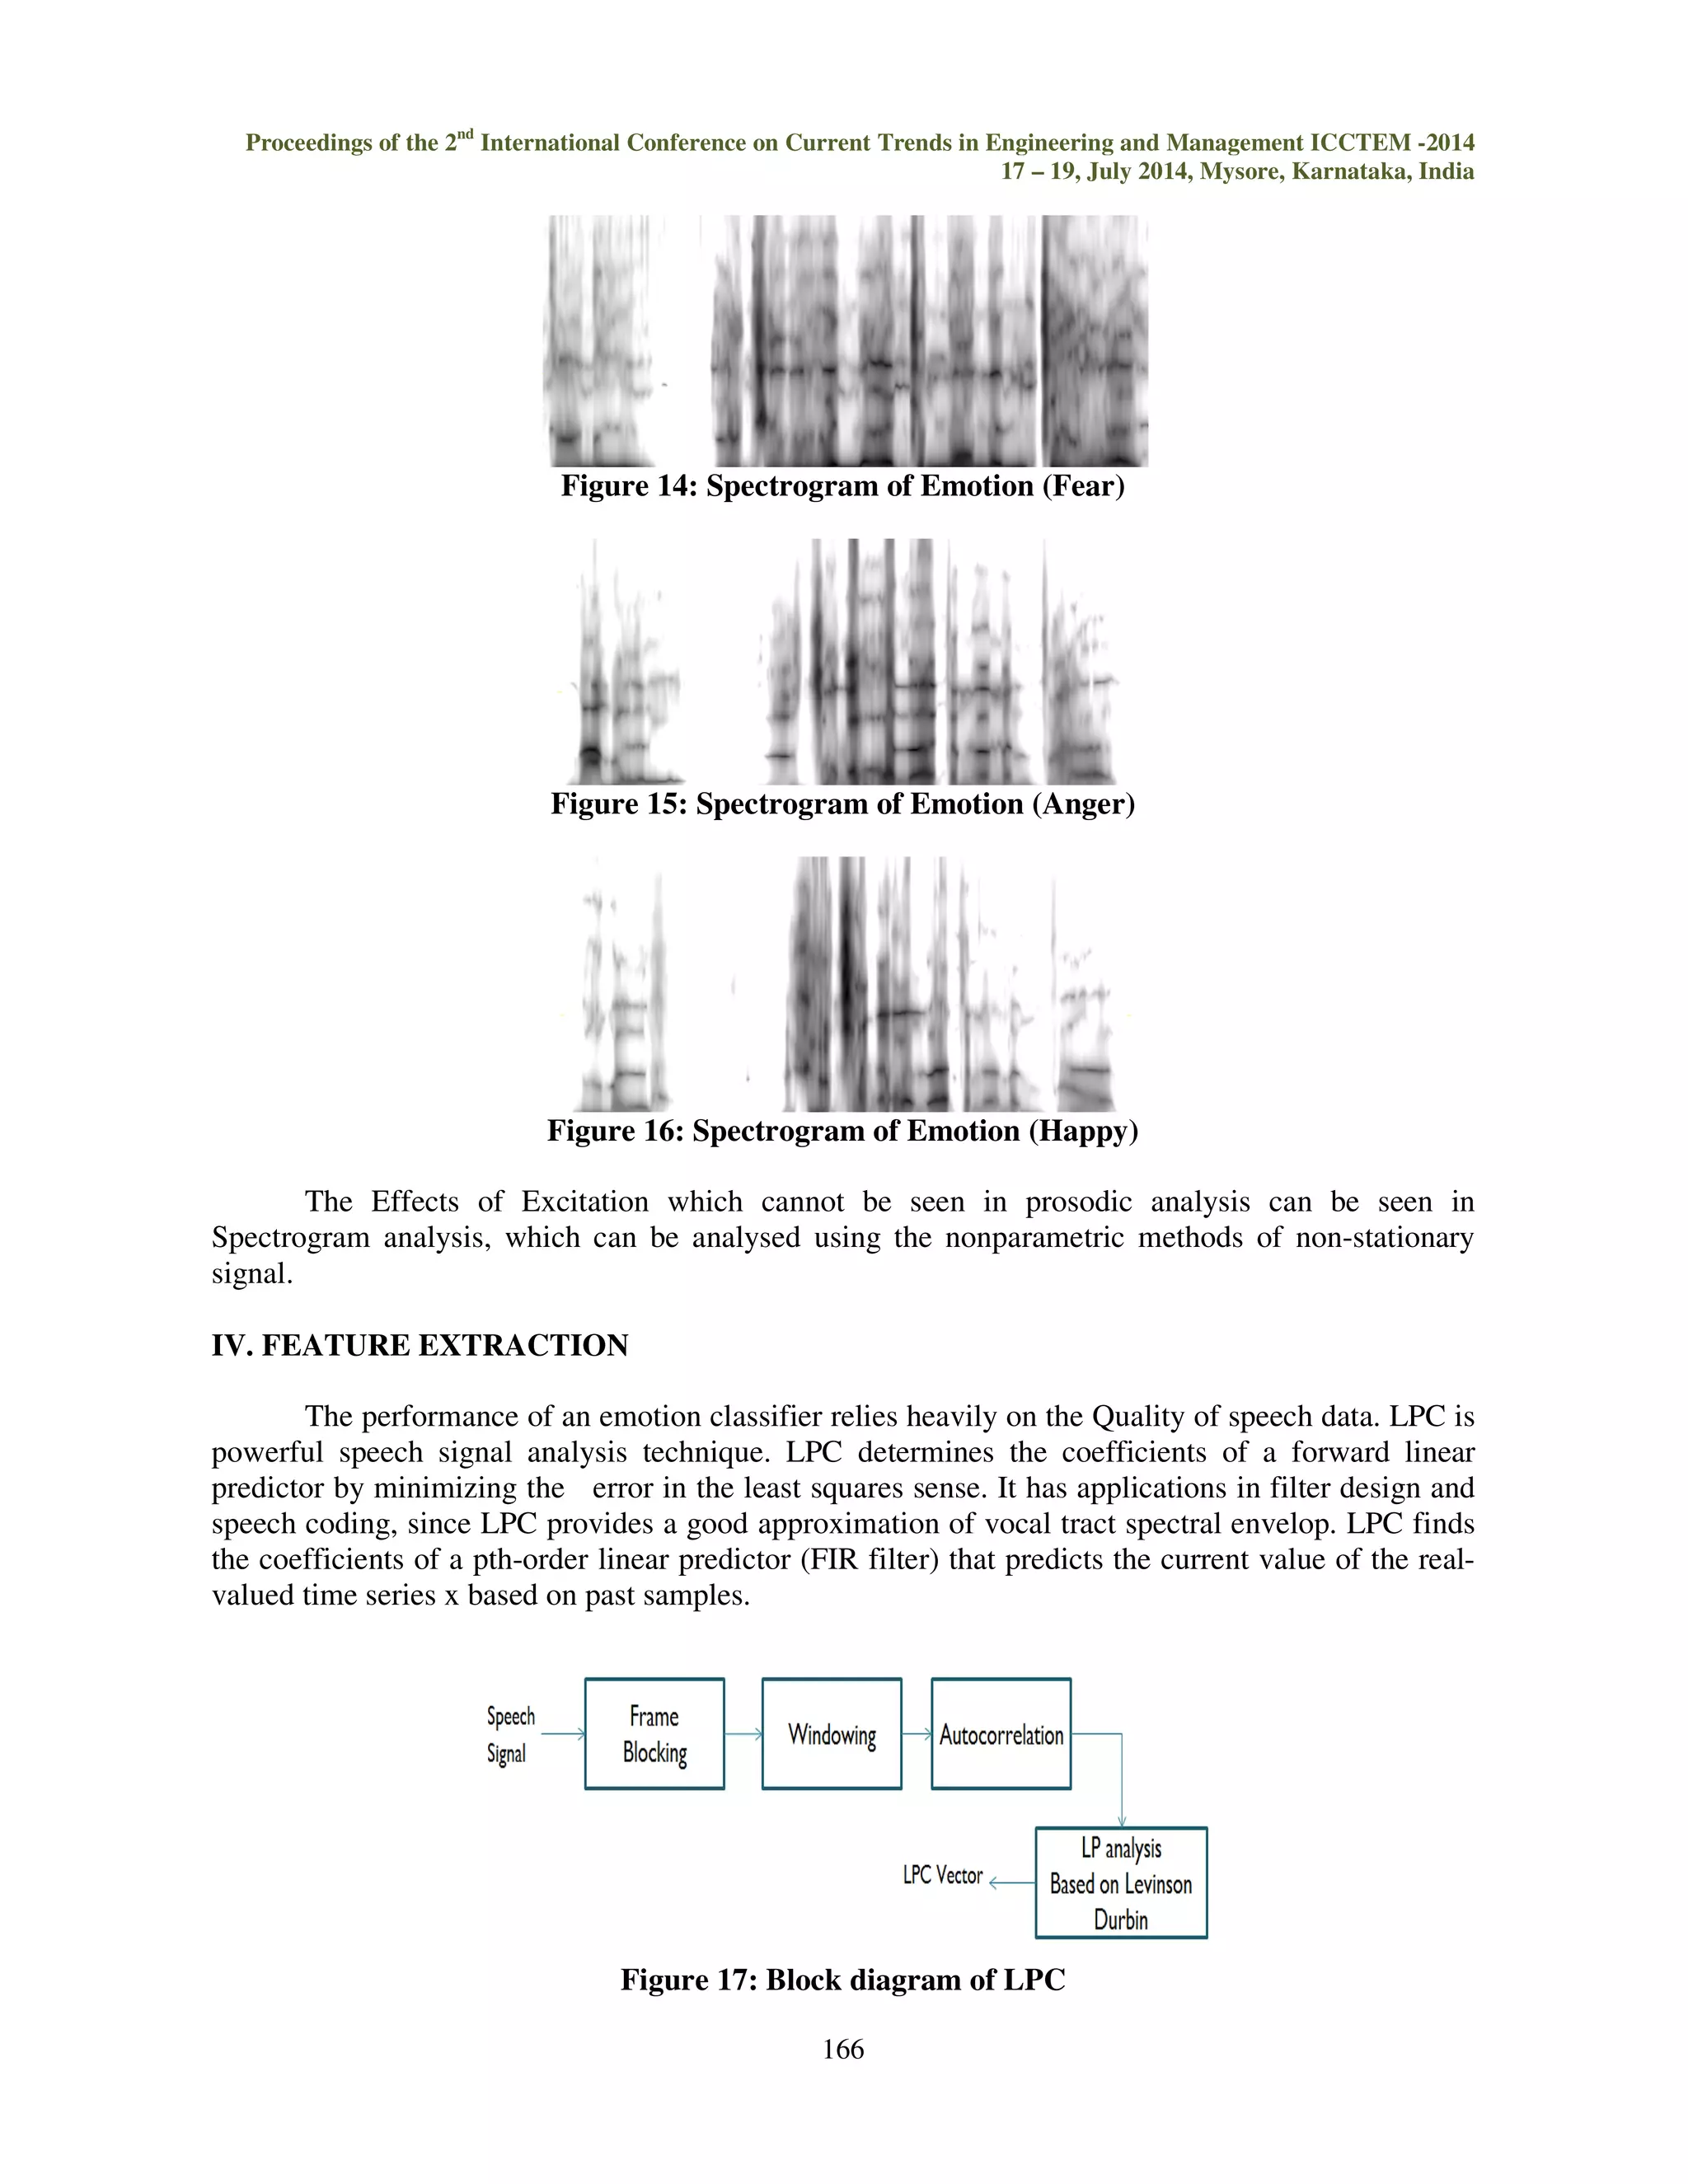
LPC analyses the speech signal by eliminating the formant and speech by estimating the
intensity and frequency of the remaining buzz. The process is called inverse filtering and the
remaining is called the residue. The excitation signal obtained from the LPC analysis is viewed
mostly as error signal, and contains higher order relations. Higher order relations contain strength of
excitation, characteristics of glottal volume velocity waveform, shapes of glottal pulse, variance of
vocal folds.
167
V. EVALUATION
Evaluation is carried in two methods
Evaluation by listener: Perception test is done and Mean Opinion Score is taken, the main objective
of perception test is to validate the recorded voice for recognition of emotion. The perception test
involved 25 people from various backgrounds. Sentences in random order were played to the
listeners and they were asked to identify expression of emotion in the utterances. The listeners were
required to choose the emotion of the recorded voice from a list of 4 emotions along with the neutral
sentences. The MOS was of the test was calculated.
Evaluation by classifier
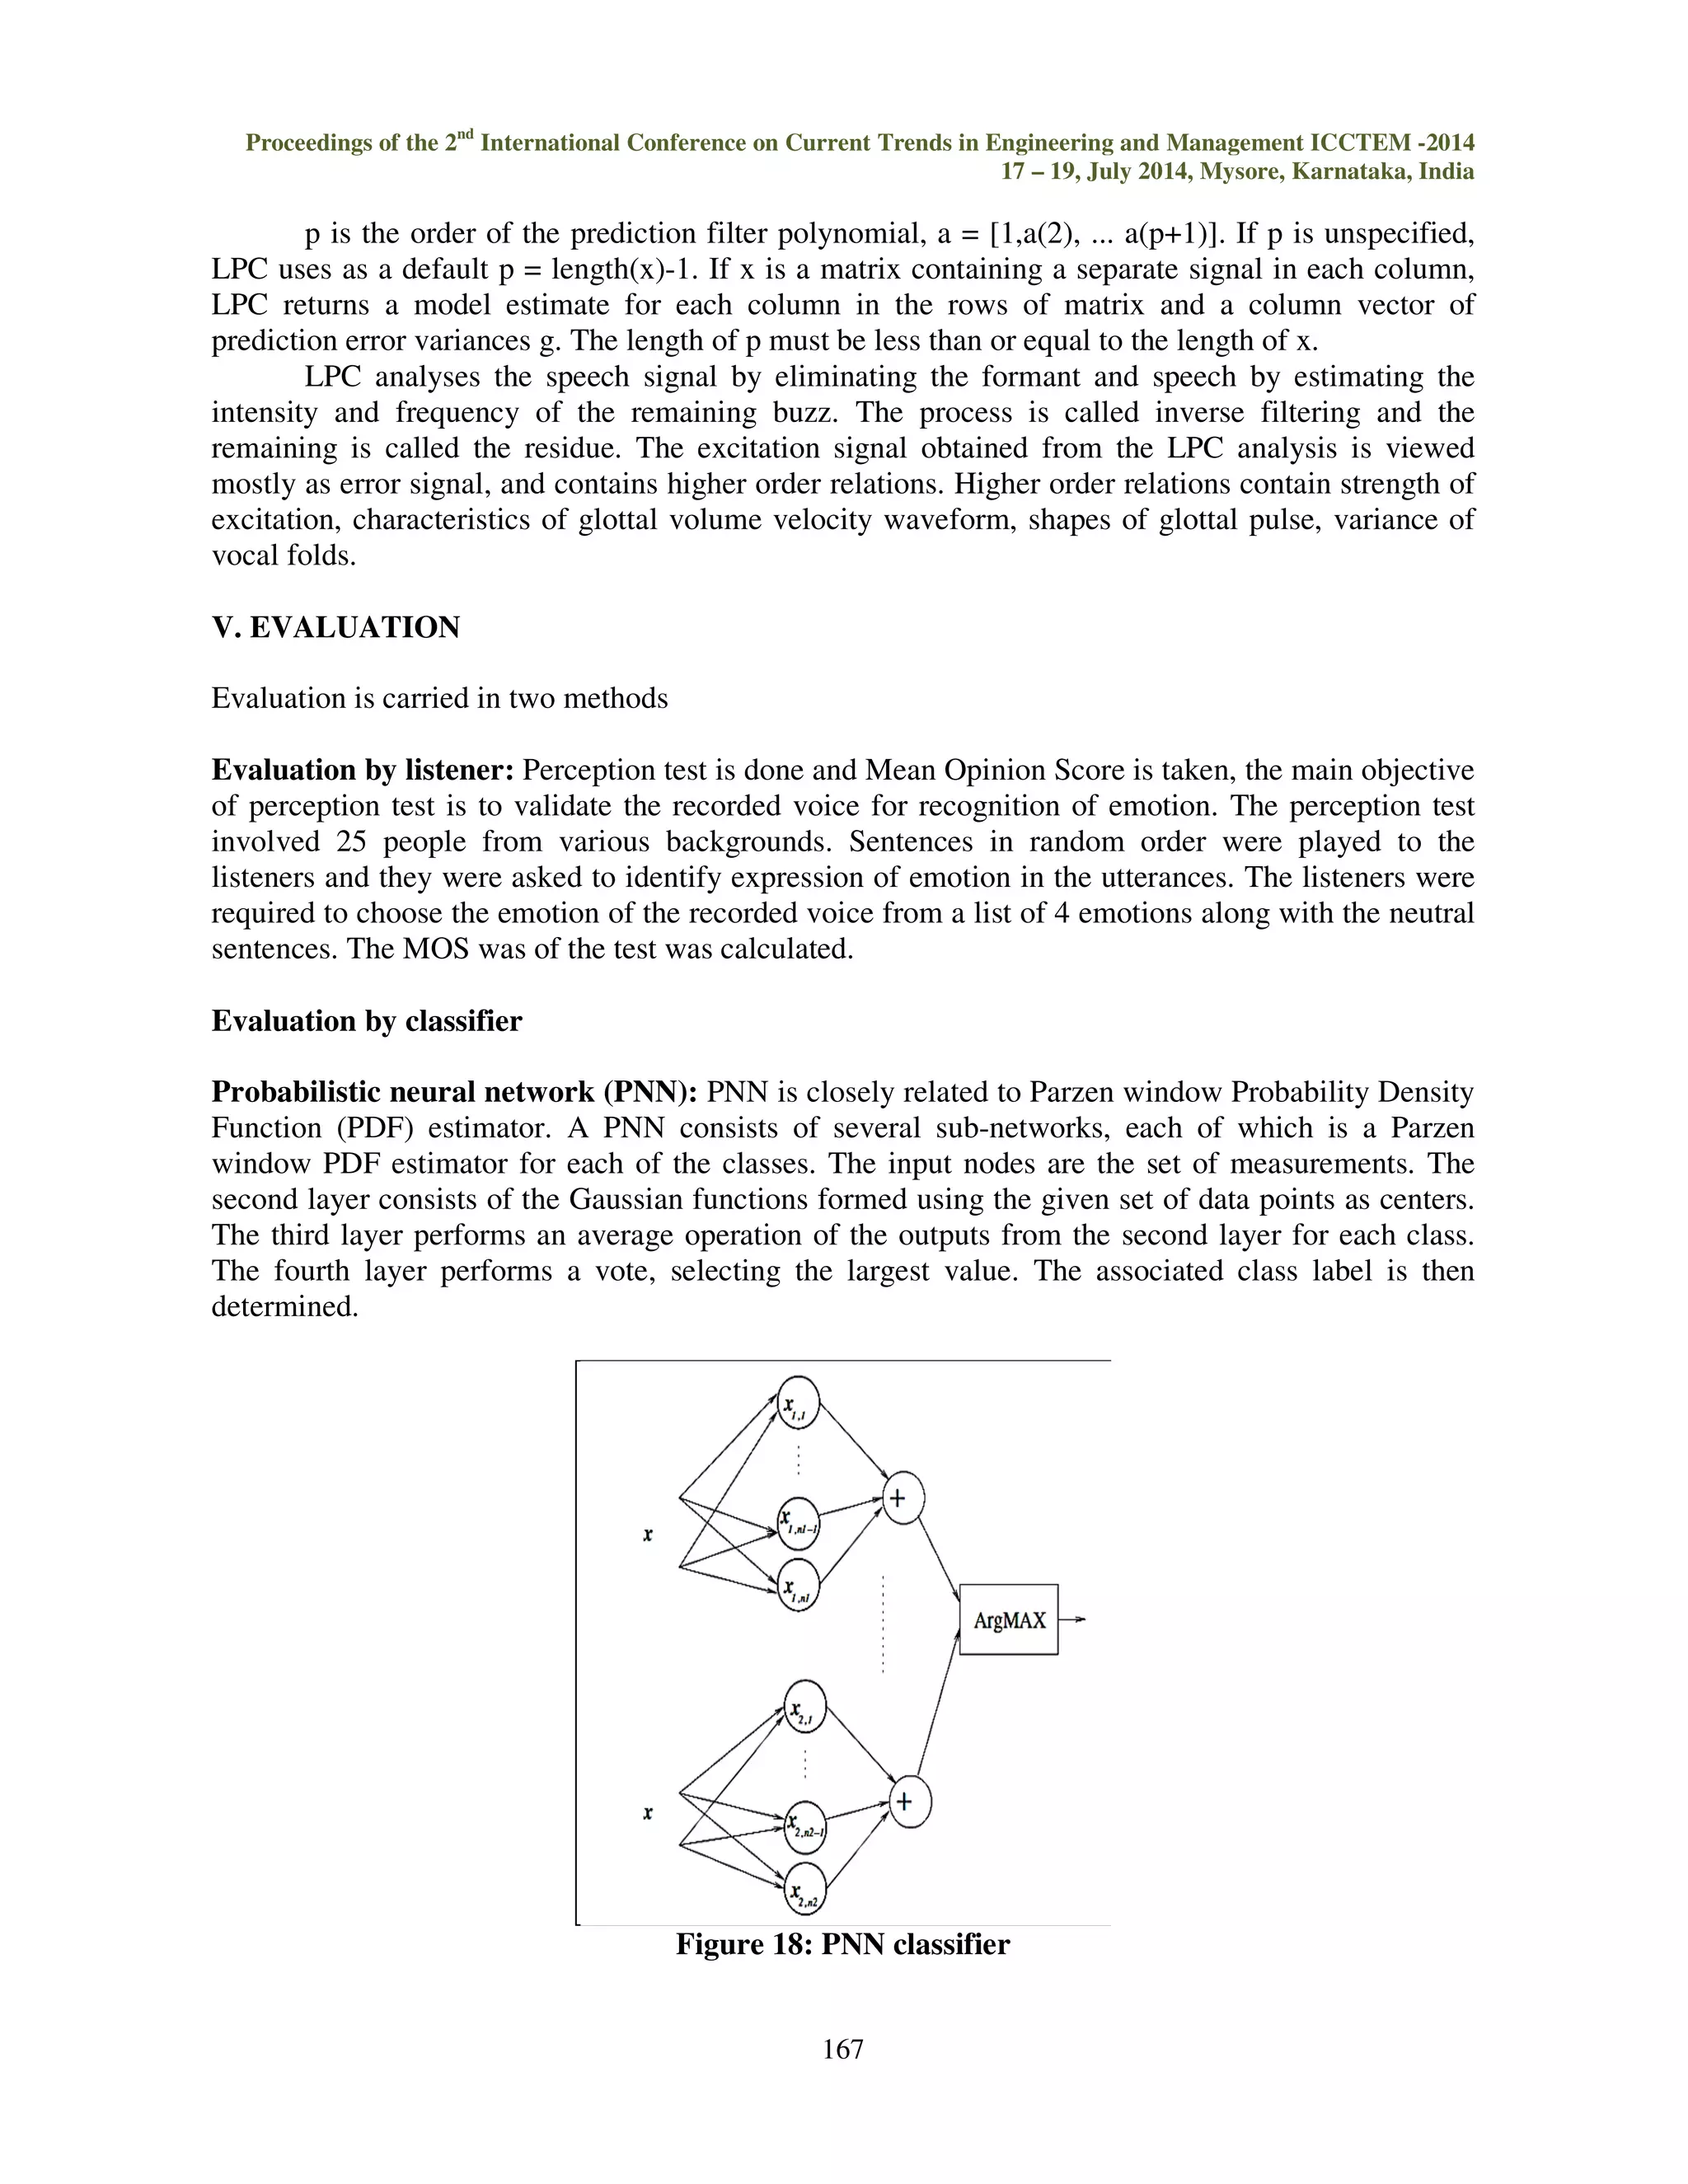
Probabilistic neural network (PNN): PNN is closely related to Parzen window Probability Density
Function (PDF) estimator. A PNN consists of several sub-networks, each of which is a Parzen
window PDF estimator for each of the classes. The input nodes are the set of measurements. The
second layer consists of the Gaussian functions formed using the given set of data points as centers.
The third layer performs an average operation of the outputs from the second layer for each class.
The fourth layer performs a vote, selecting the largest value. The associated class label is then
determined.
Figure 18: PNN classifier](https://image.slidesharecdn.com/emotionalanalysisandevaluationofkannadaspeechdatabase-141110051409-conversion-gate01/75/Emotional-analysis-and-evaluation-of-kannada-speech-database-9-2048.jpg)
![Where nj denotes the number of data points in class j. The PNN assign x into class k if yk(x) yj(x),
j€[1……M], ||x j,i-x||2 is calculated as the sum of Squares
K-Neighboring numbers: In pattern recognition, the k Nearest Neighbors algorithm is a non-parametric
method used for classification. The output depends on value of K in algorithm.
In k-NN classification, the output is a class membership. An object is classified by a majority
vote of its neighbors, with the object being assigned to the class most common among its k nearest
neighbors (k is a positive integer, typically small). If k = 1, then the object is simply assigned to the
class of that single nearest neighbor.
Figure 19: Block diagram of emotion recognition
In k-NN regression, the output is the property value for the object. This value is the average
of the values of its k nearest neighbors. k-NN is a type of instance-based learning, or lazy learning,
where the function is only approximated locally and all computation is deferred until classification.
The k-NN algorithm is among the simplest of all machine learning algorithms.
Both for classification, it can be useful to weight the contributions of the neighbors, so that the nearer
neighbors contribute more to the average than the more distant ones. For example, a common
weighting scheme consists in giving each neighbor a weight of 1/d, where d is the distance to the
neighbor.
The neighbors are taken from a set of objects for which the class (for k-NN classification) or
the object property value (for k-NN regression) is known. This can be thought of as the training set
for the algorithm, though no explicit training step is required.
VI. RESULTS AND DISCUSSION
EVALUSTION OF EMOTION
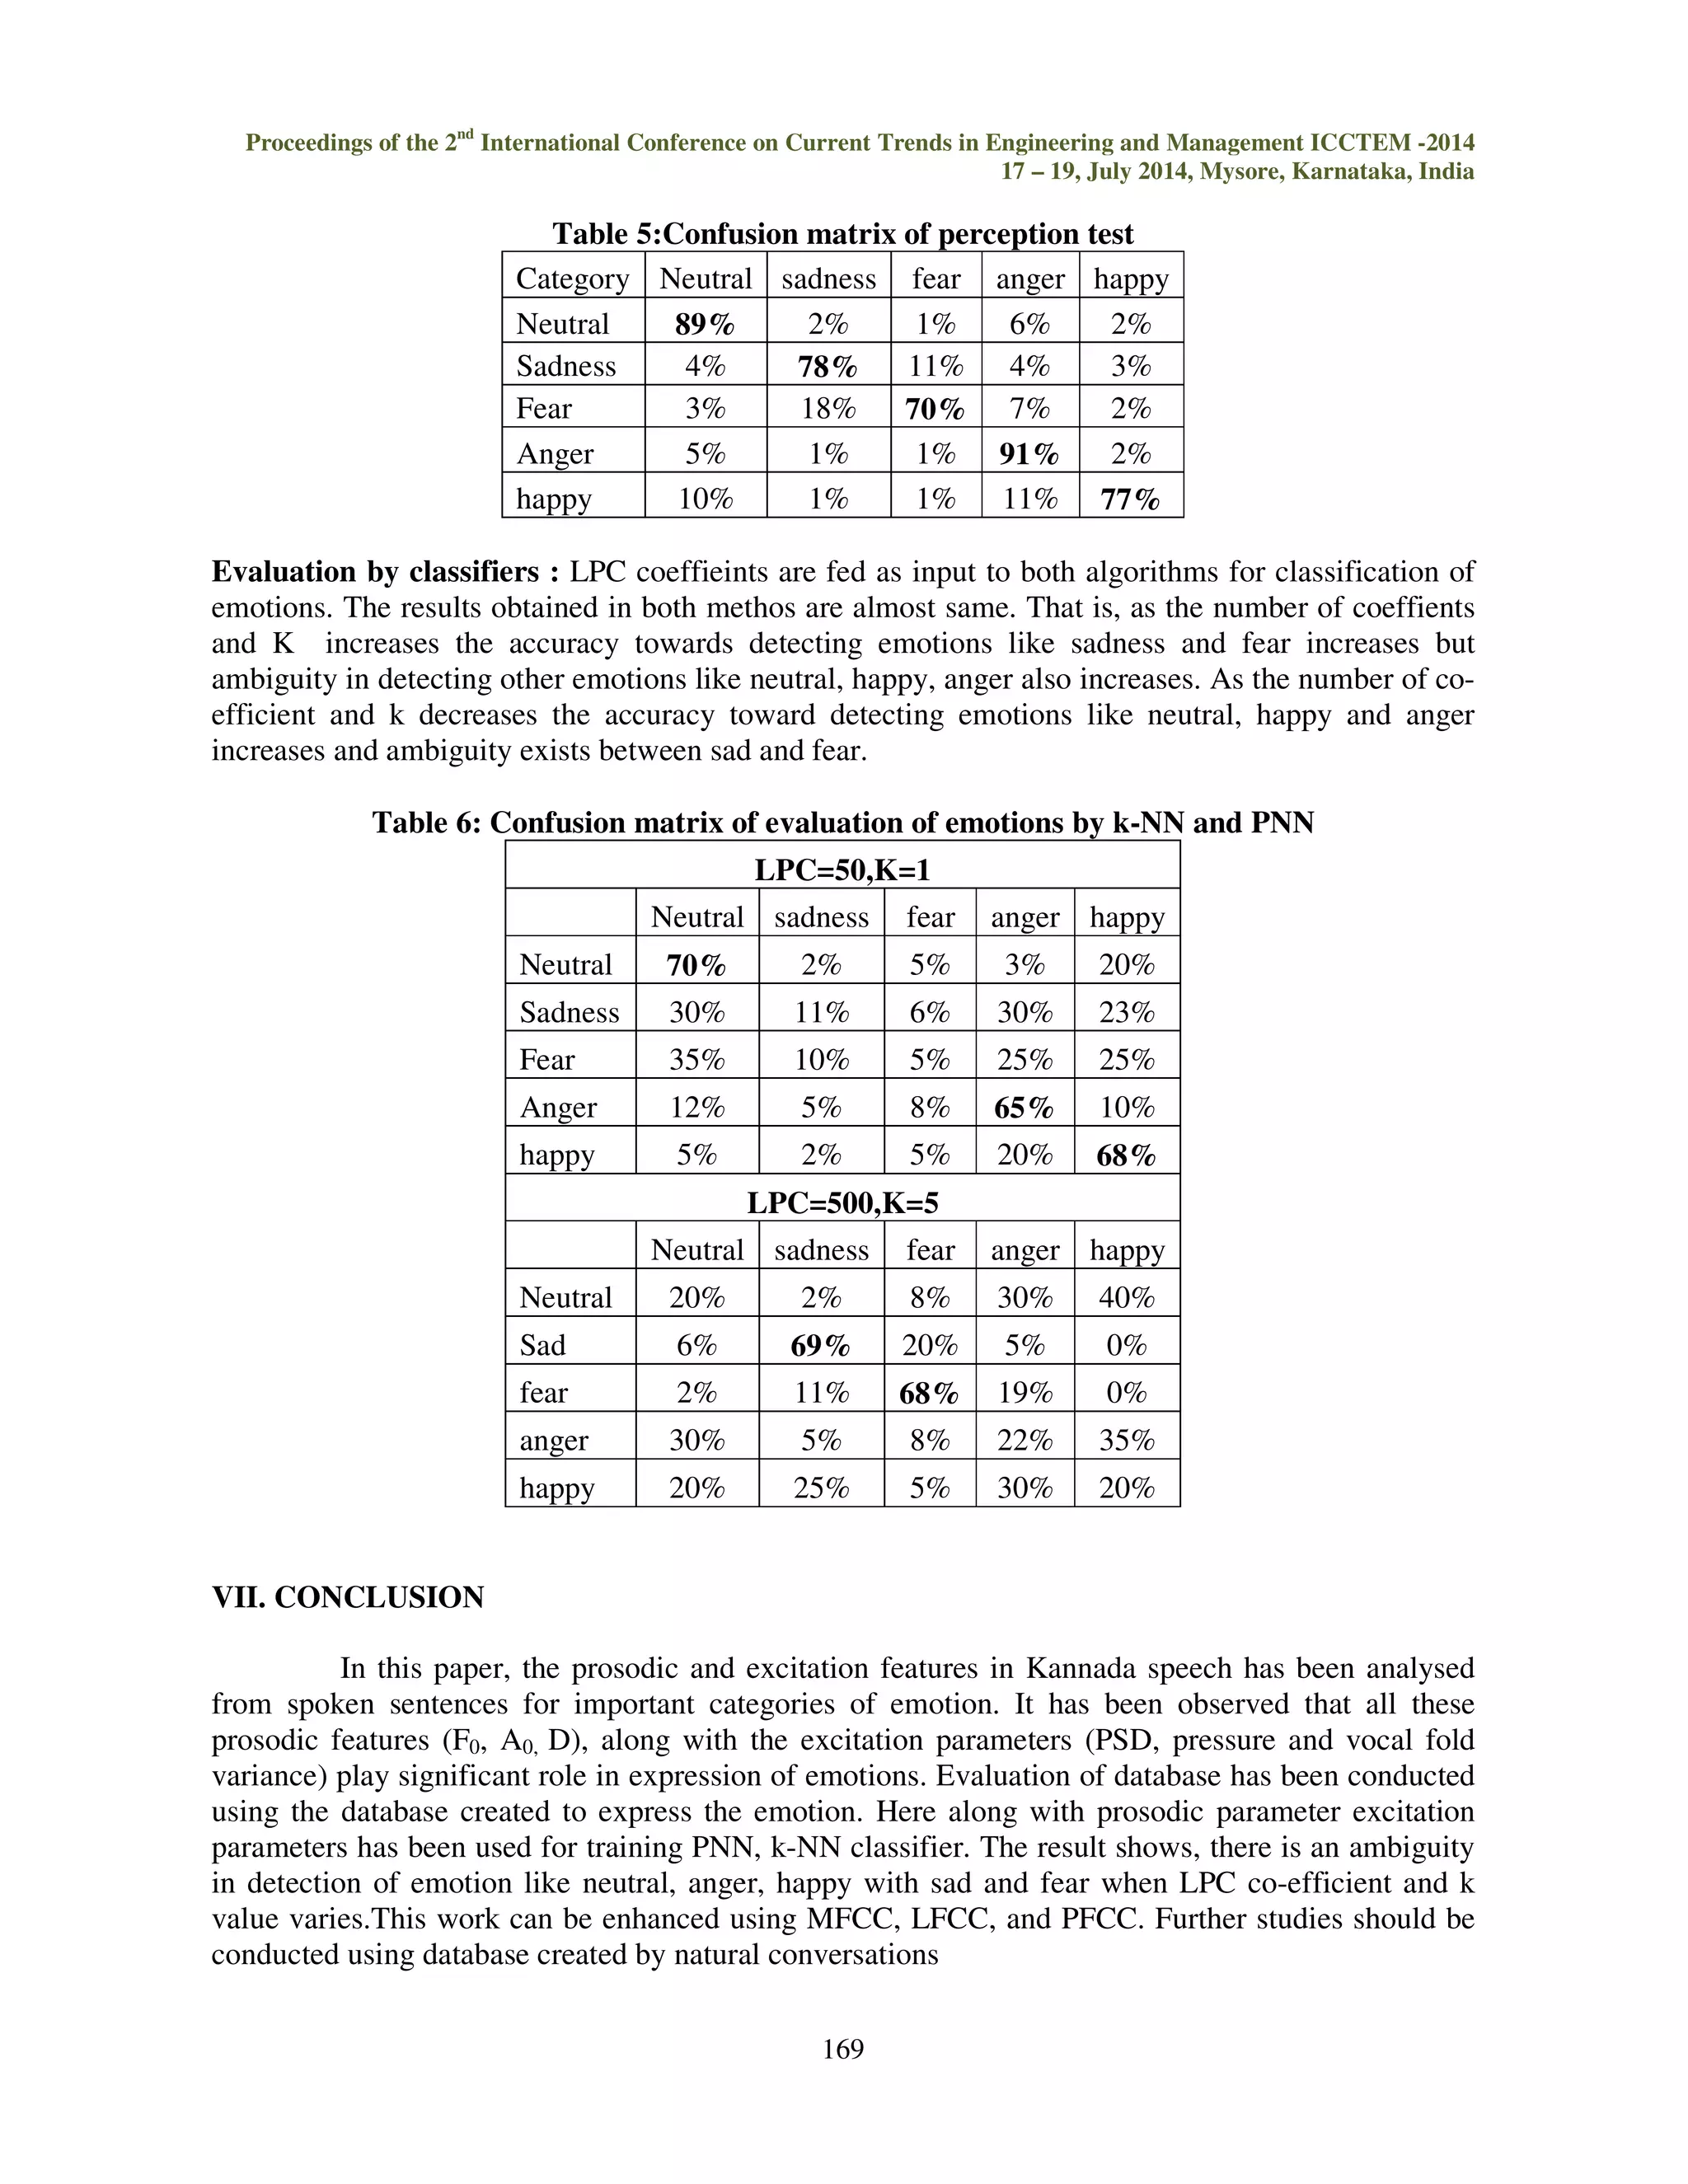
Evaluation by people: Confusion matrix created after calculating the MOS is shown in table 5, it
was observed that the most recognised emotion was anger (91%), while the least recognized emotion
was fear (70%). From the table, it can be observed that fear is the most confusing emotion that is
very much confused with sadness. The average of recognition of emotion was 81% and the order of
recognition of all emotion is anger neutra l sadness happy fear.](https://image.slidesharecdn.com/emotionalanalysisandevaluationofkannadaspeechdatabase-141110051409-conversion-gate01/75/Emotional-analysis-and-evaluation-of-kannada-speech-database-11-2048.jpg)

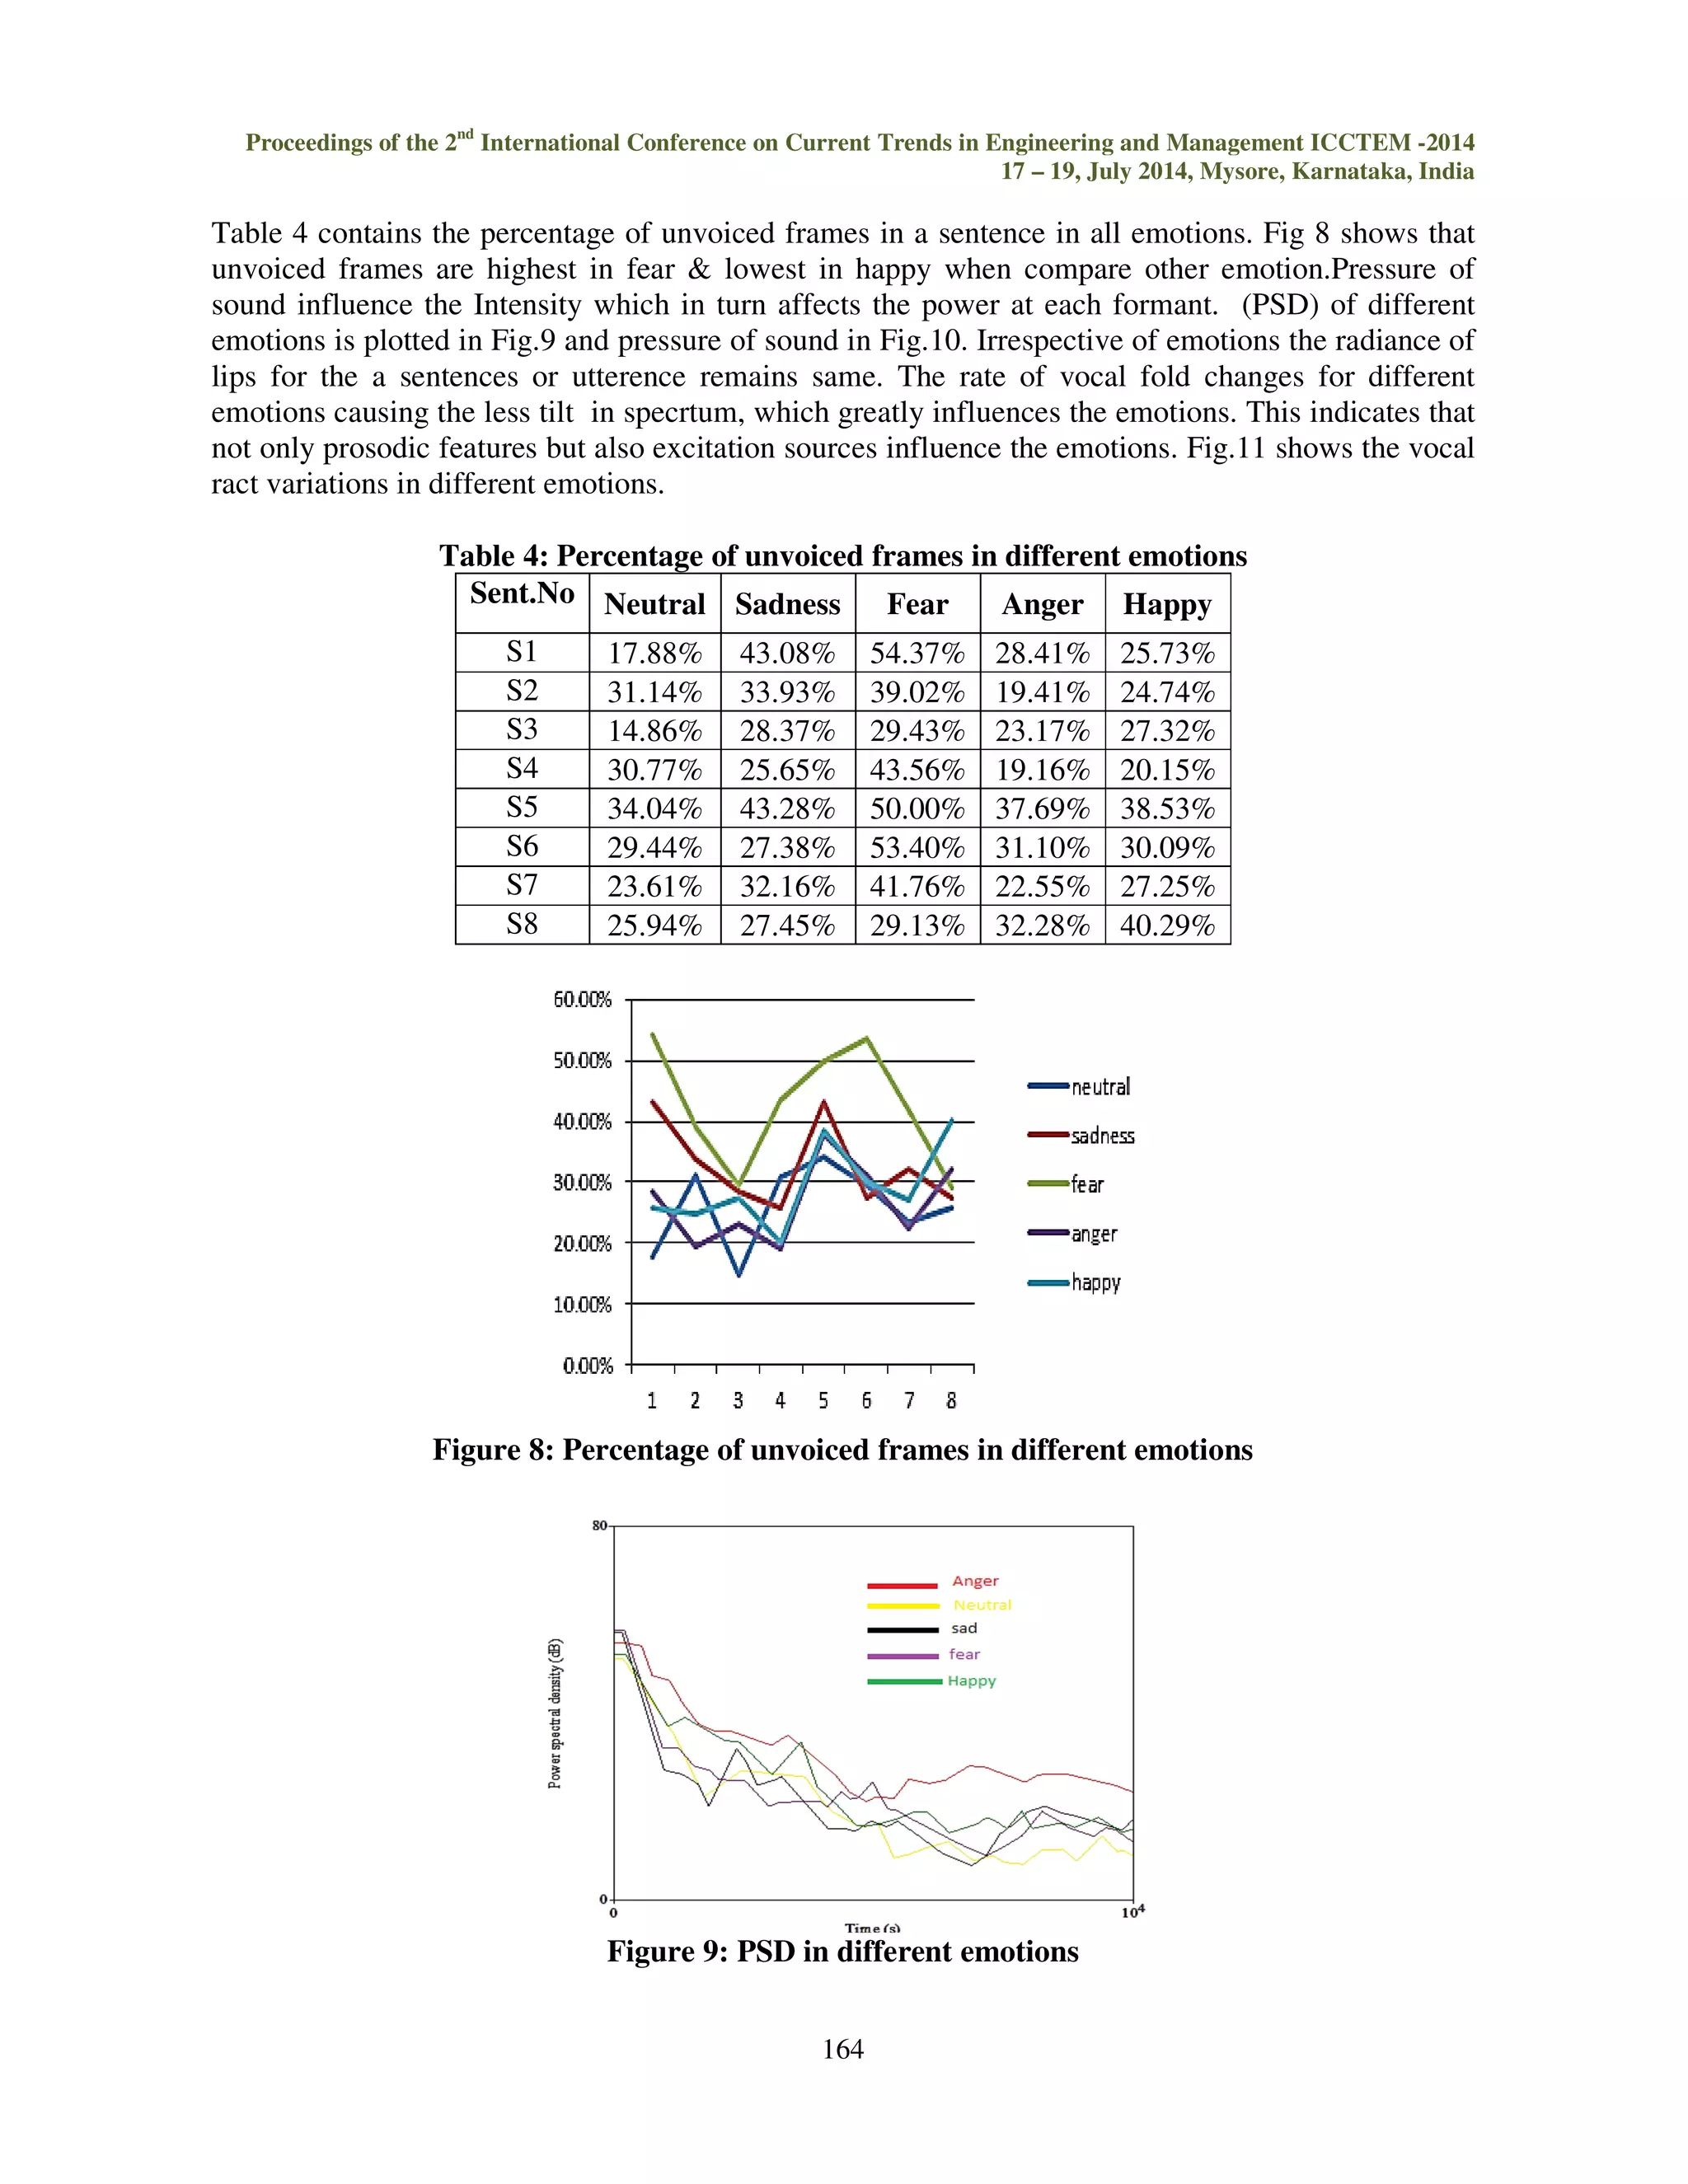
This document discusses the development of an emotional Kannada speech database and its analysis and evaluation for building an effective emotion recognition system. Key points: - A database of 60 sentences in Kannada was created, expressing happiness, sadness, anger, fear and neutral emotions as uttered by 2 male actors. - Acoustic features like pitch, intensity, percentage of unvoiced frames, sound pressure, vocal tract variations were analyzed for the different emotions using PRAAT software. - Statistical analysis found pitch was highest in fear and lowest in sadness, while intensity was highest in anger and lowest in fear. Unvoiced frames were highest in fear and lowest in happy. - Linear predictive coding (LPC) was


![Vibe Coding vs. Spec-Driven Development [Free Meetup]](https://cdn.slidesharecdn.com/ss_thumbnails/vibecodingvsspecdrivendevelopment-251209105622-43f455e7-thumbnail.jpg?width=640&height=640&fit=bounds)
