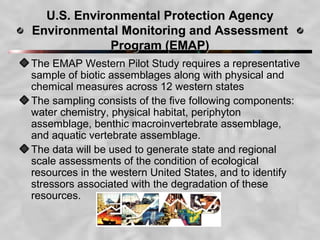
1) The EPA Environmental Monitoring and Assessment Program collected data on water chemistry, habitat, algae, macroinvertebrates, and vertebrates from streams in 12 western US states to assess ecological conditions.
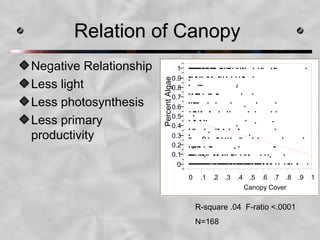
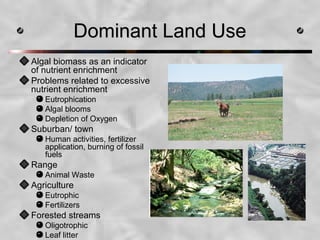
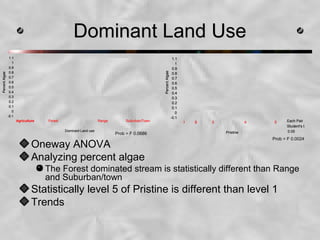
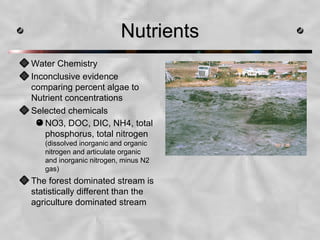
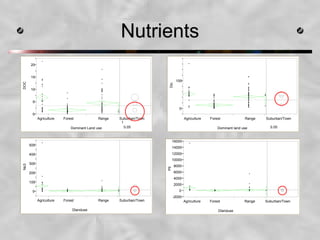
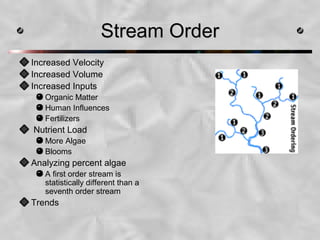
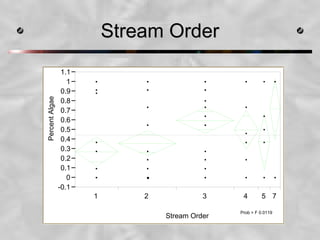
2) The study used a random subset of the EMAP data to determine if algal biomass could indicate stream condition. Statistical analyses found relationships between higher algal levels and less canopy cover, more developed land uses, higher nutrient levels, and higher stream order.
3) The results suggest algae can act as a biological indicator of stream health and potential stressors like lack of shade, agriculture, and nutrients.