Download as PDF, PPTX

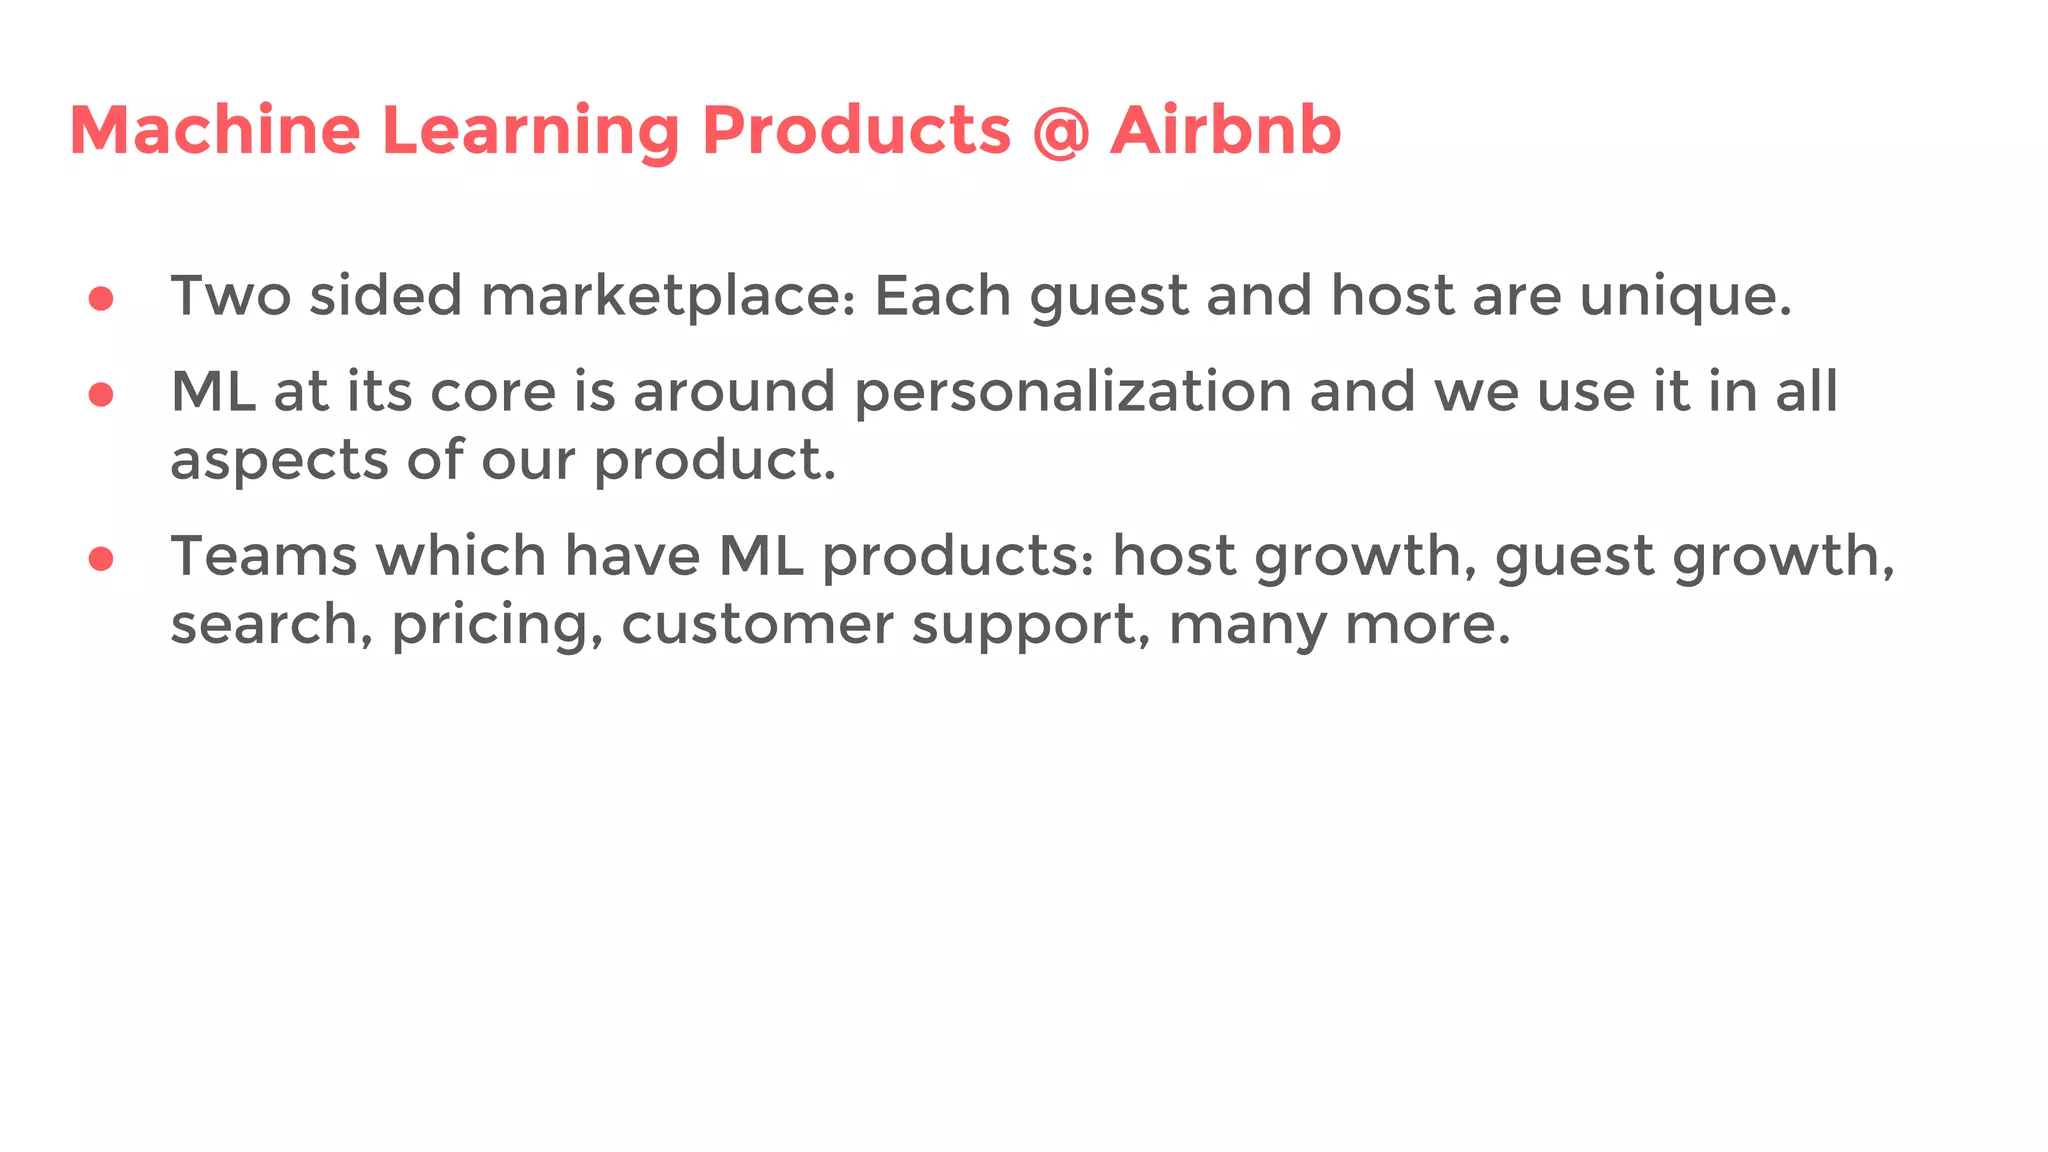
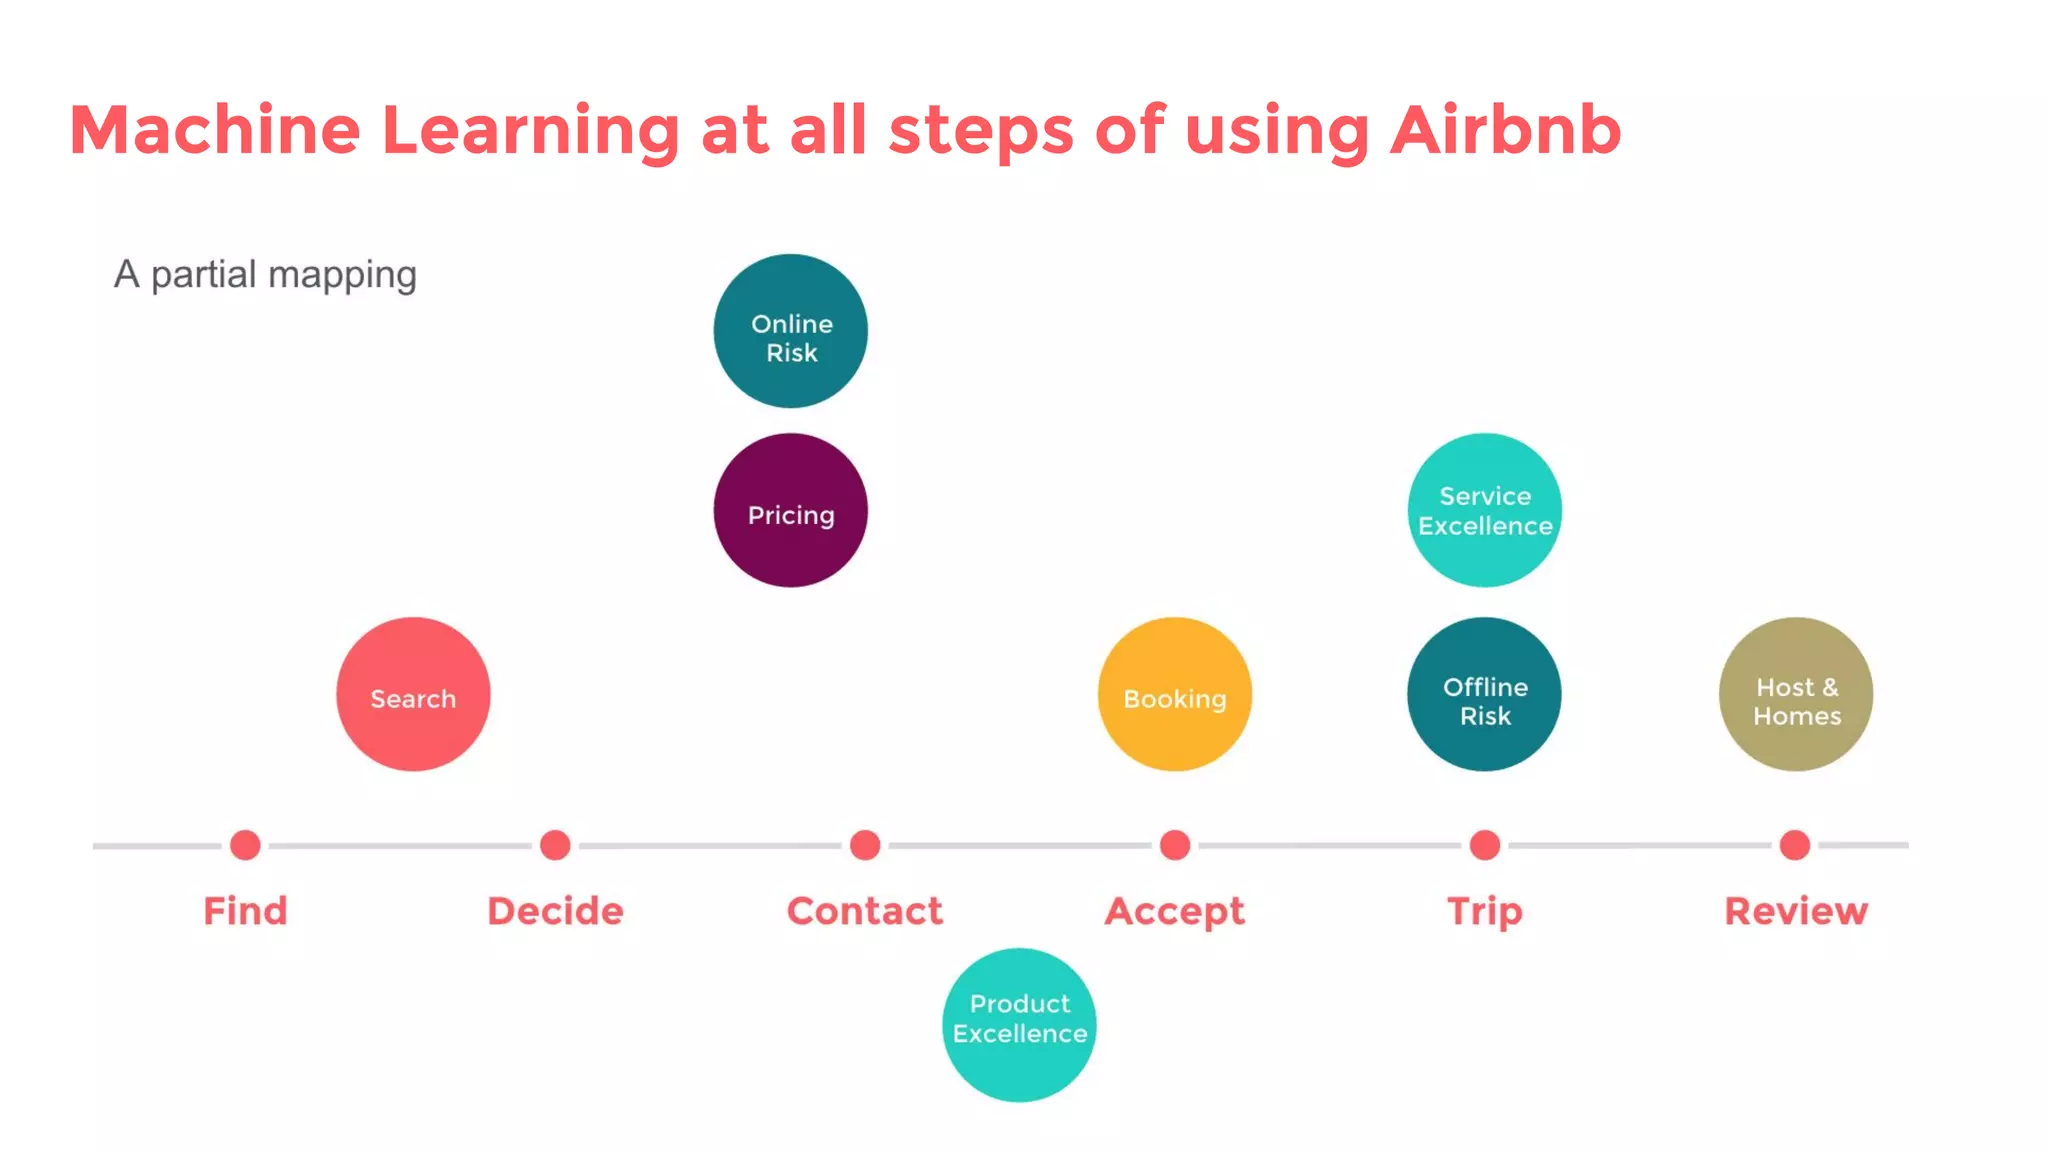
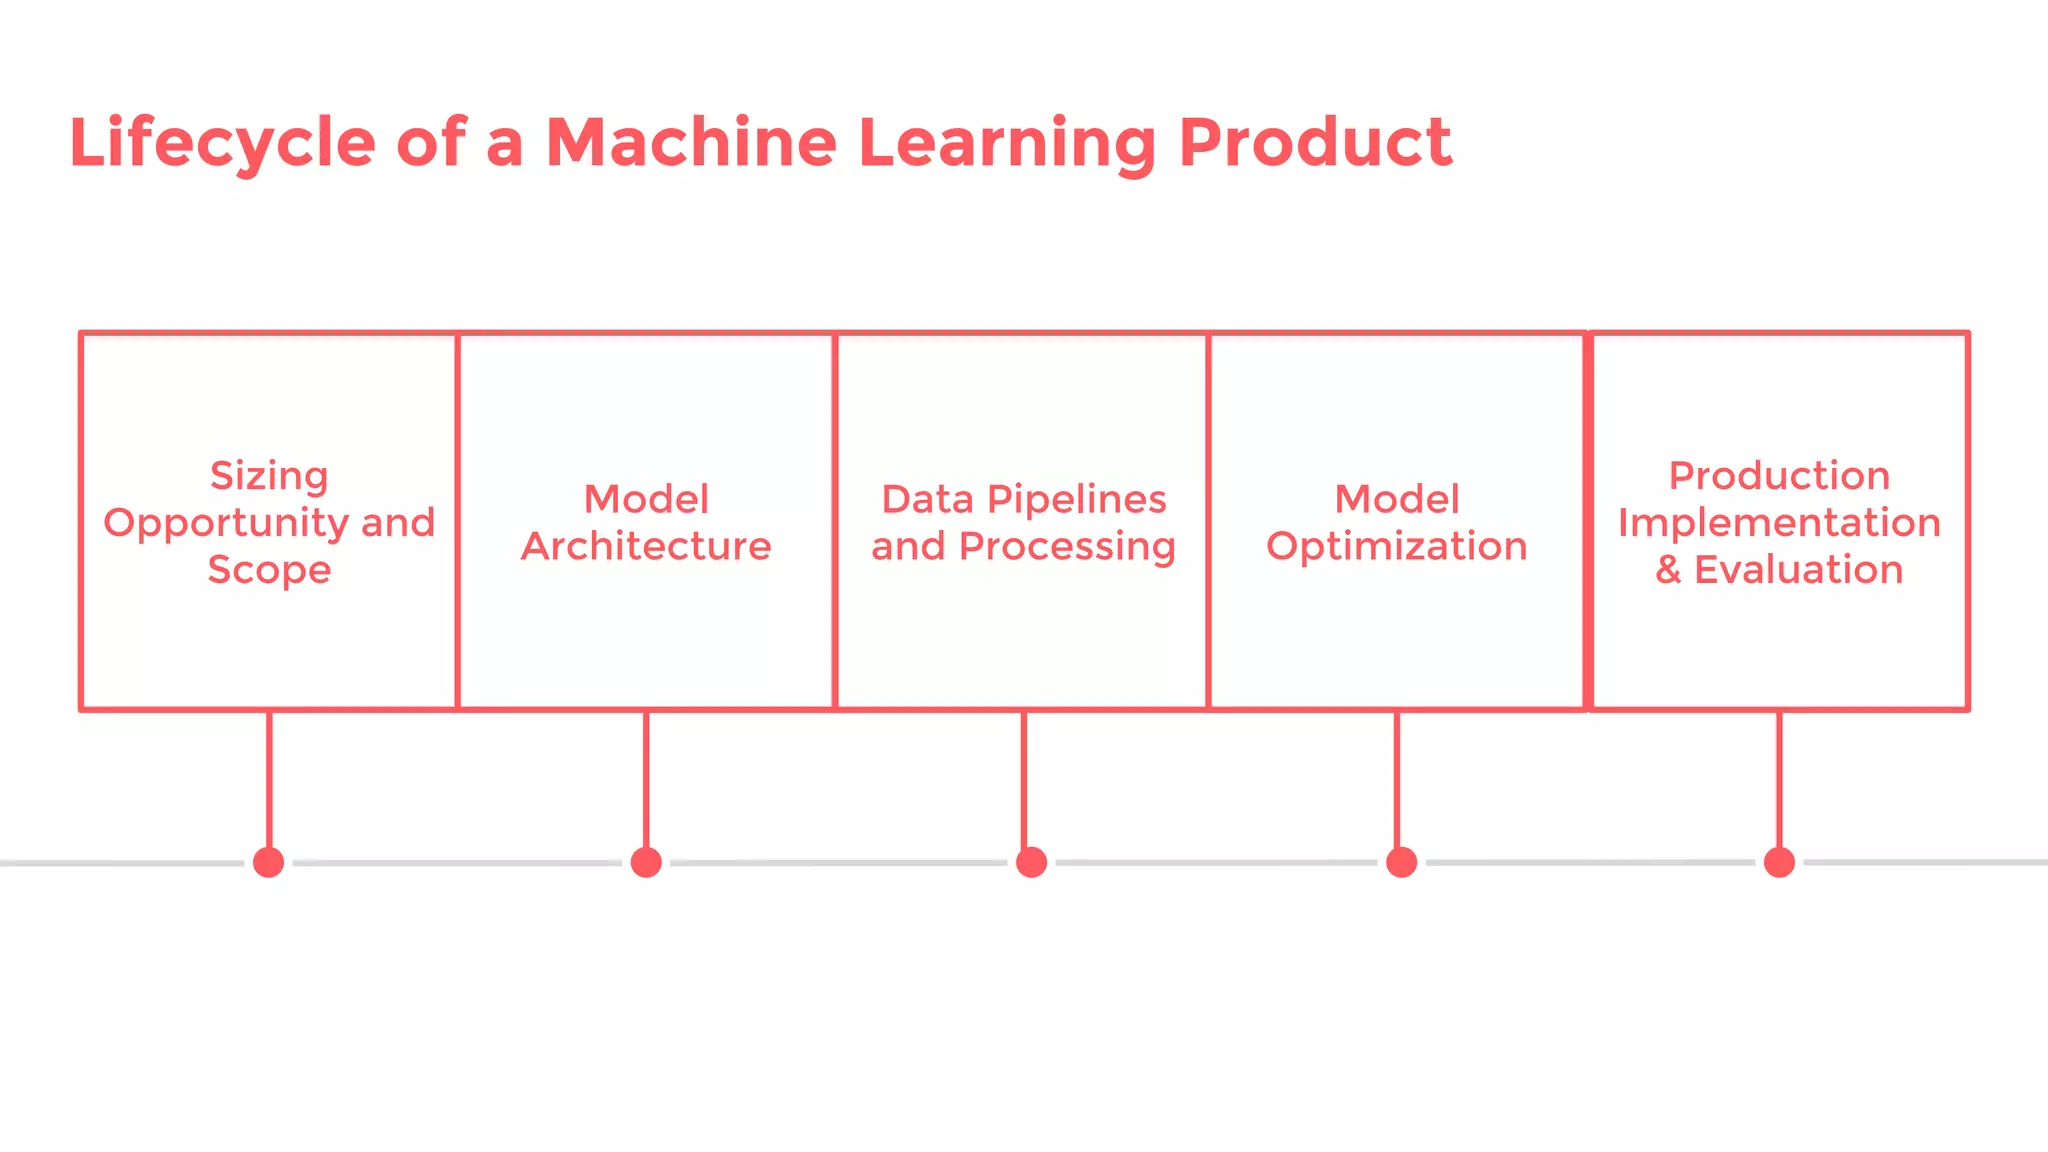
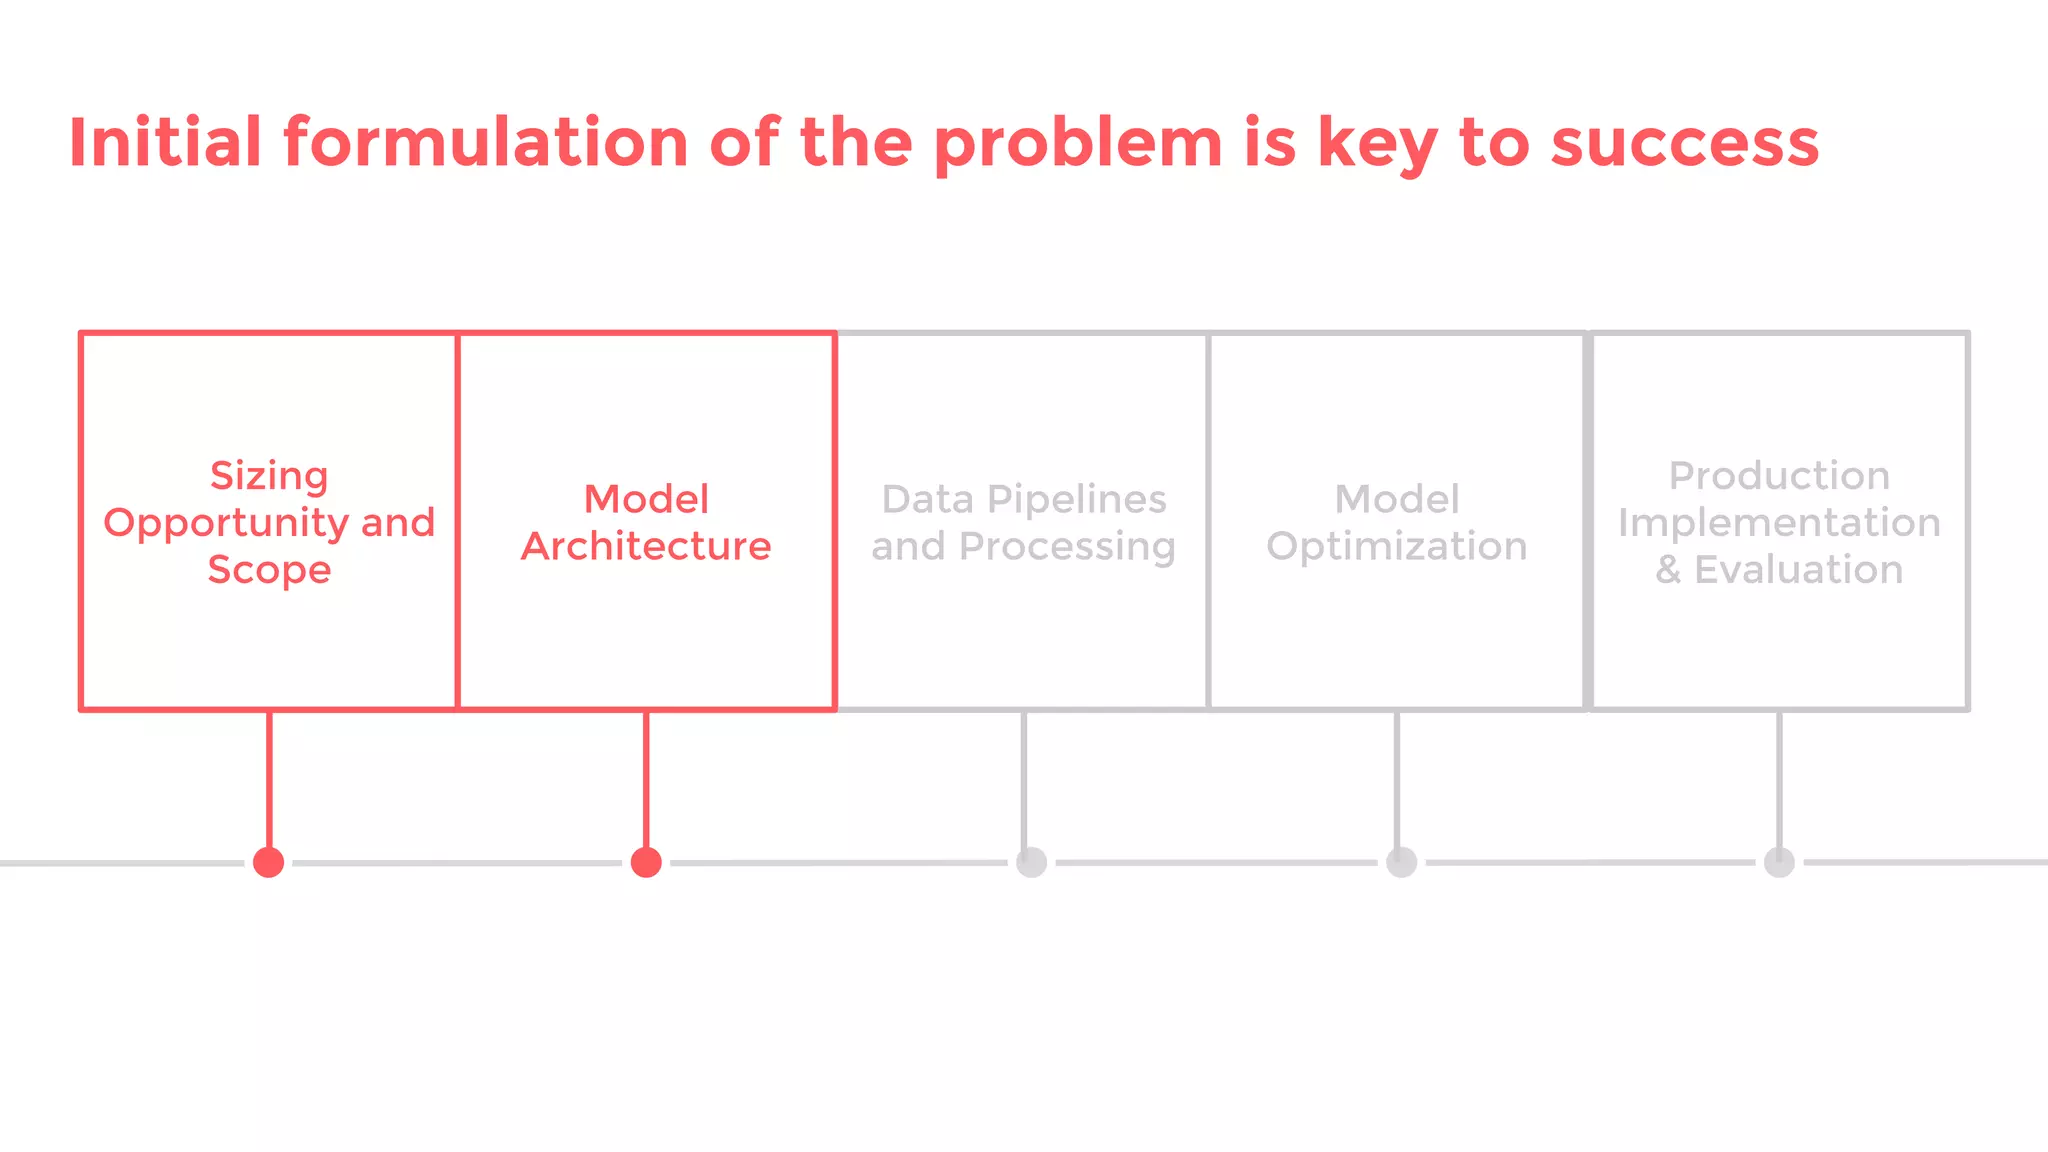


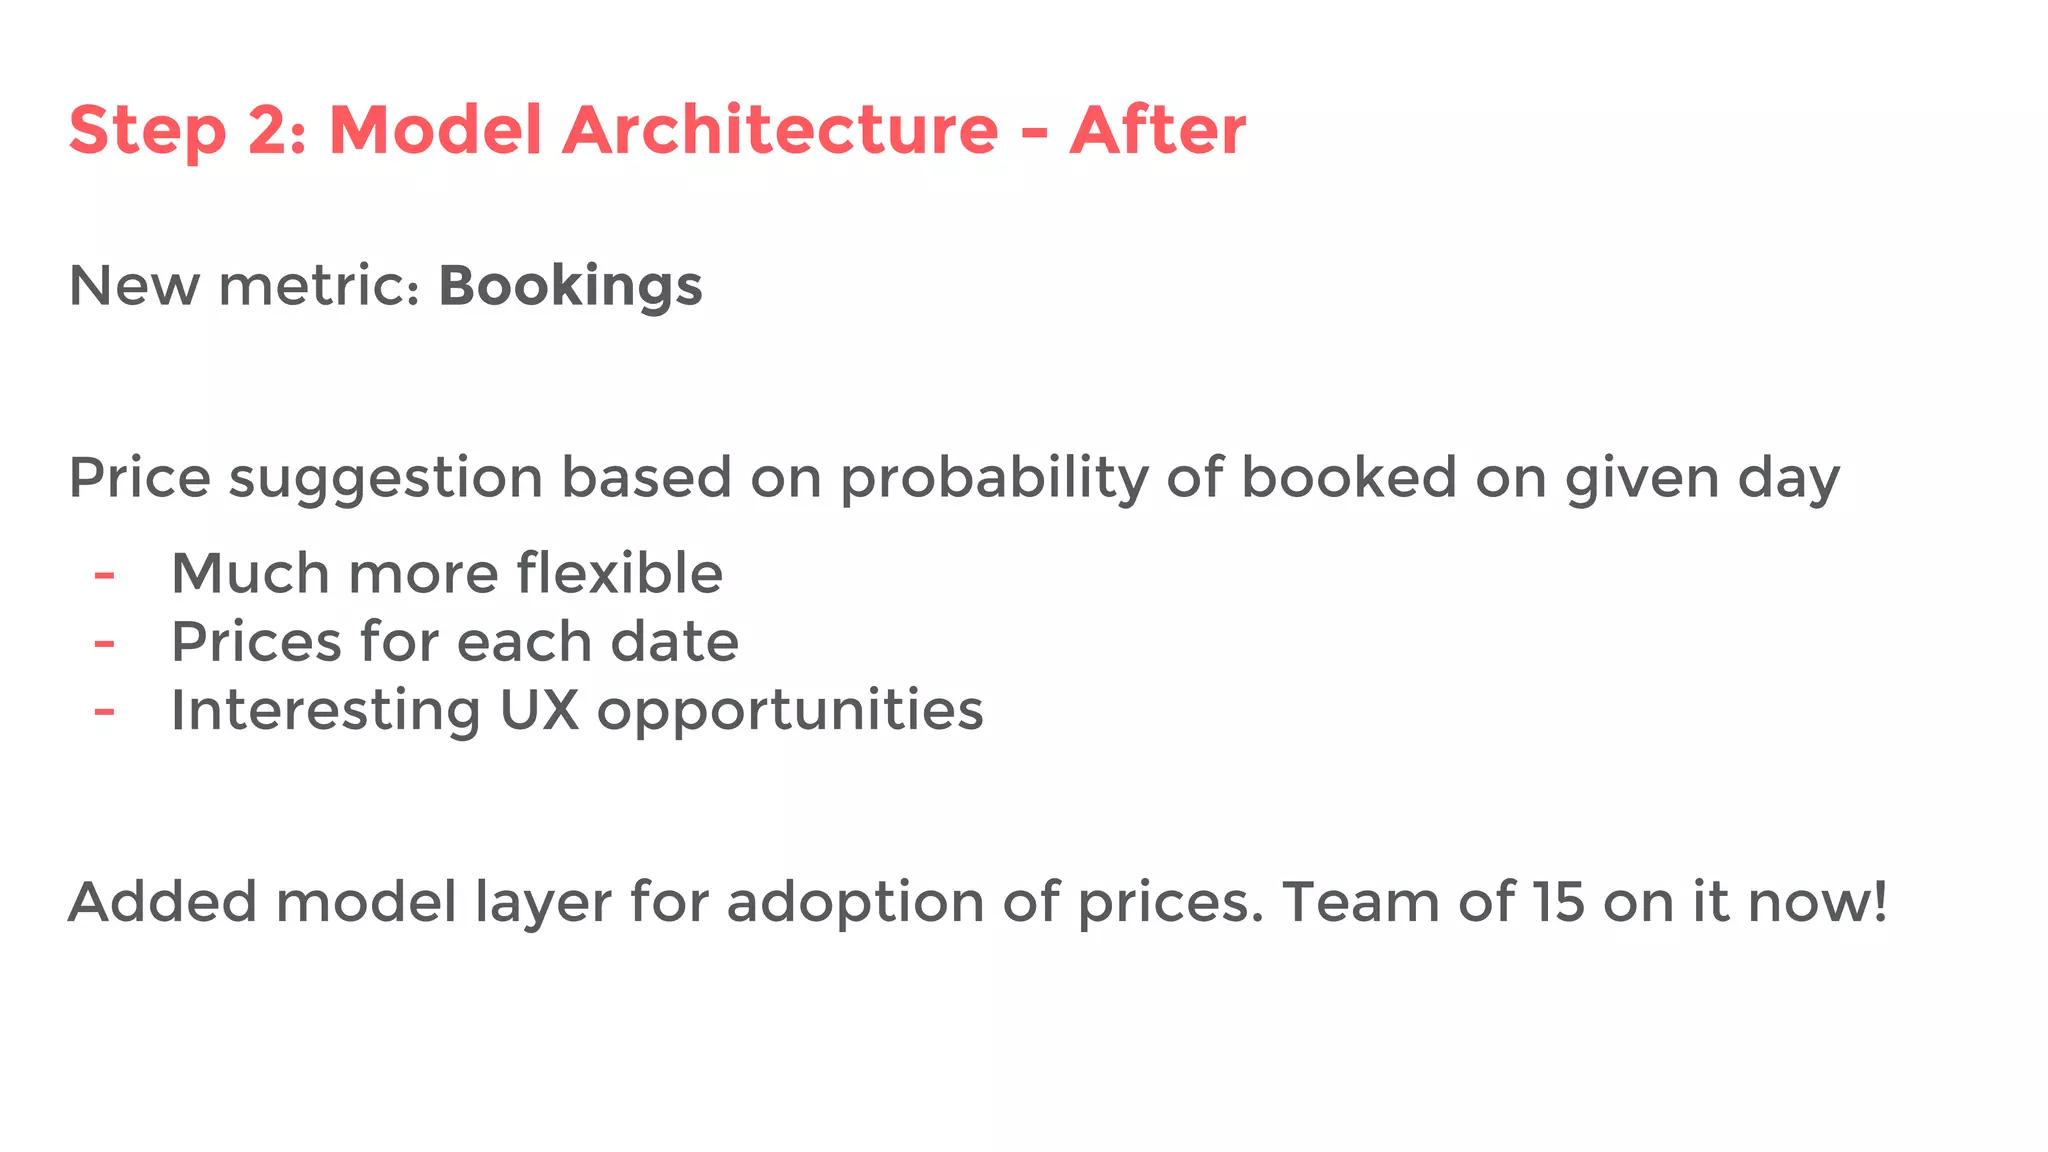
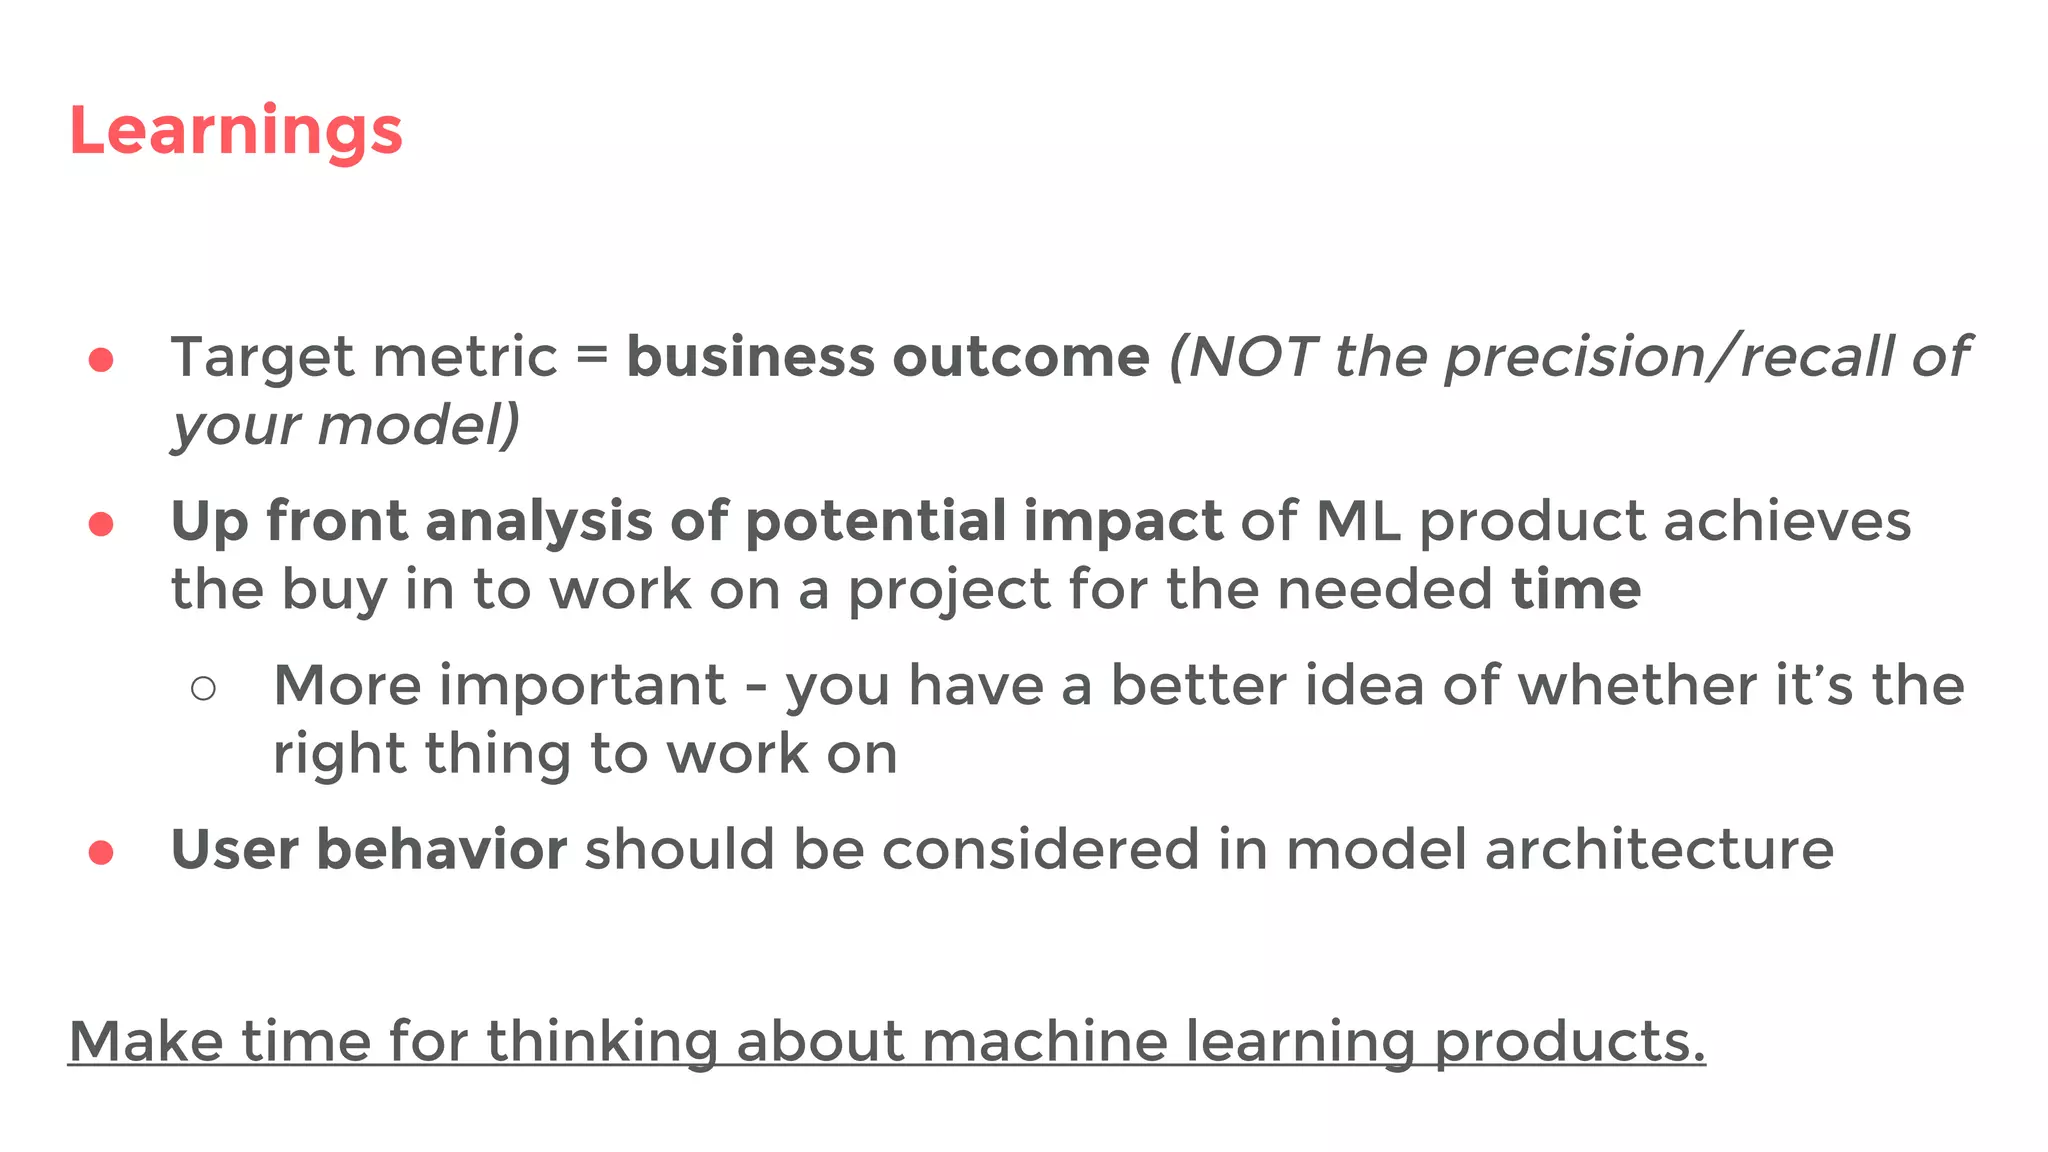

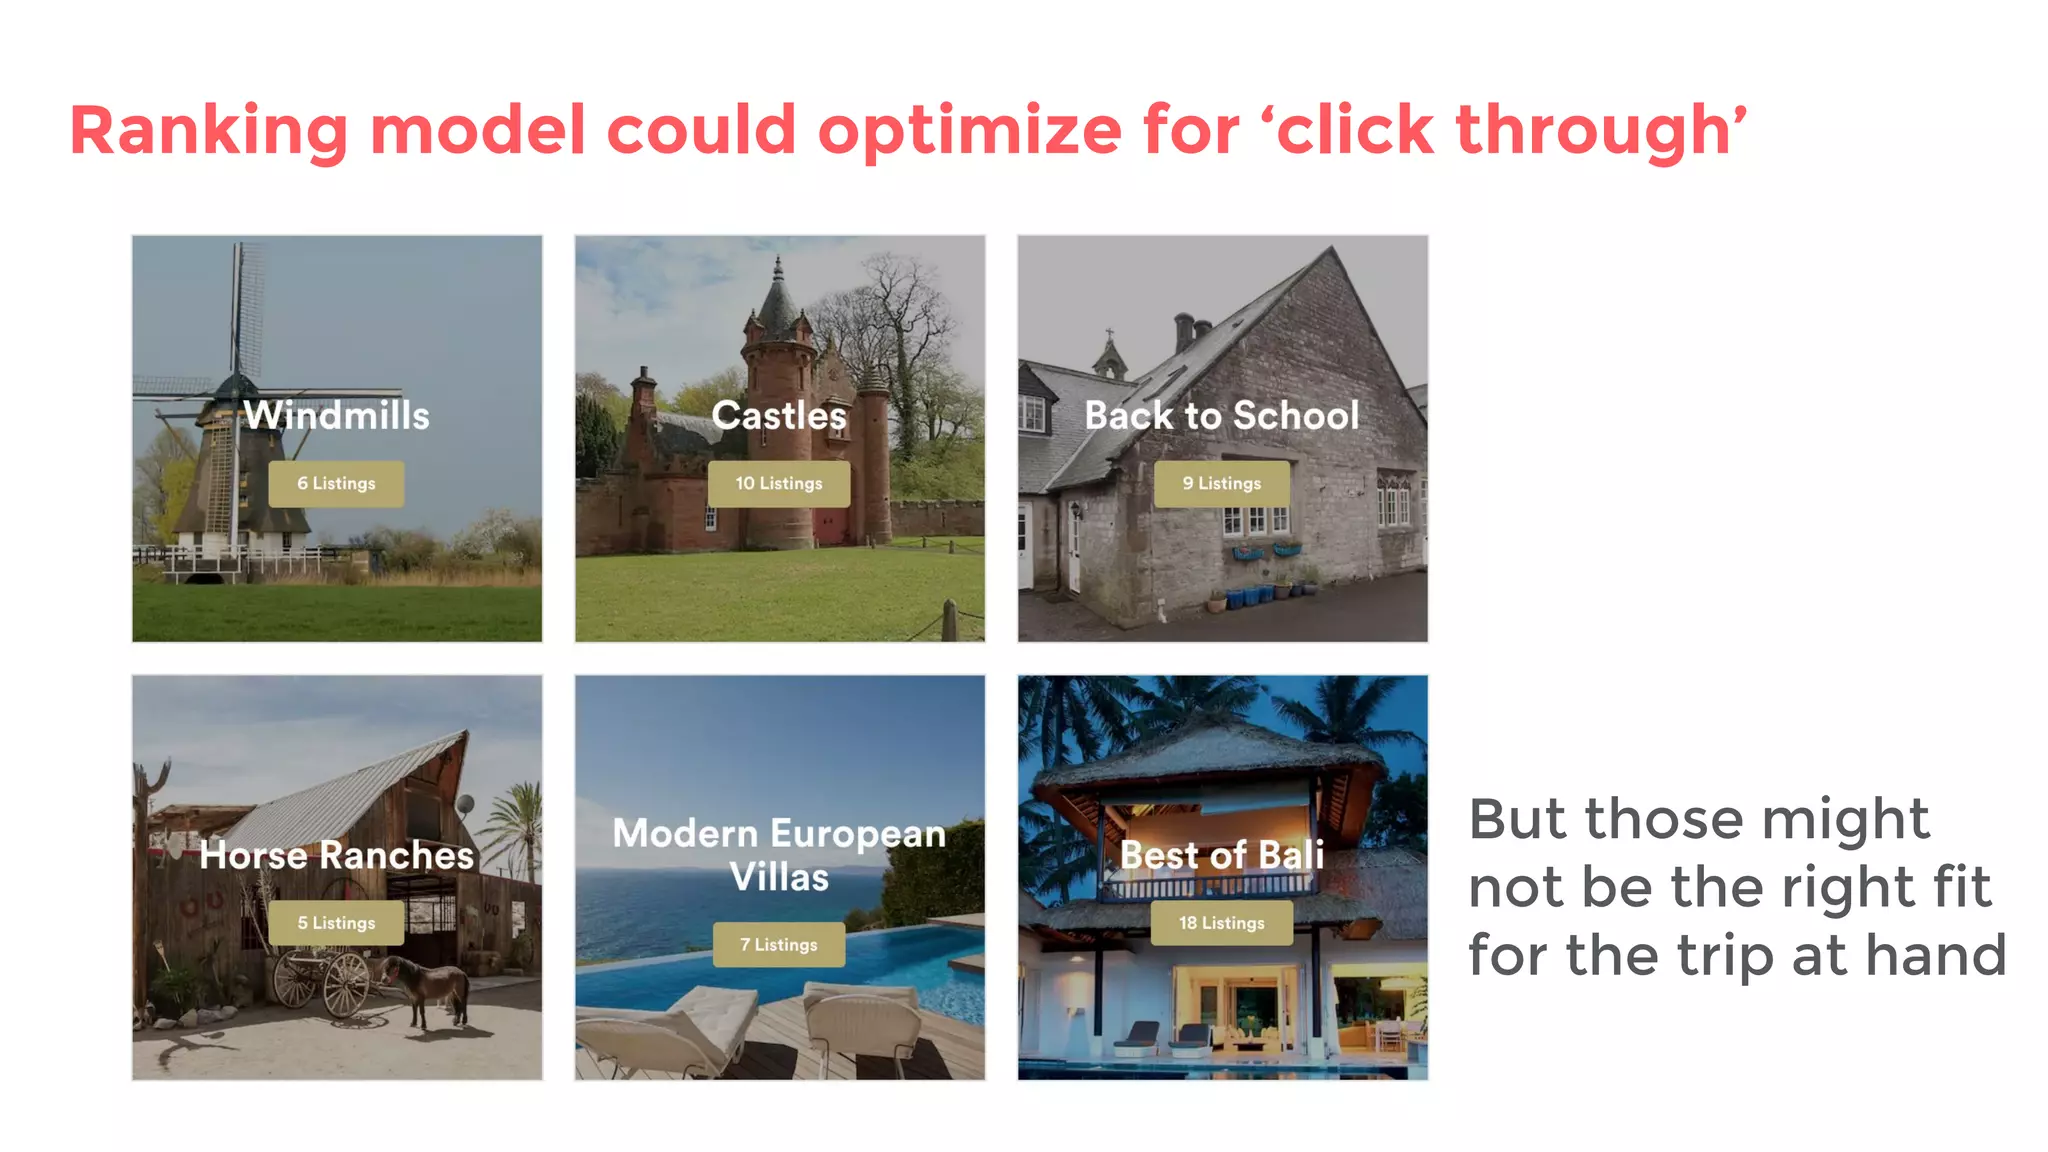
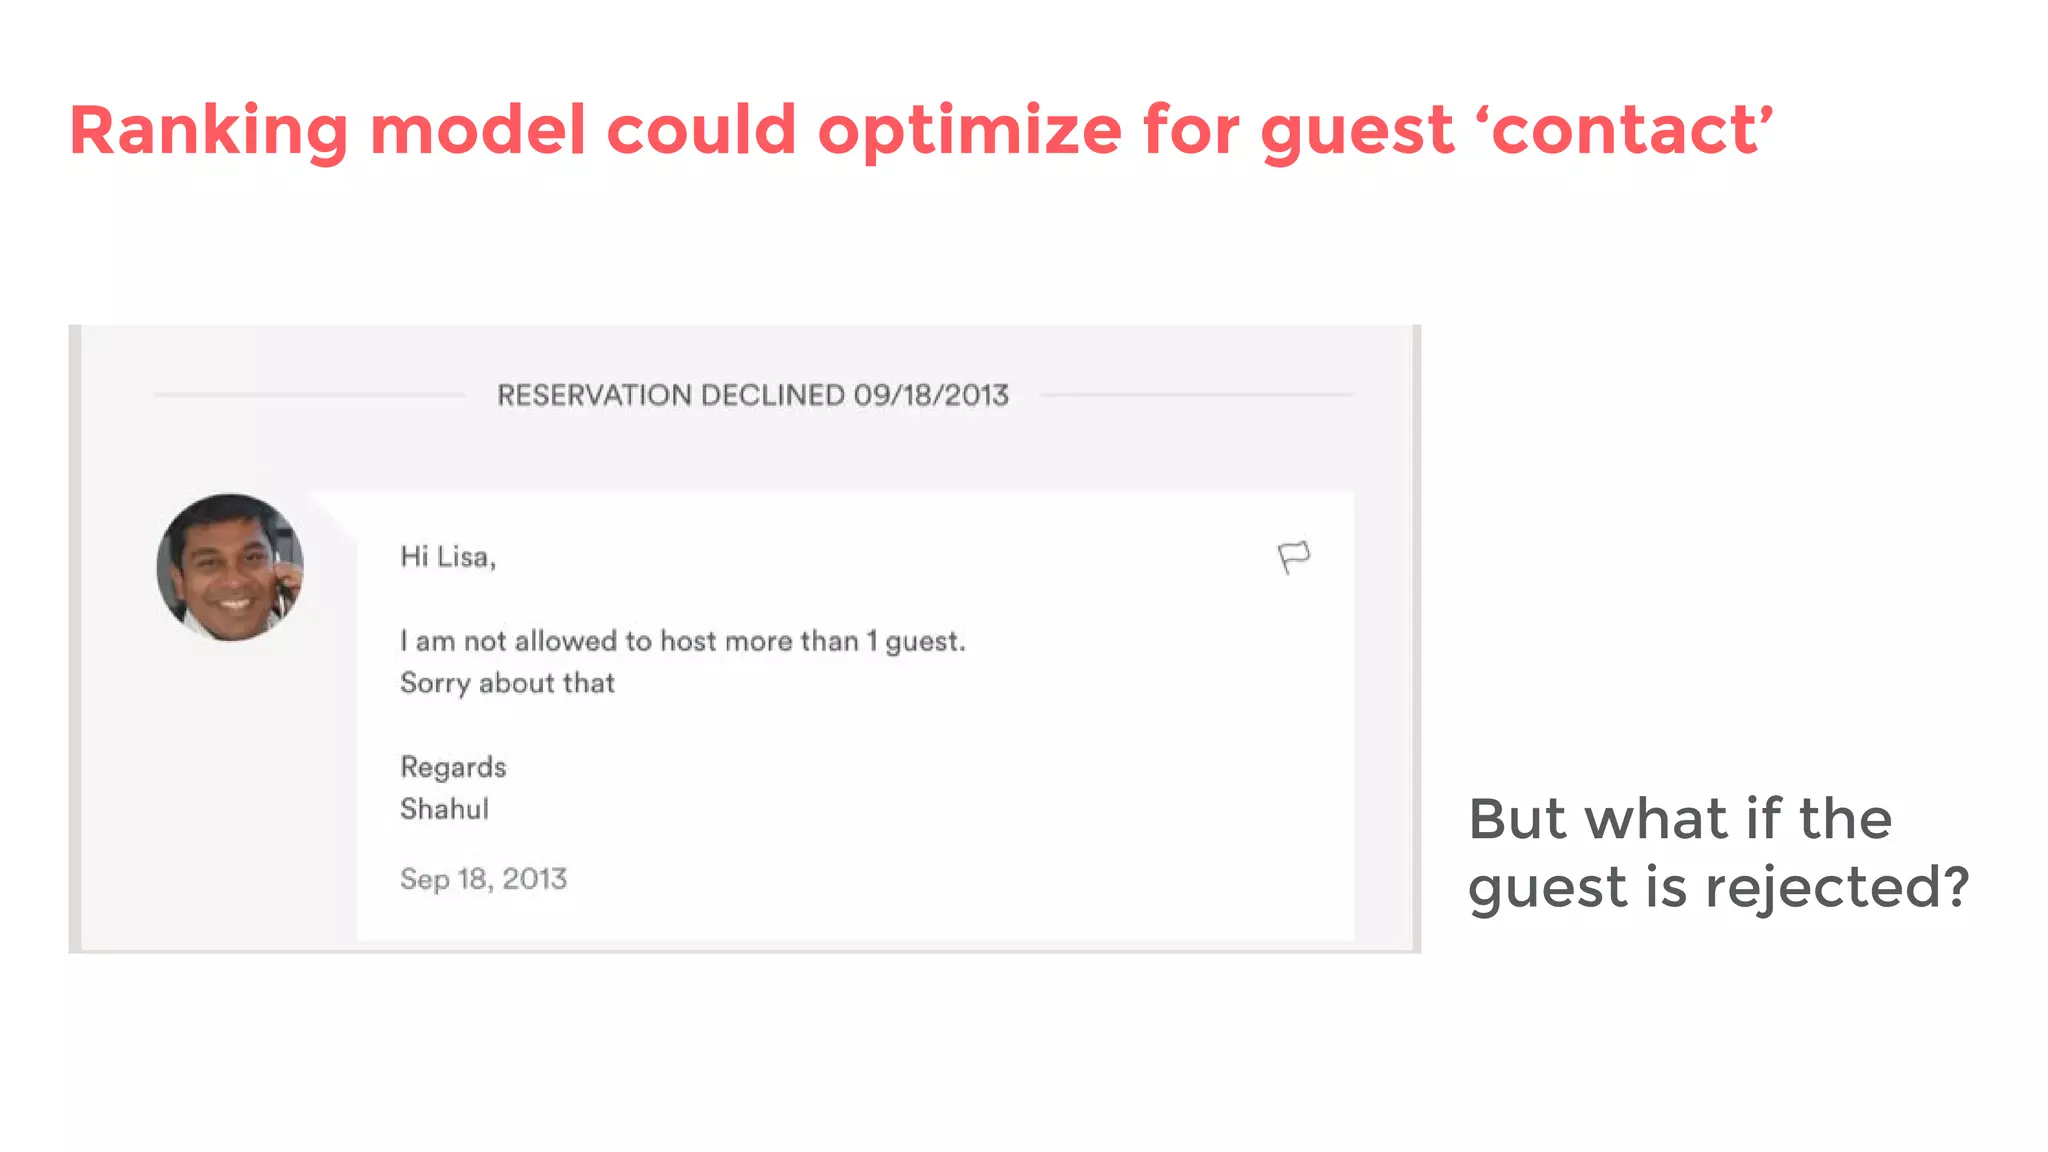
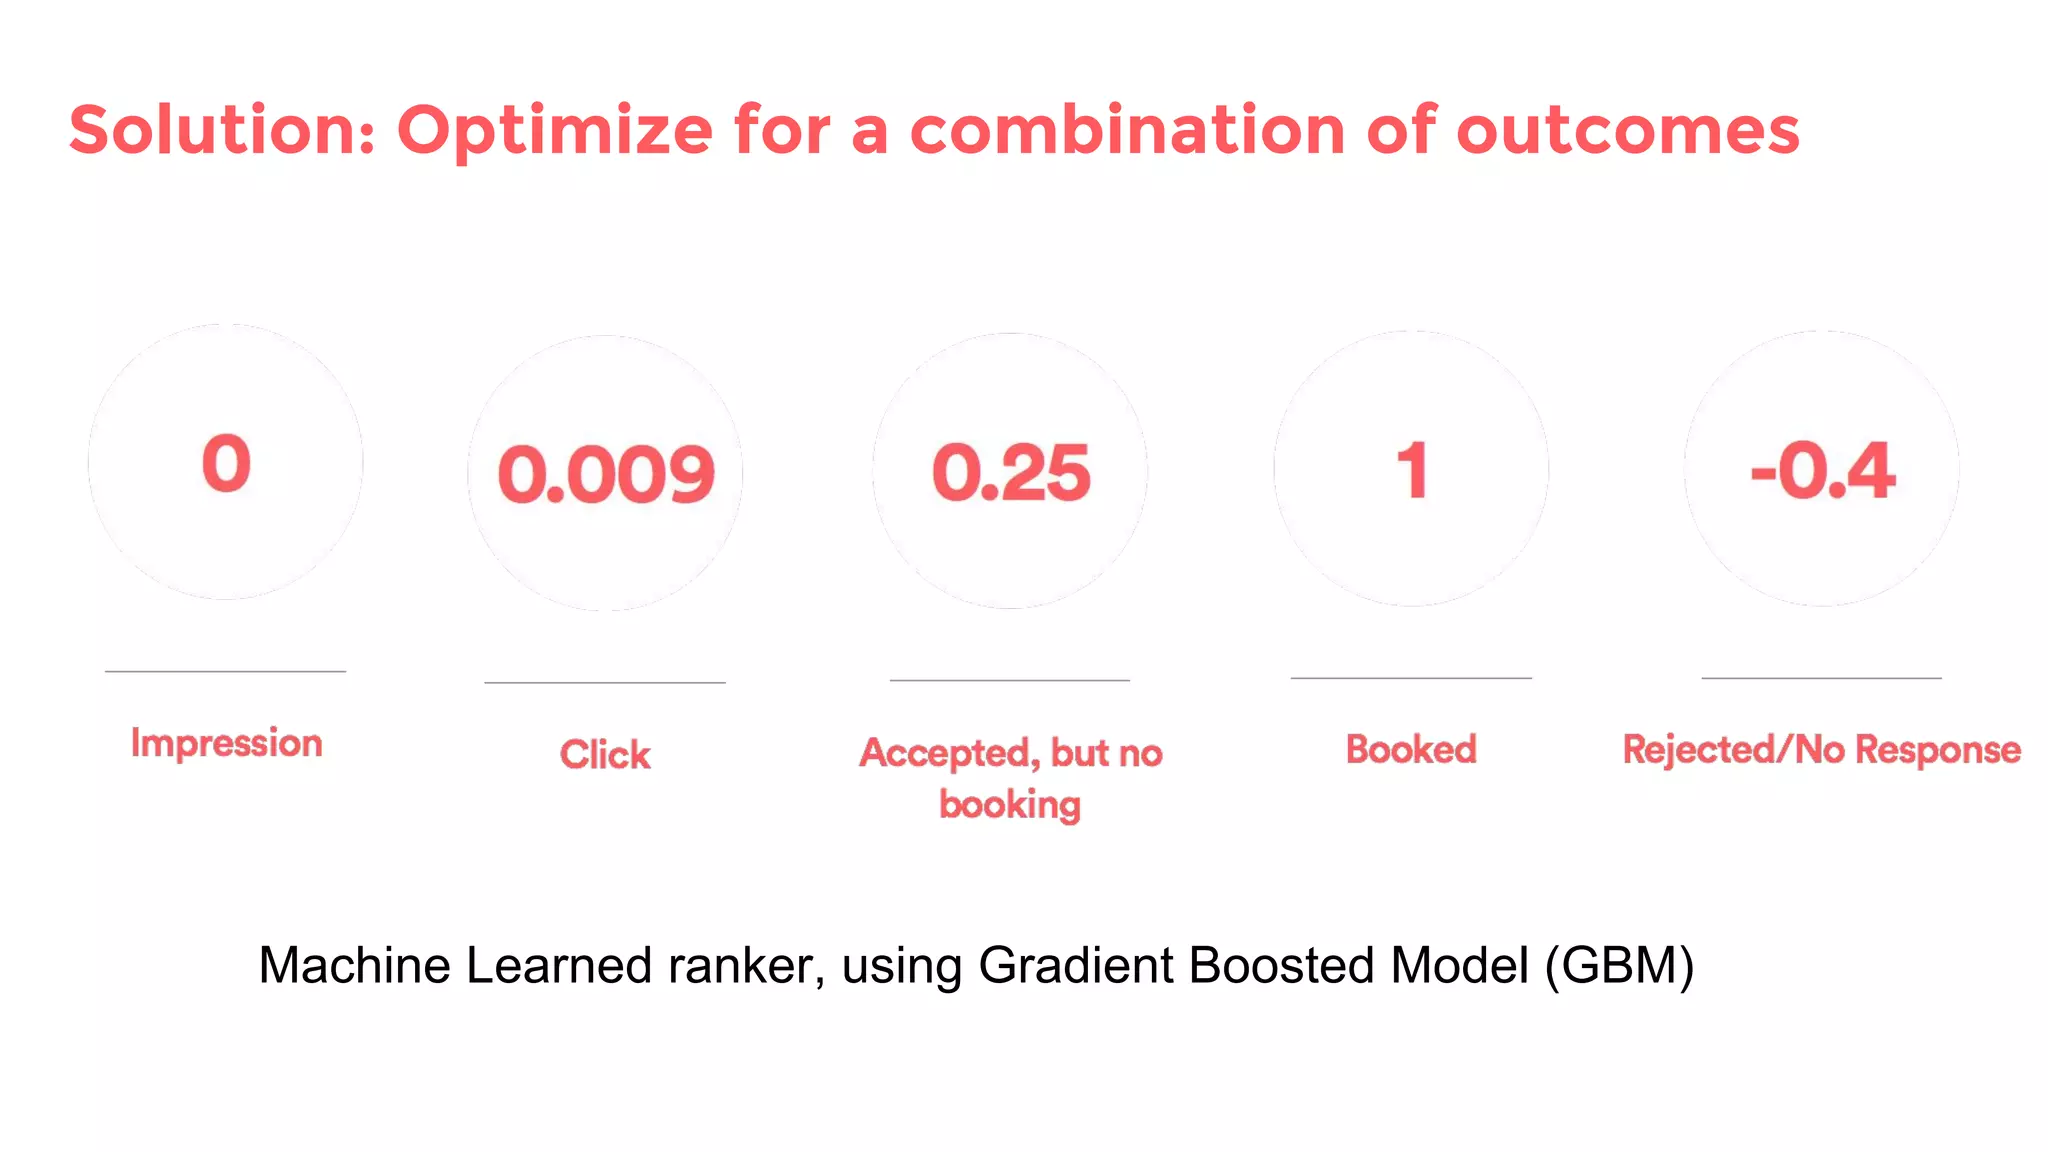
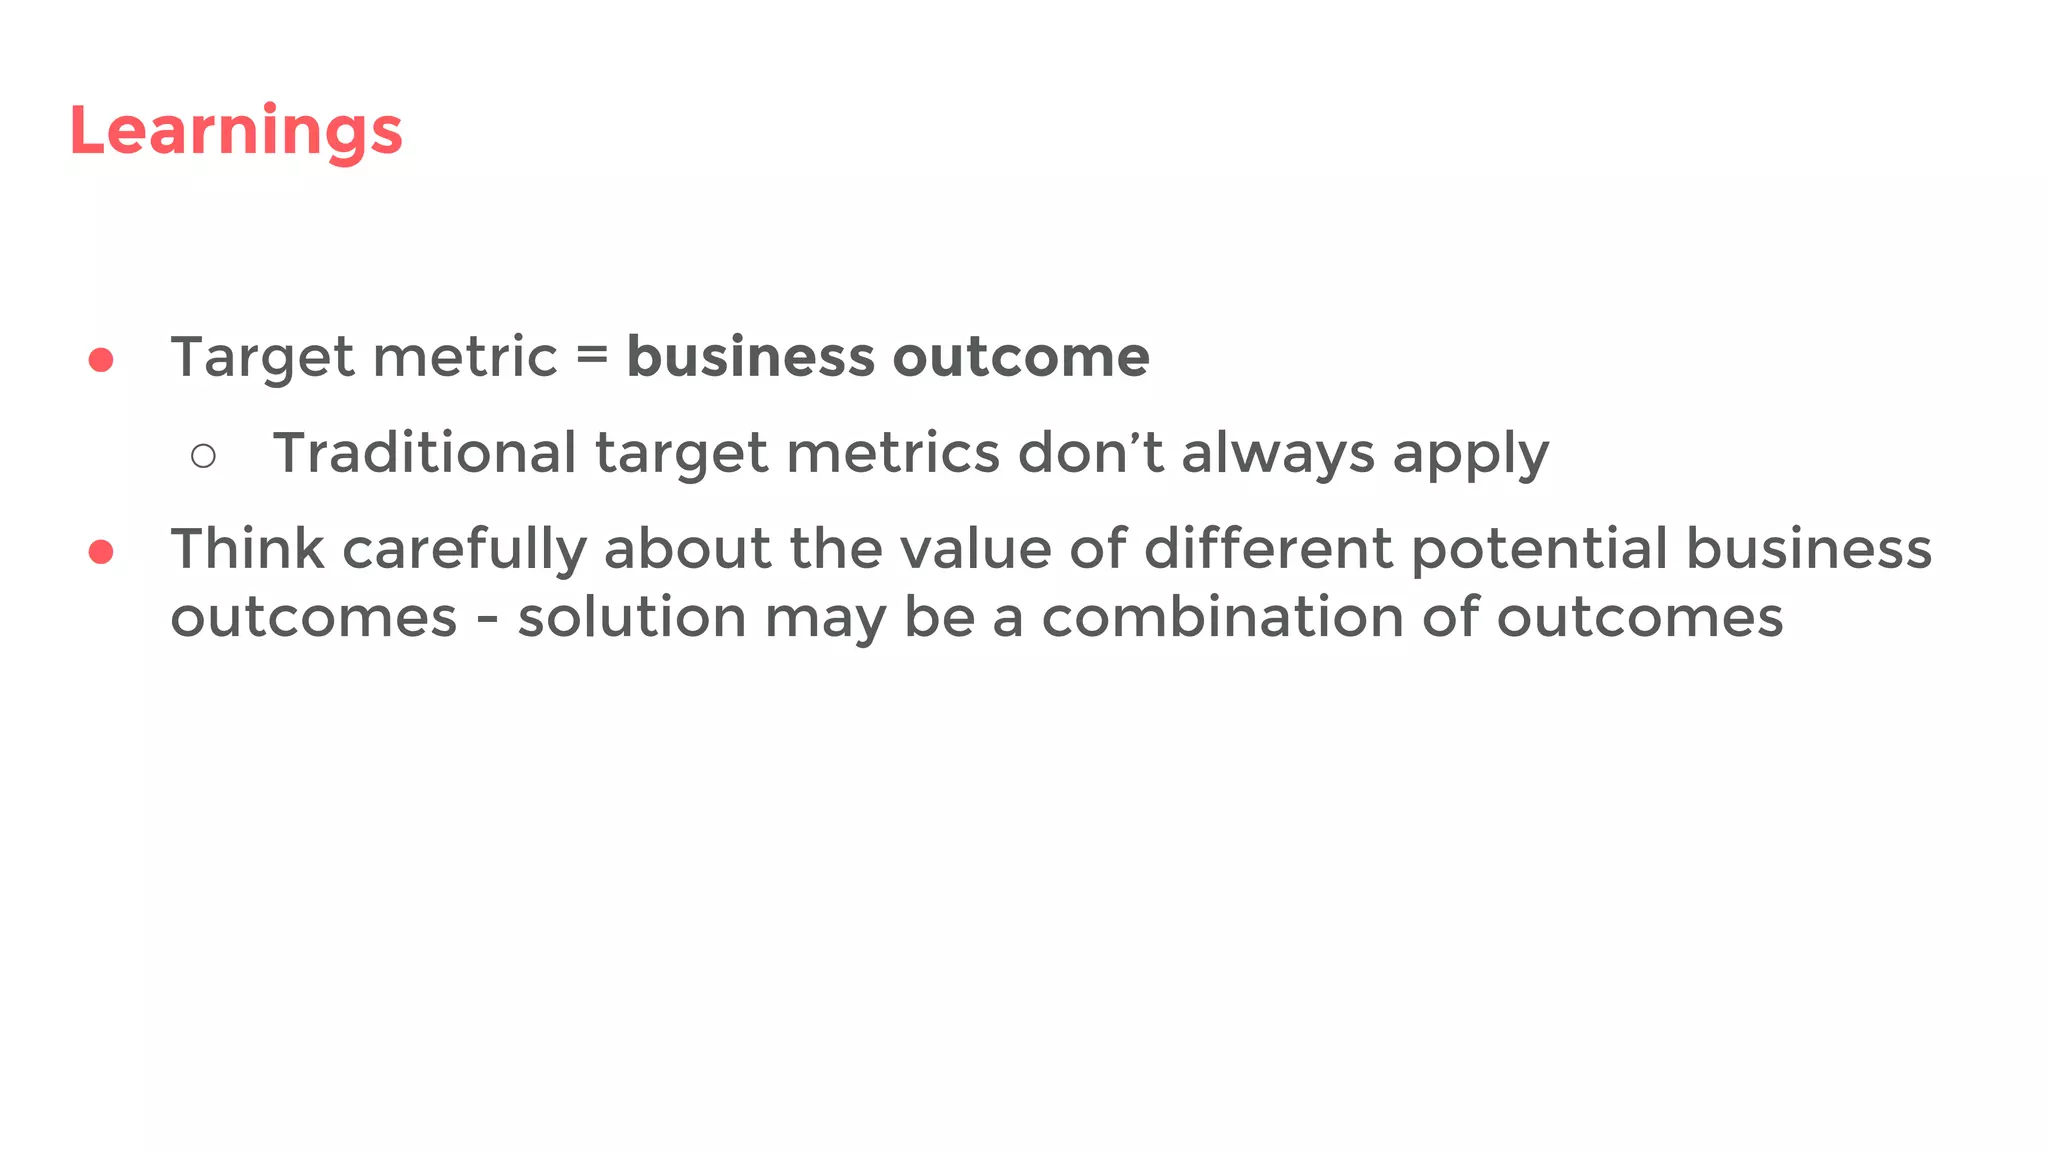

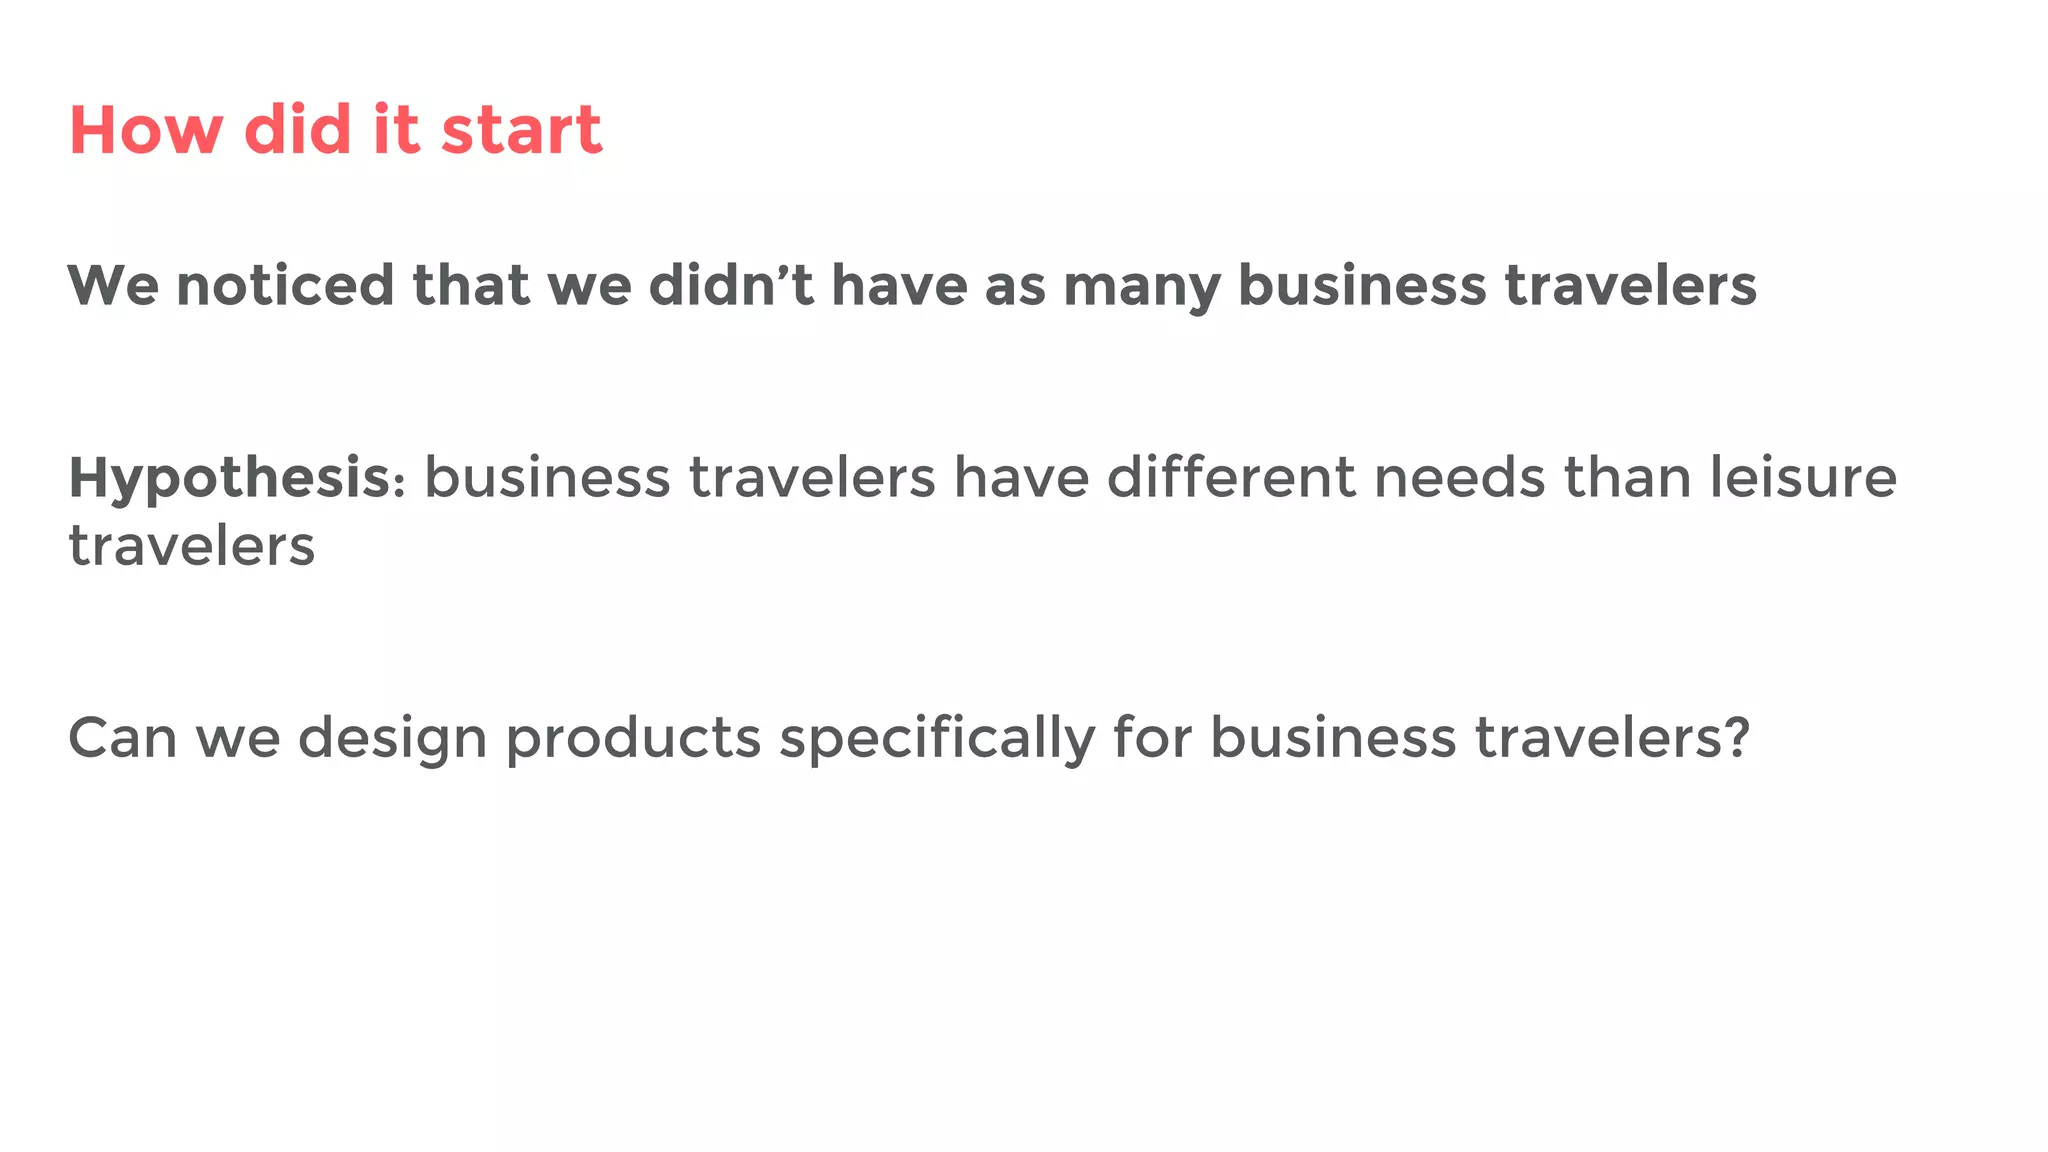


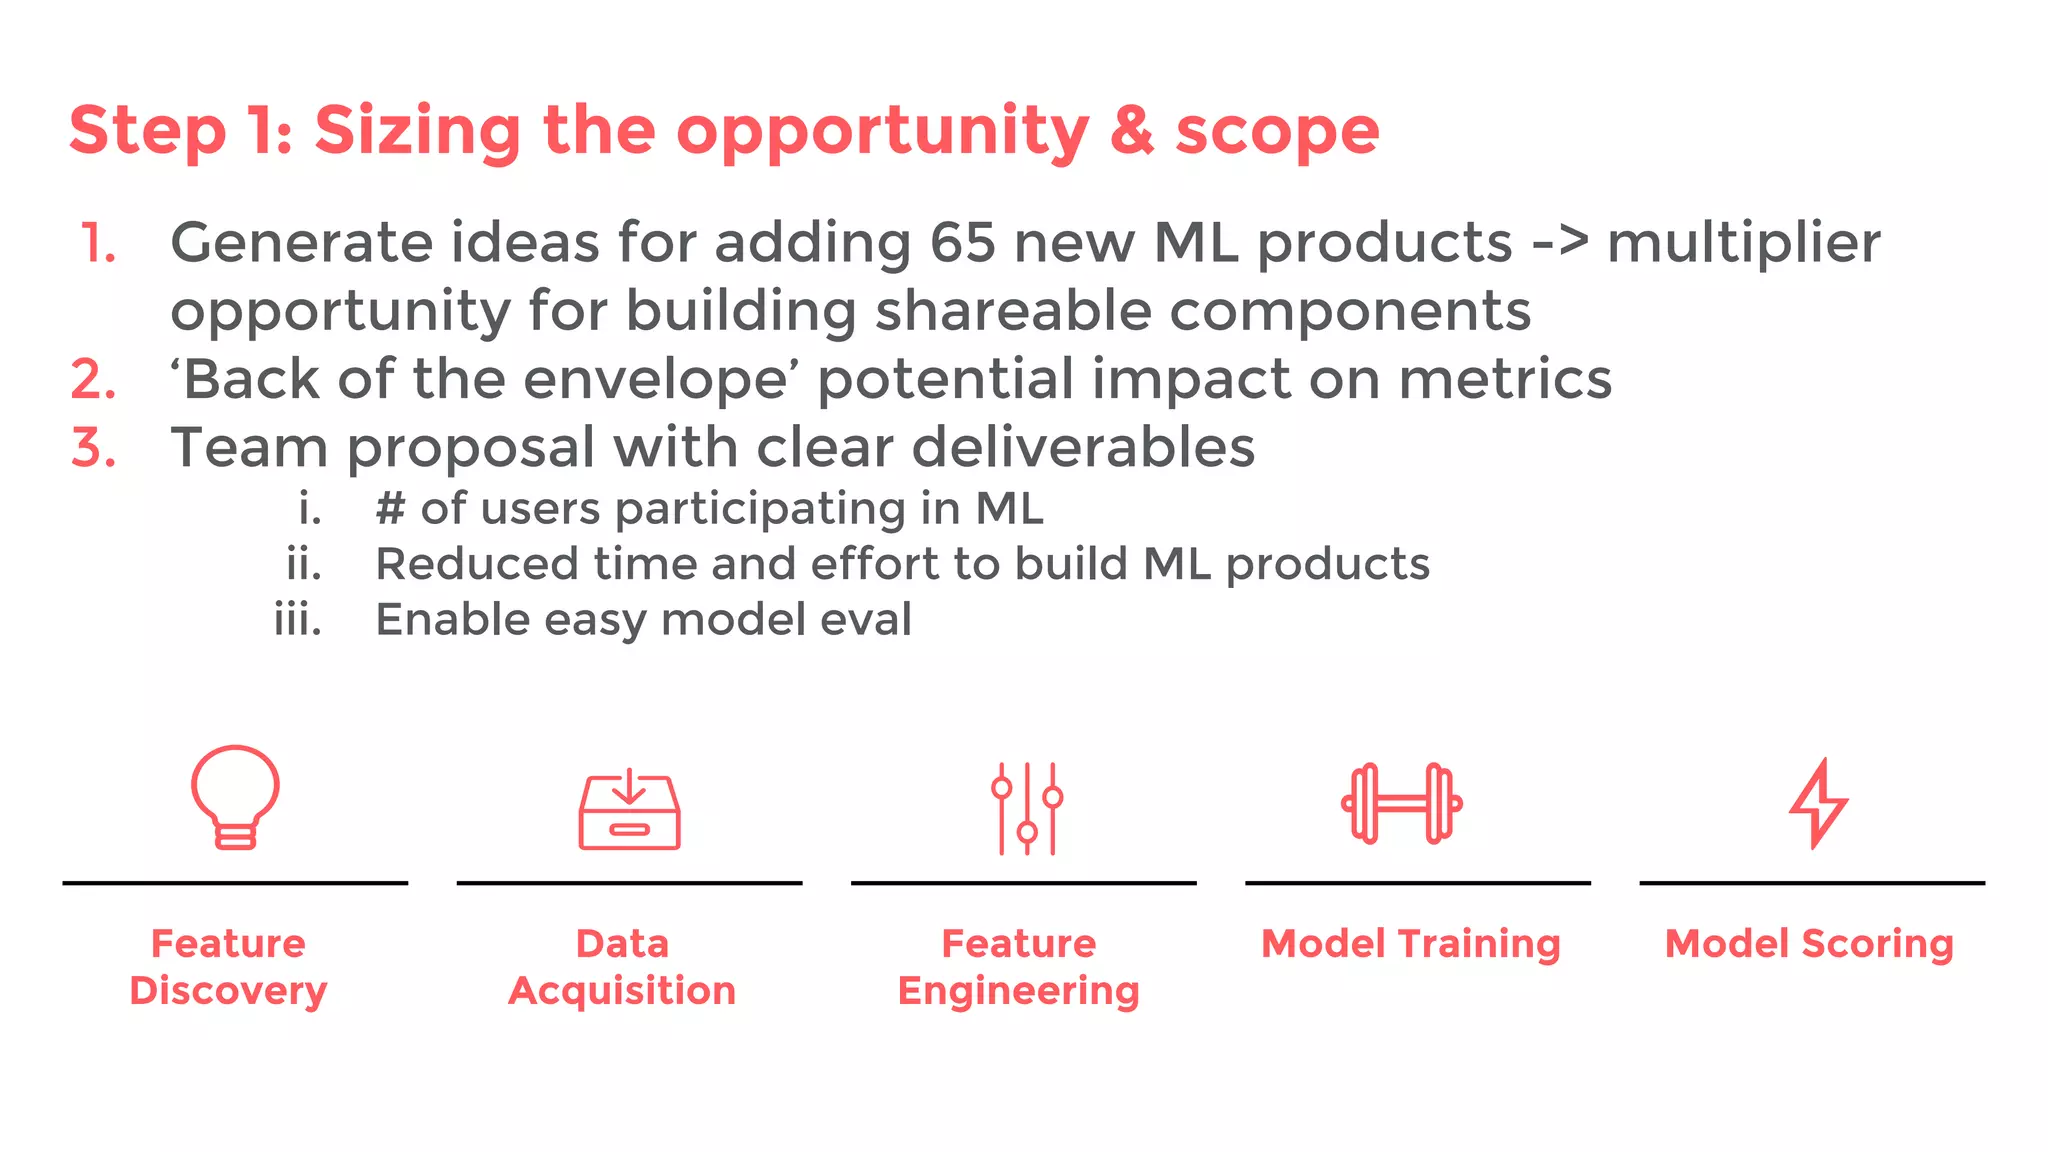
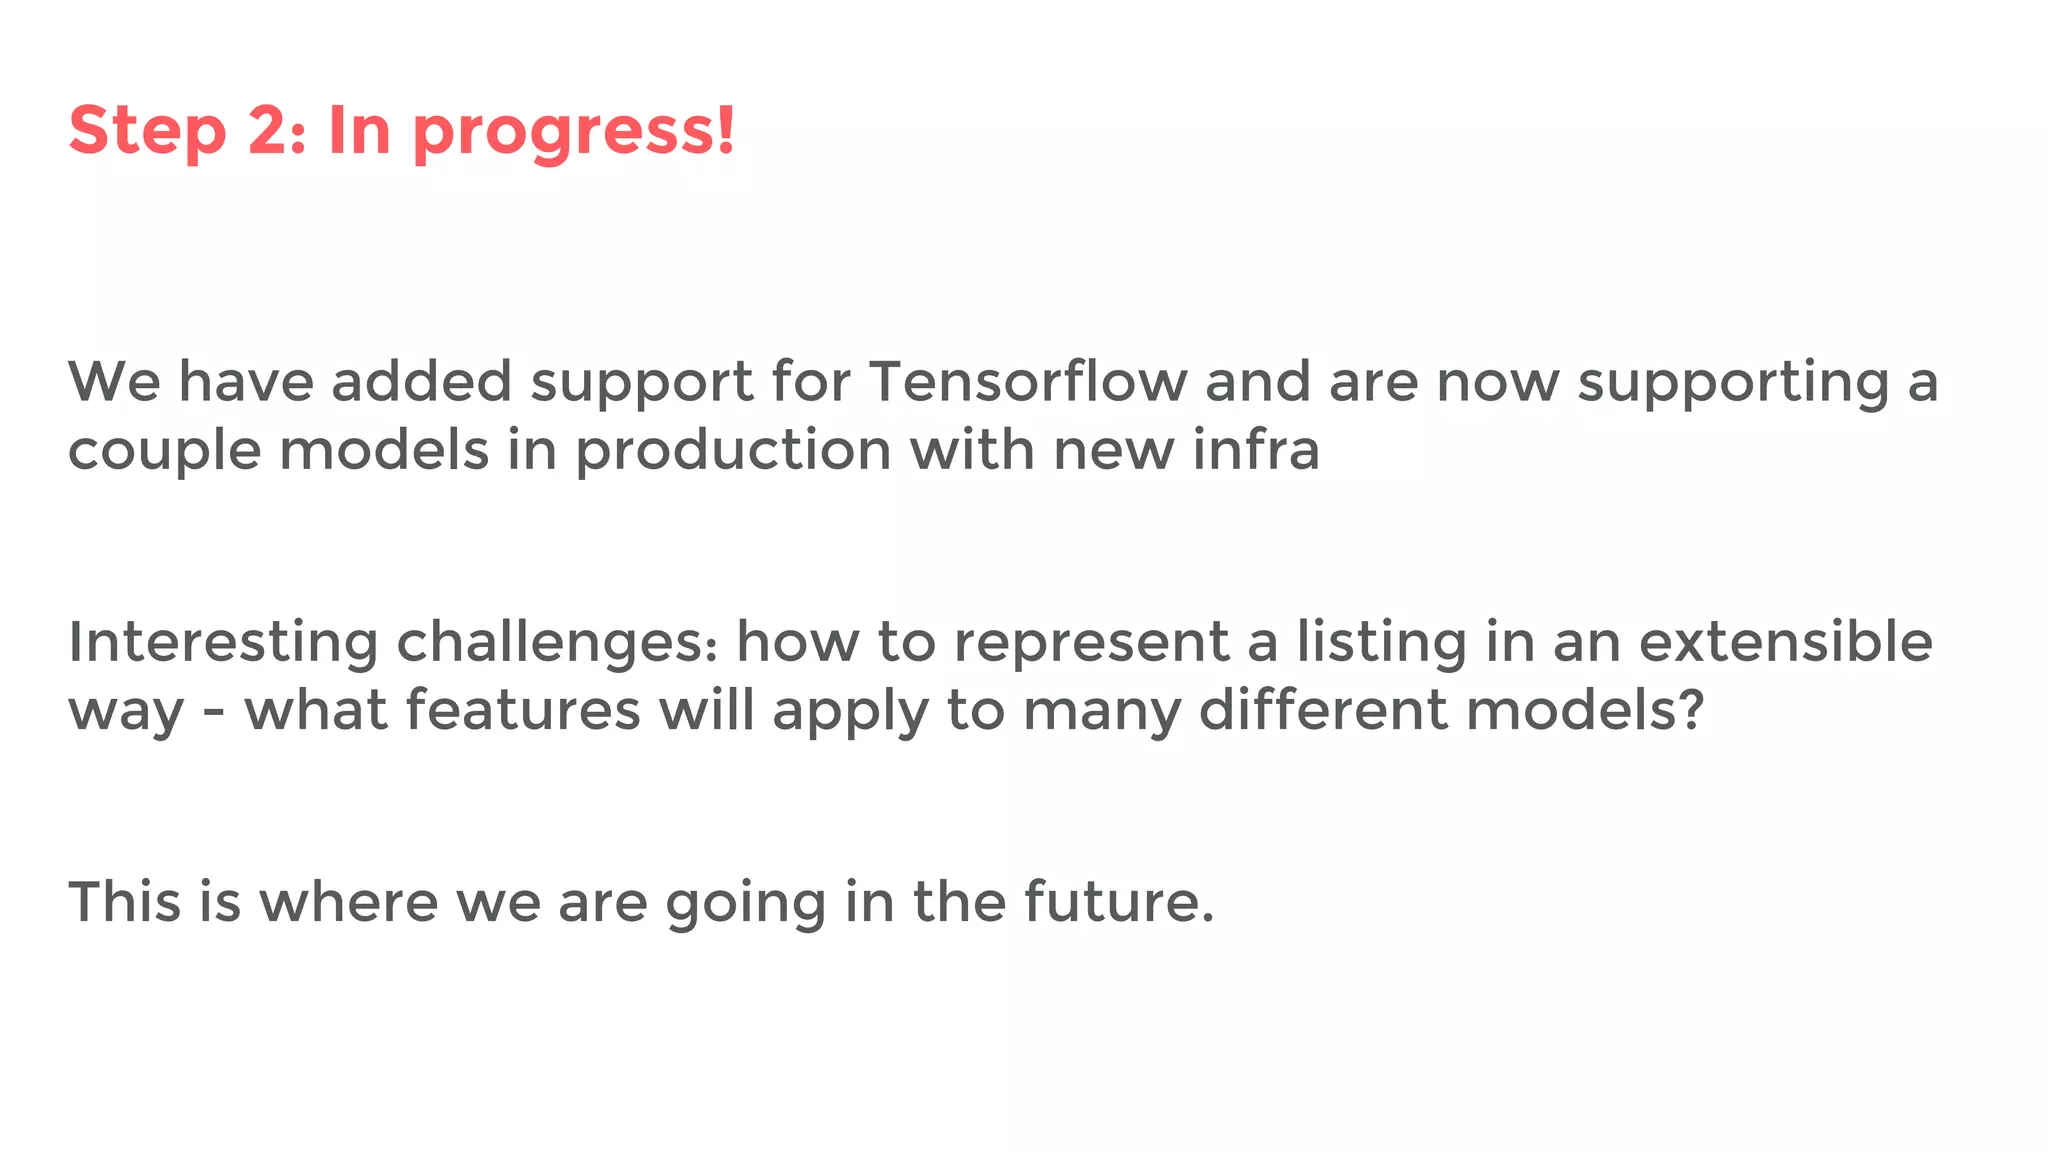
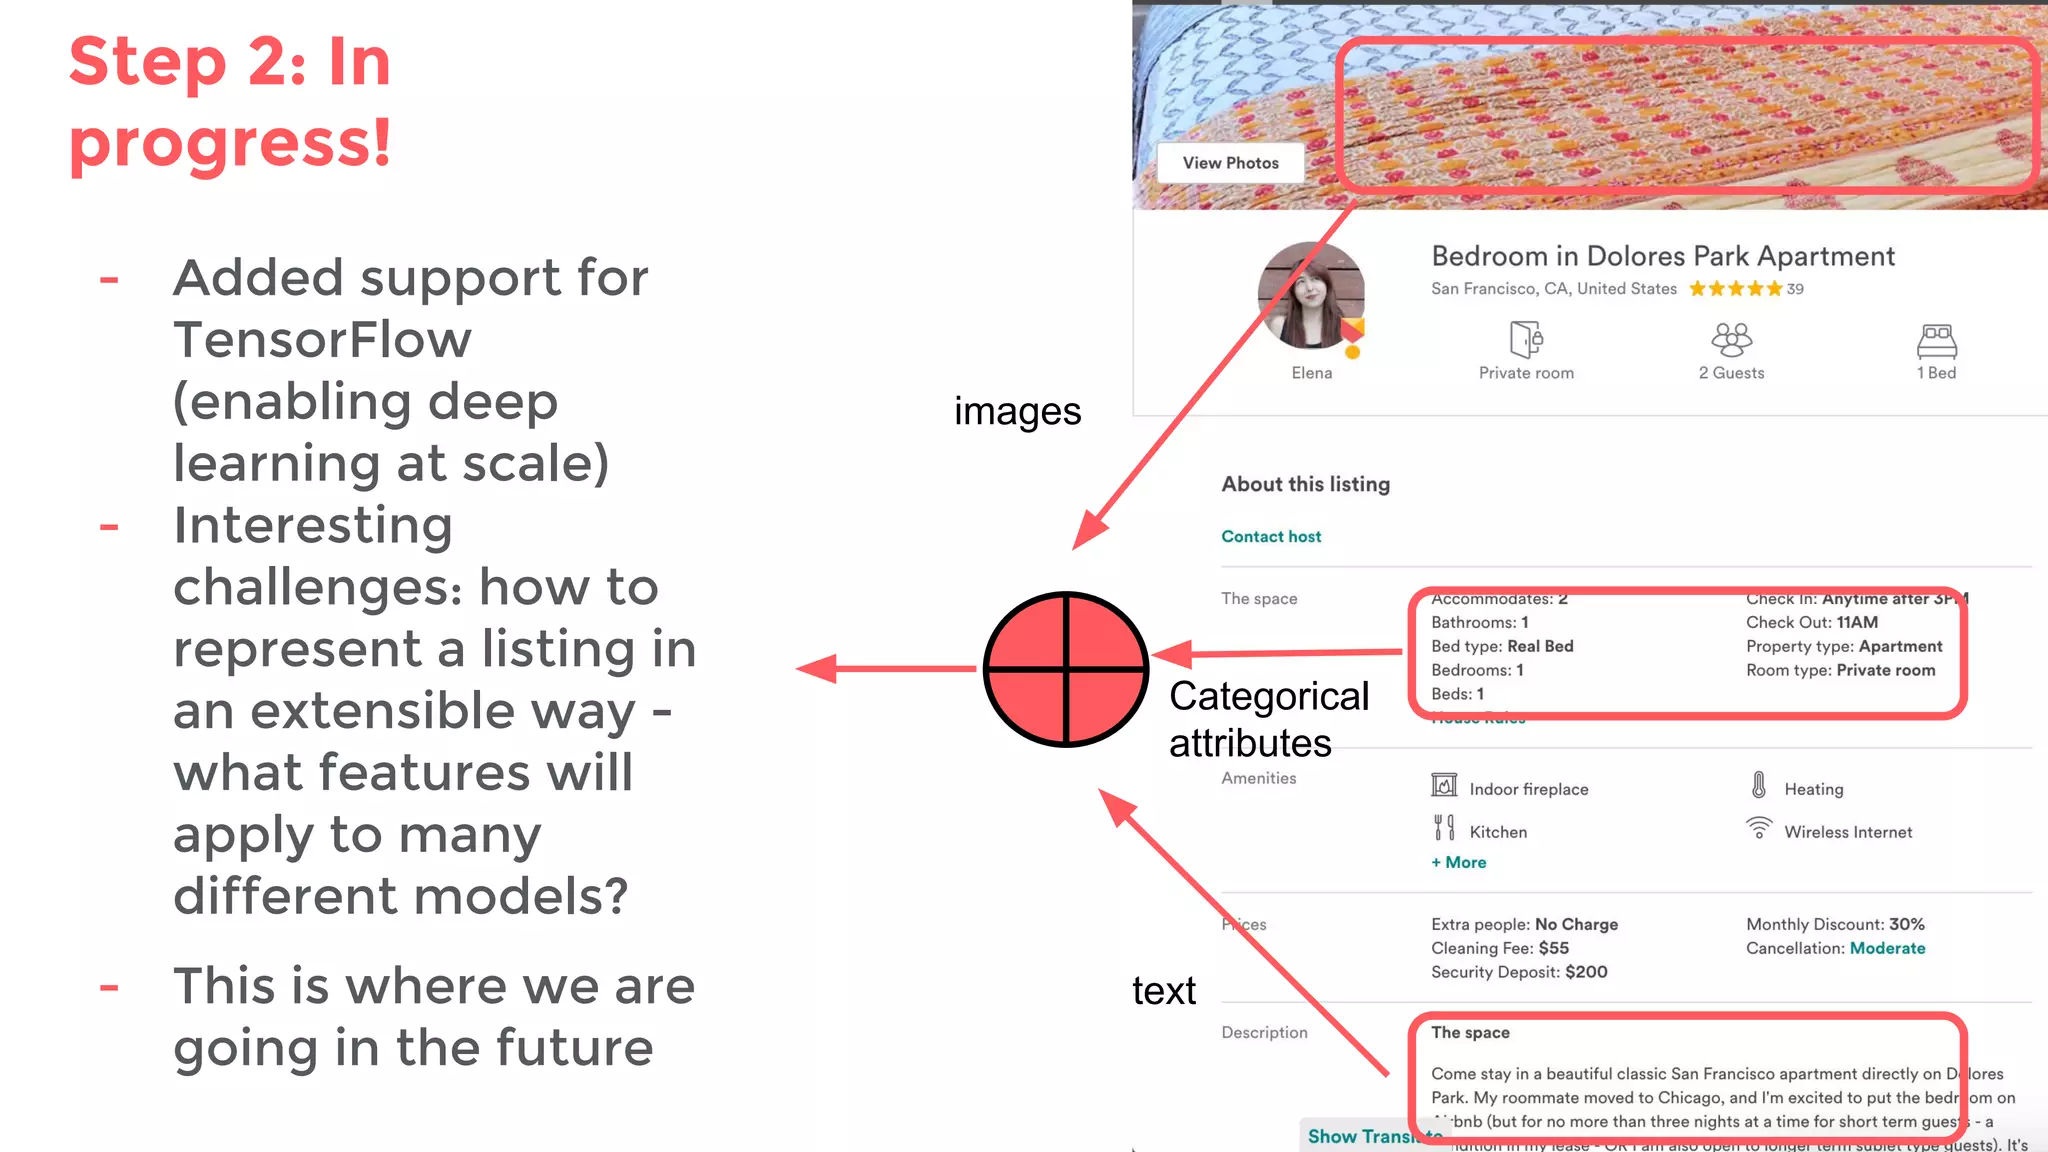
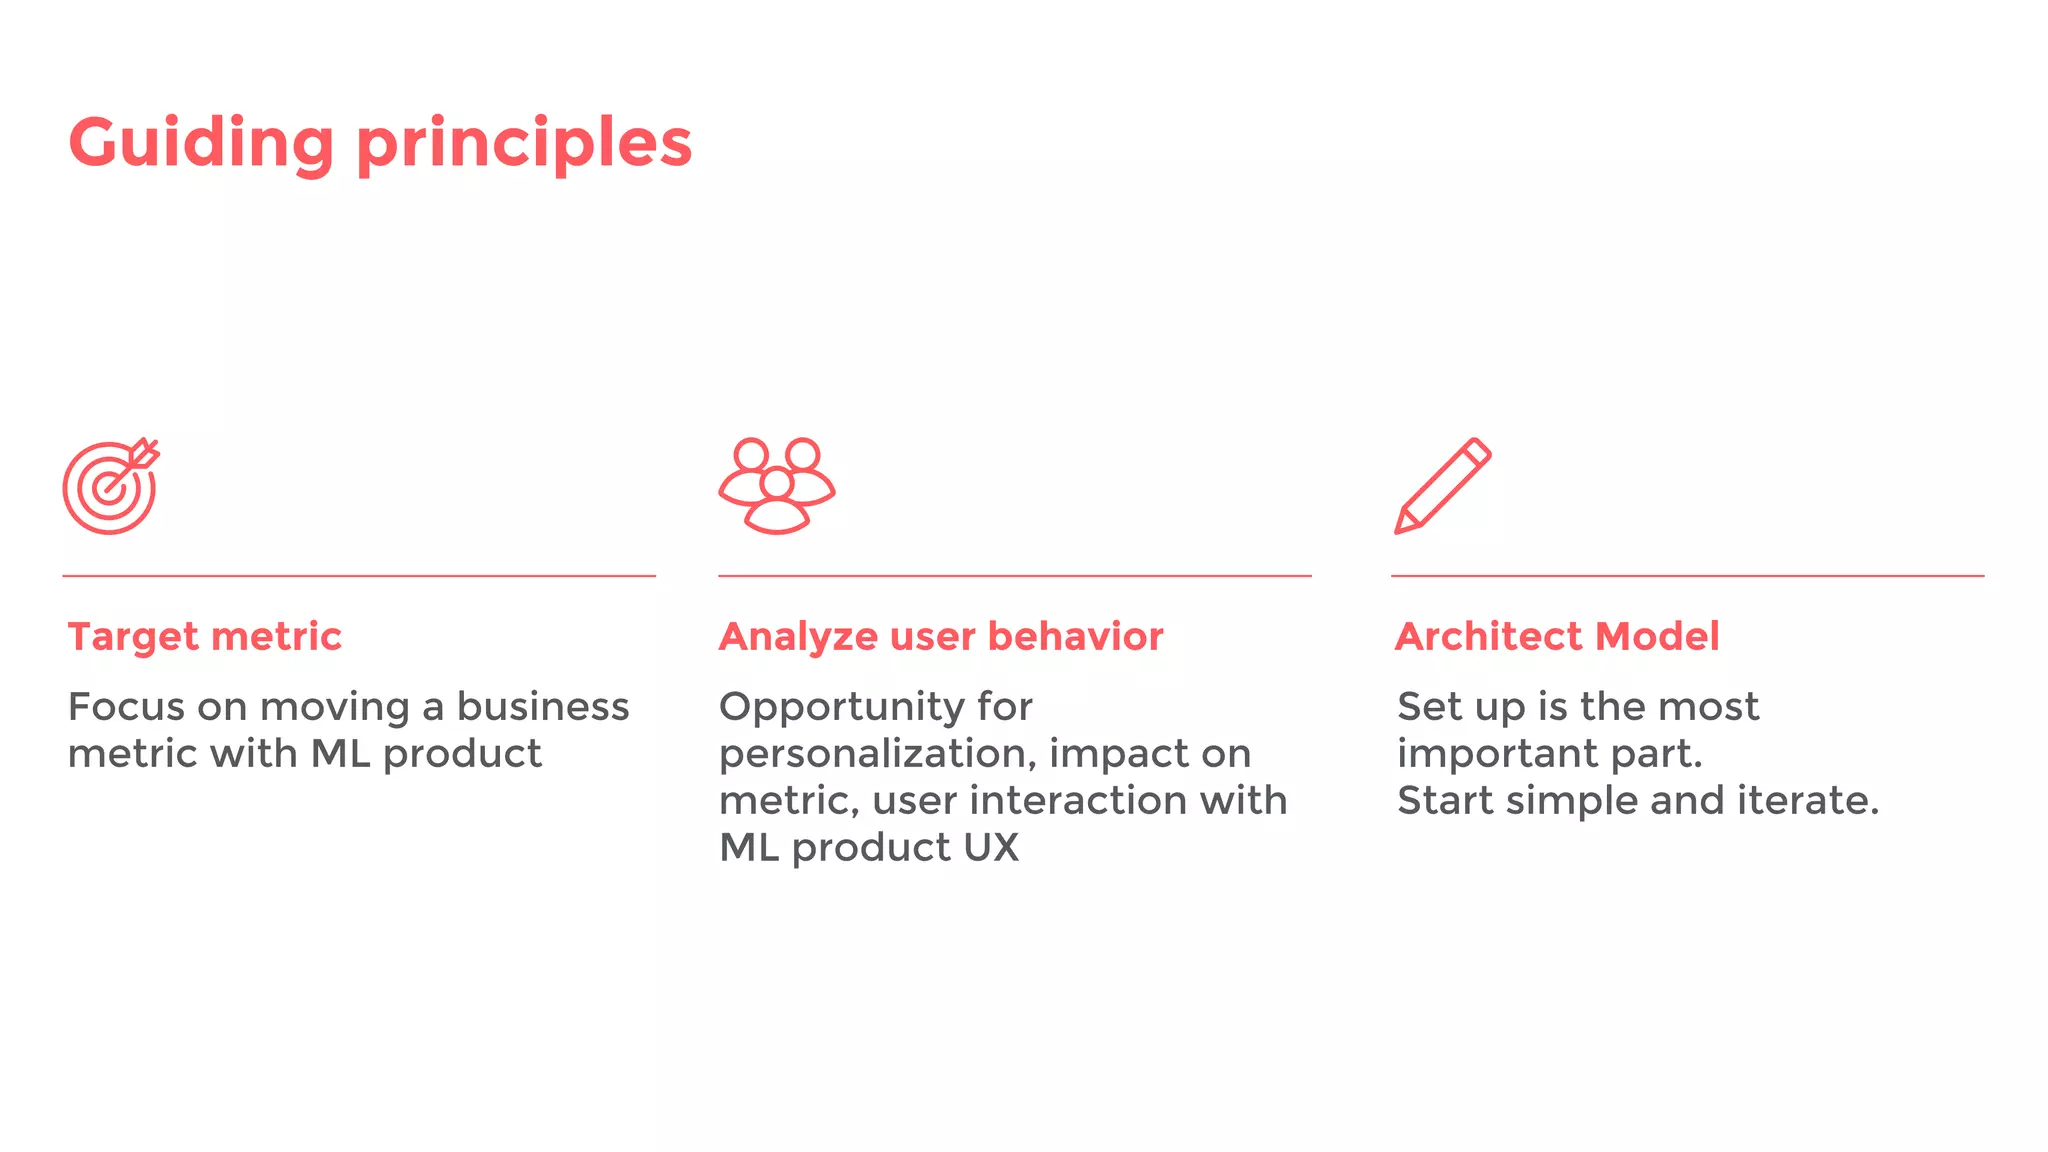


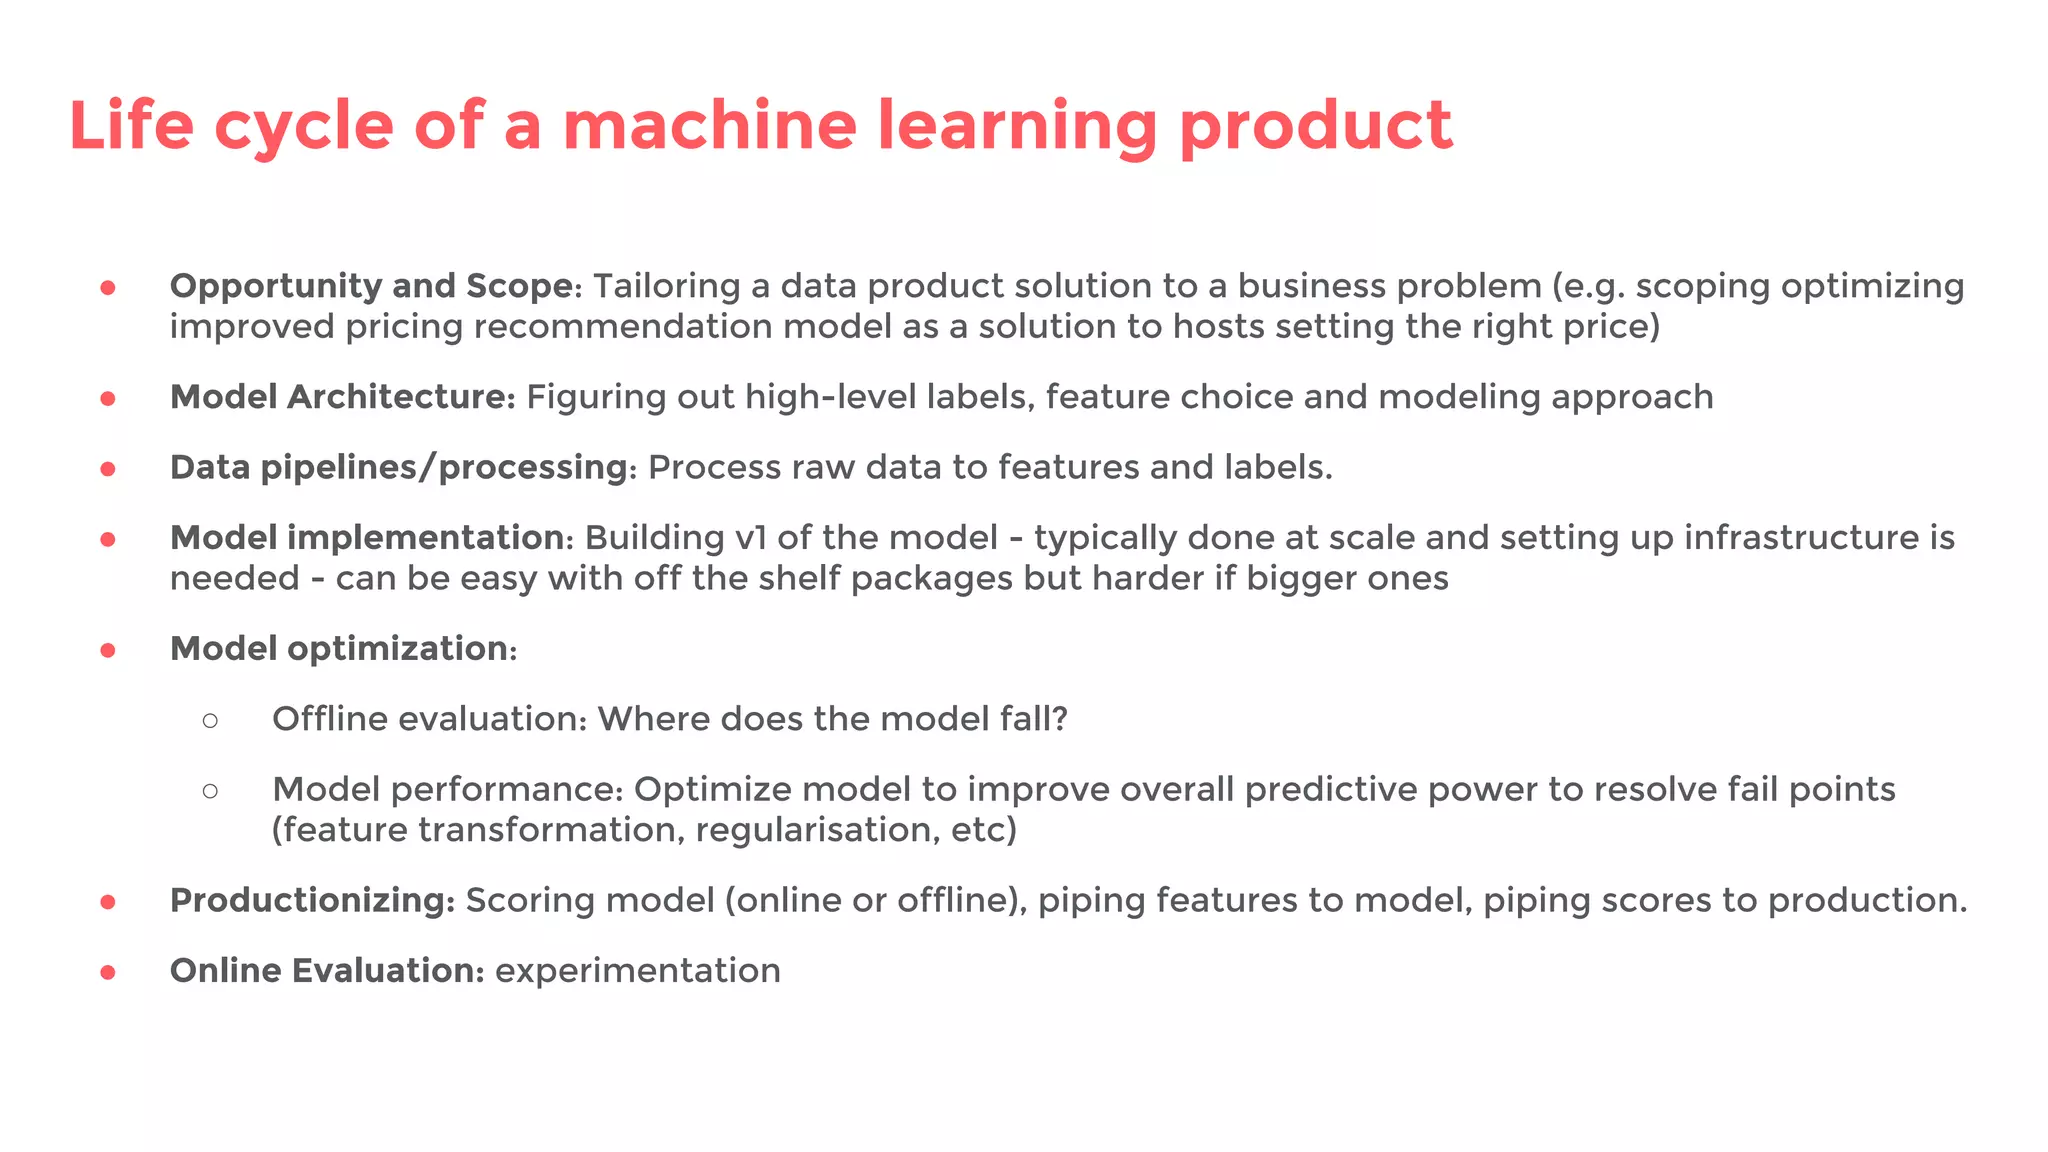
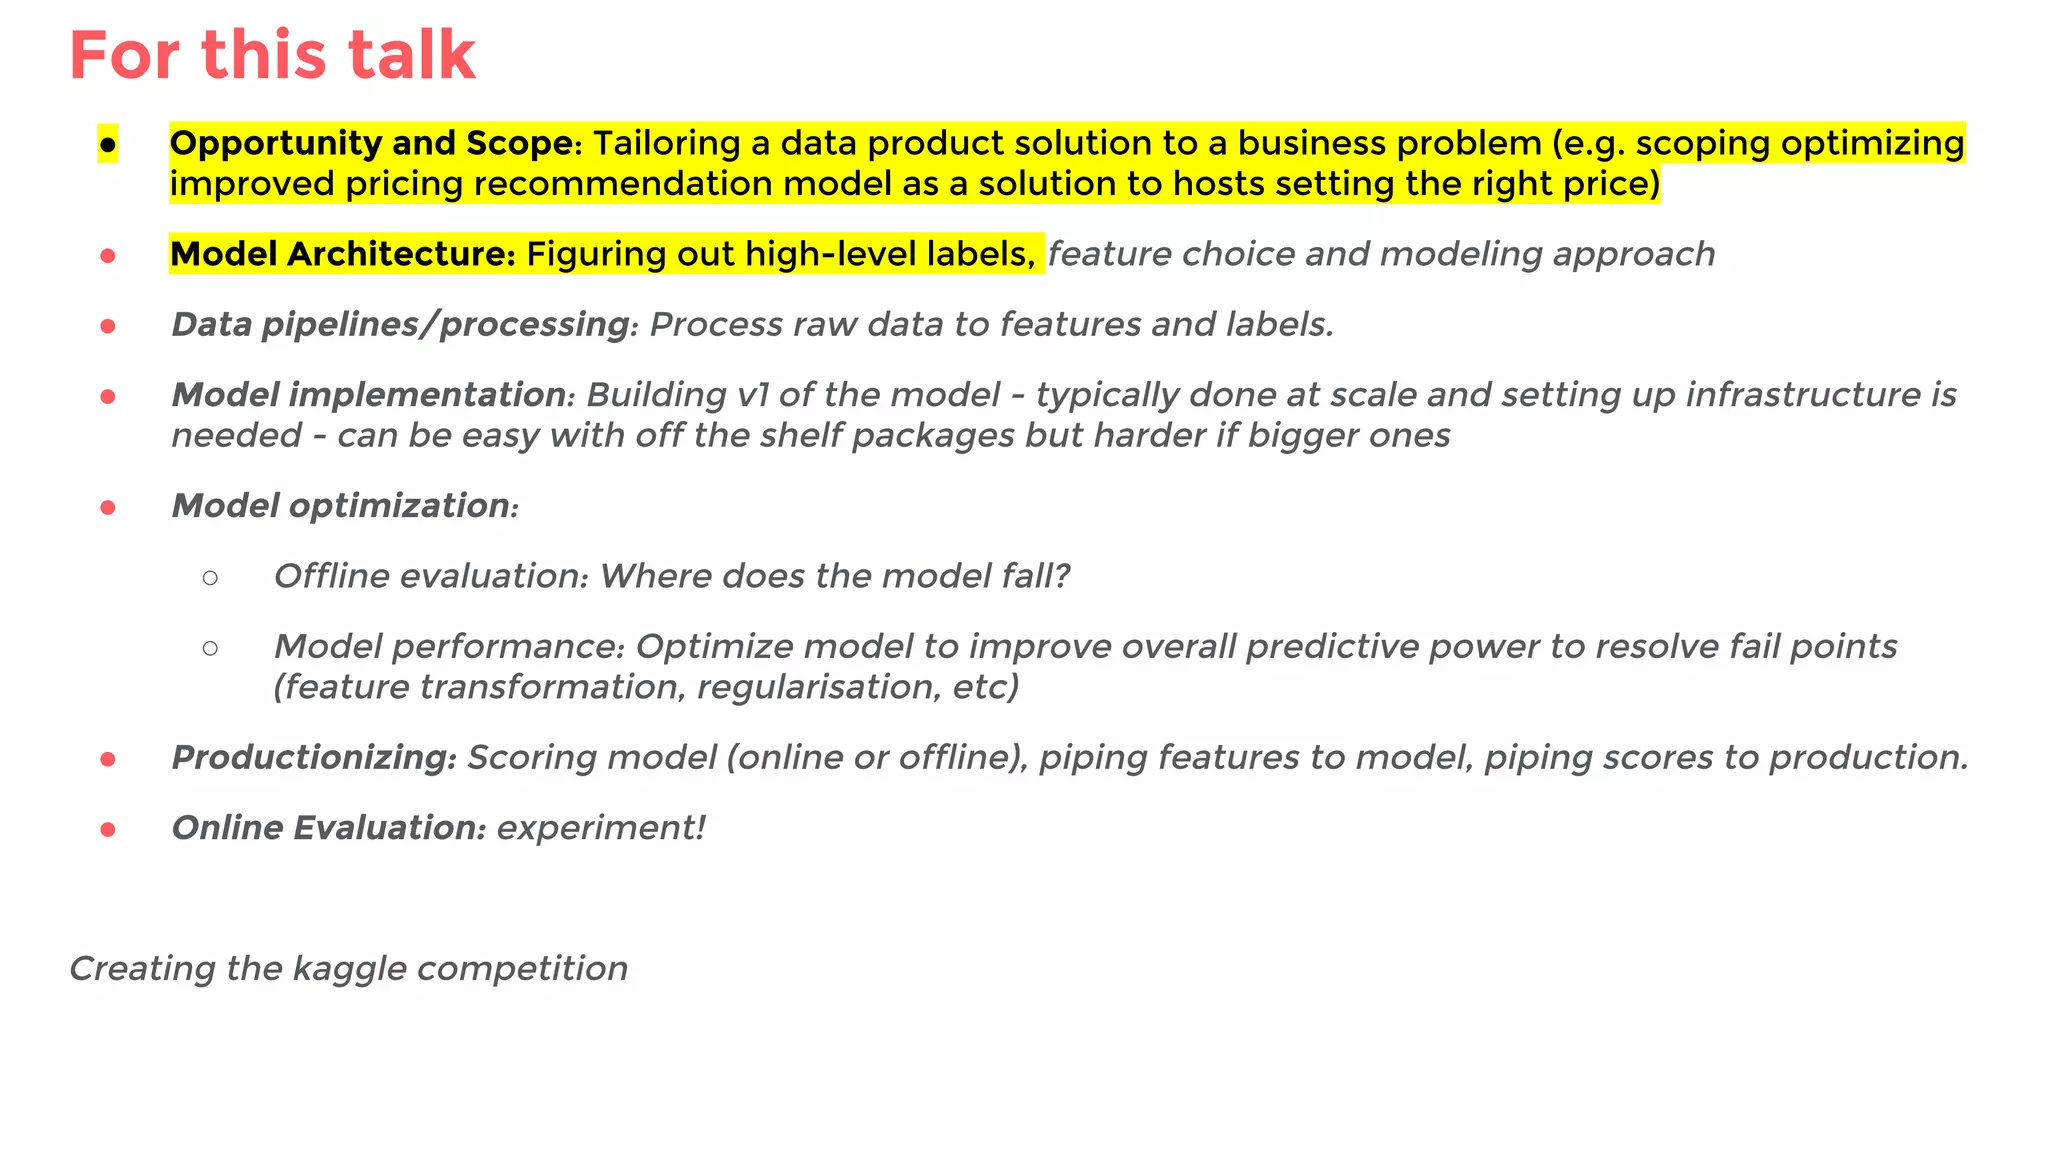

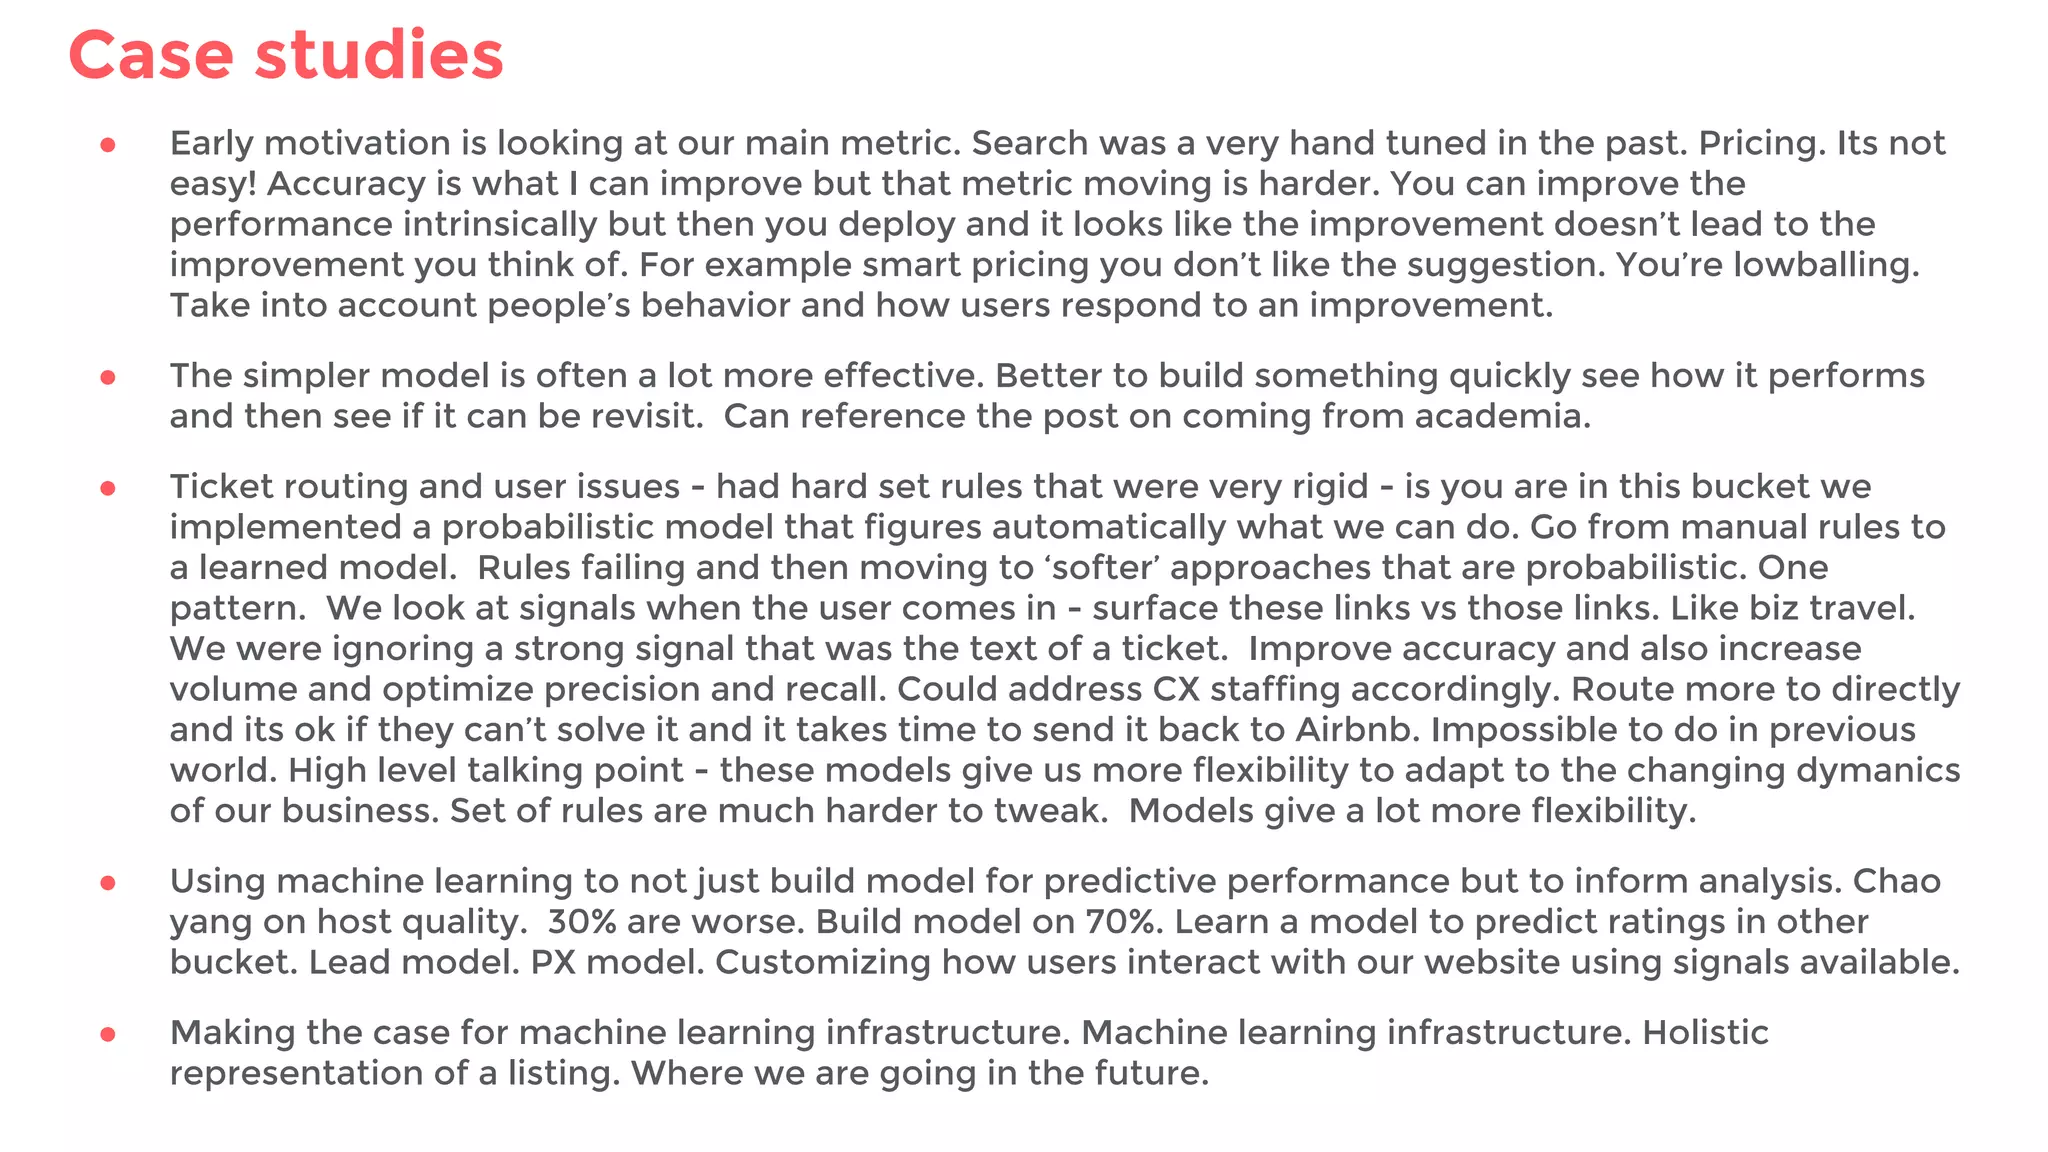


The document discusses the processes involved in developing machine learning products at Airbnb, emphasizing the importance of personalization and the careful formulation of problems before implementation. It covers various stages such as opportunity sizing, model architecture, data processing, and the need for a well-defined target metric that aligns with business outcomes. Key learnings highlight the significance of understanding user behavior and optimizing for various business metrics when designing machine learning solutions.