1) The document presents a new approach to jointly inverting gravity and magnetic data with geological constraints using 3D modeling.
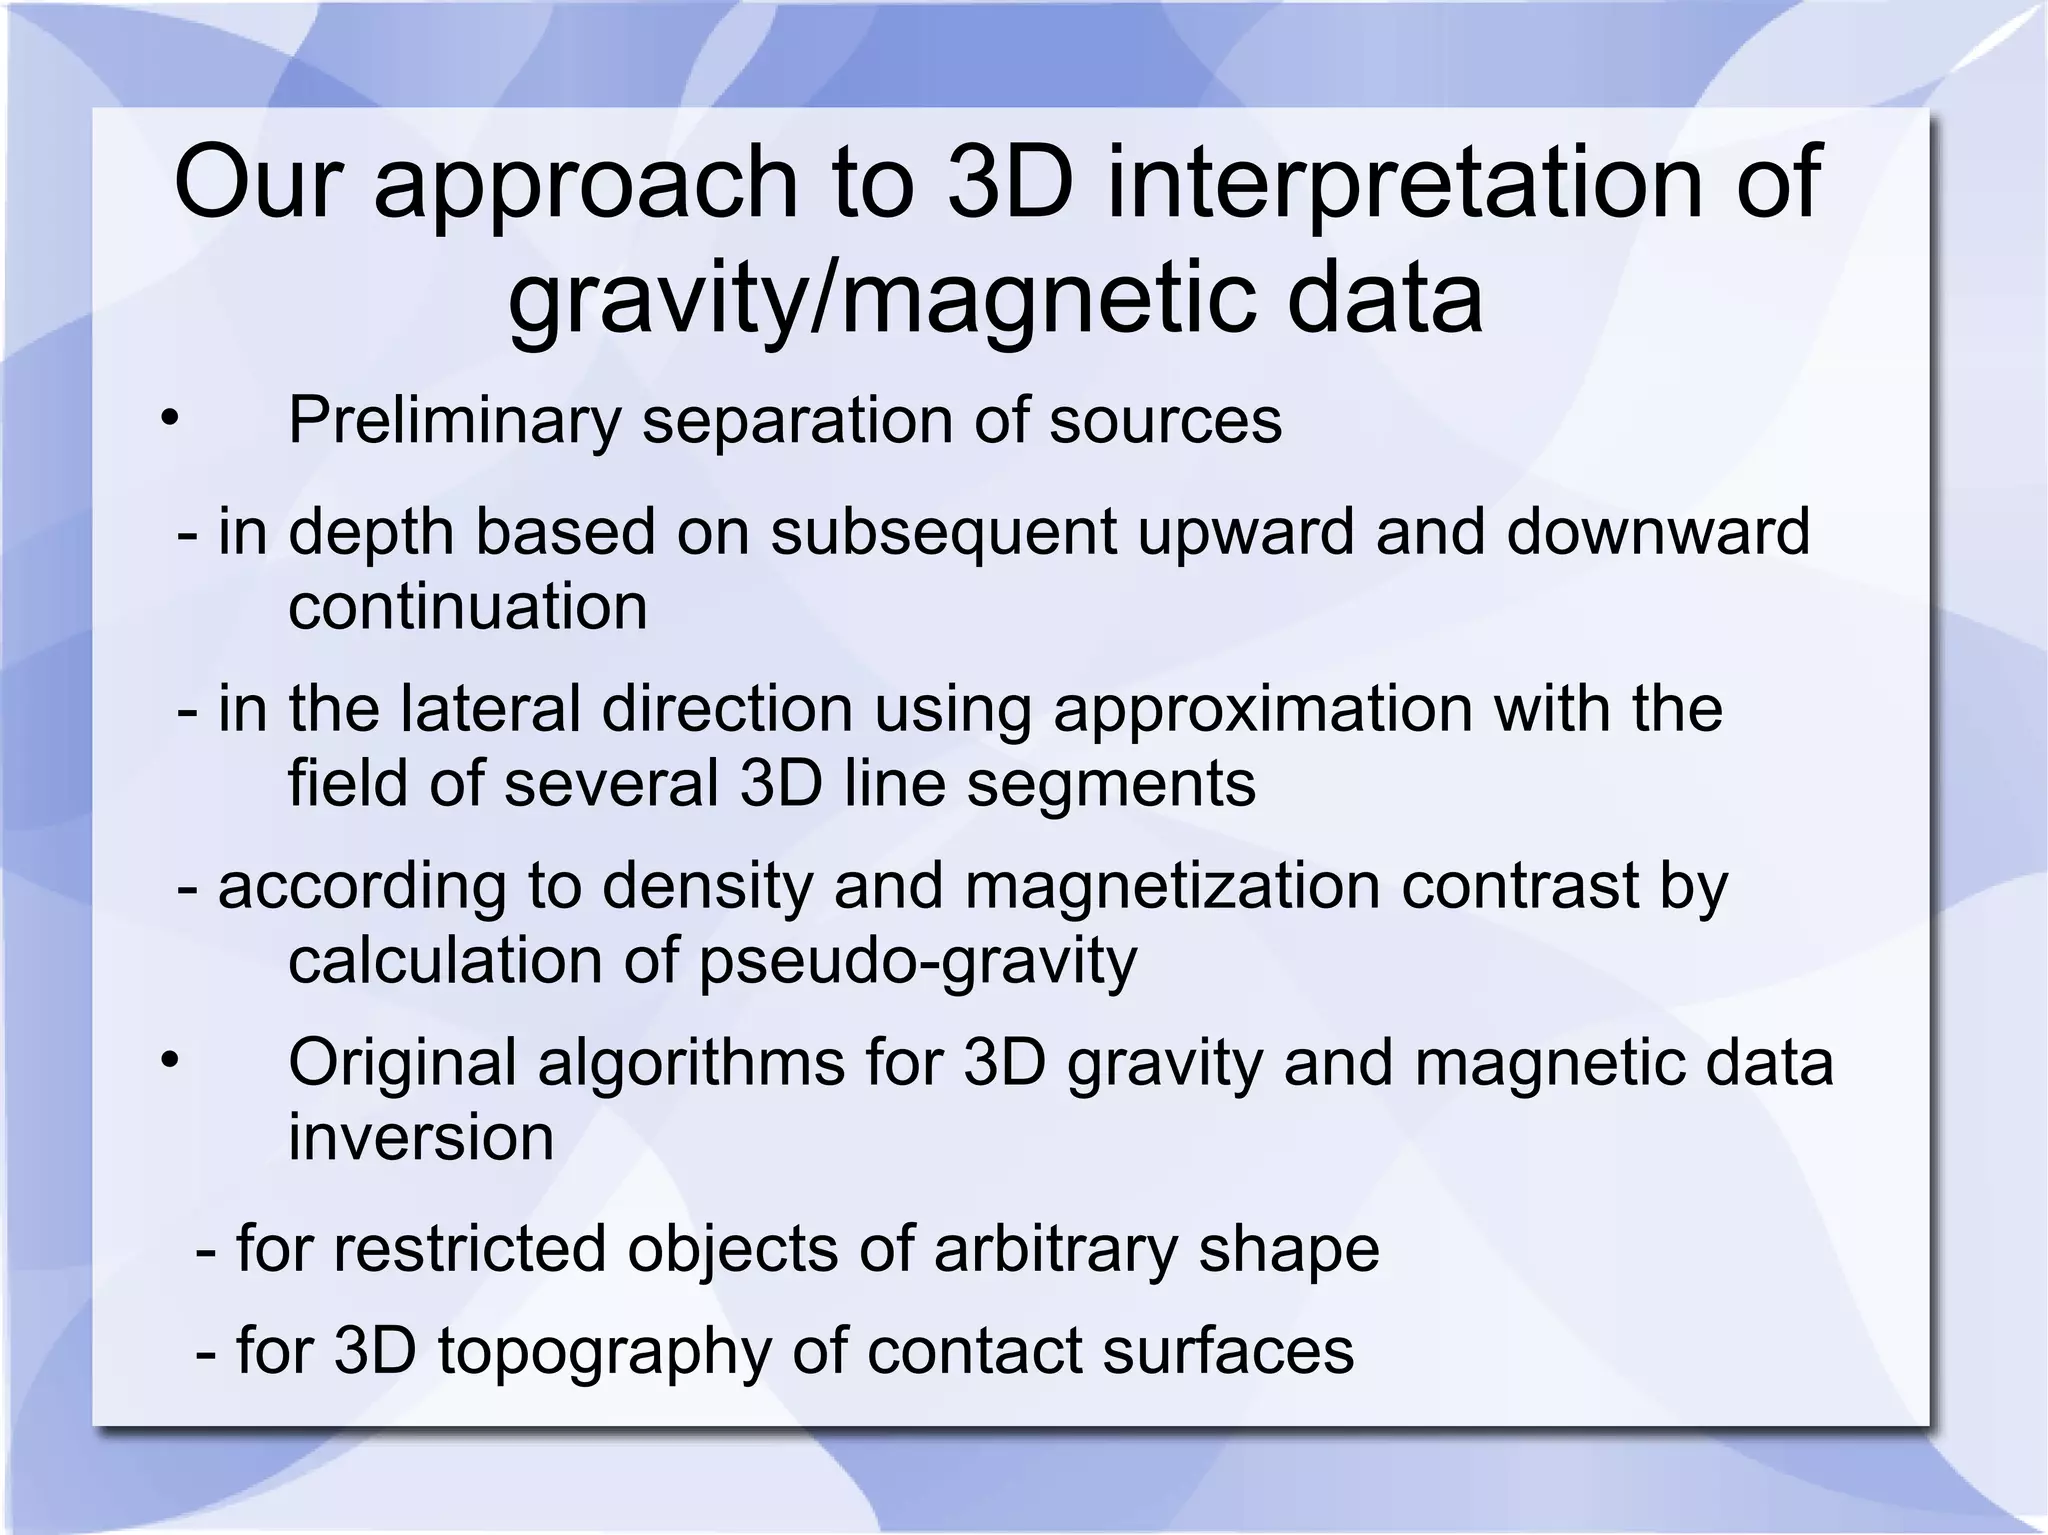
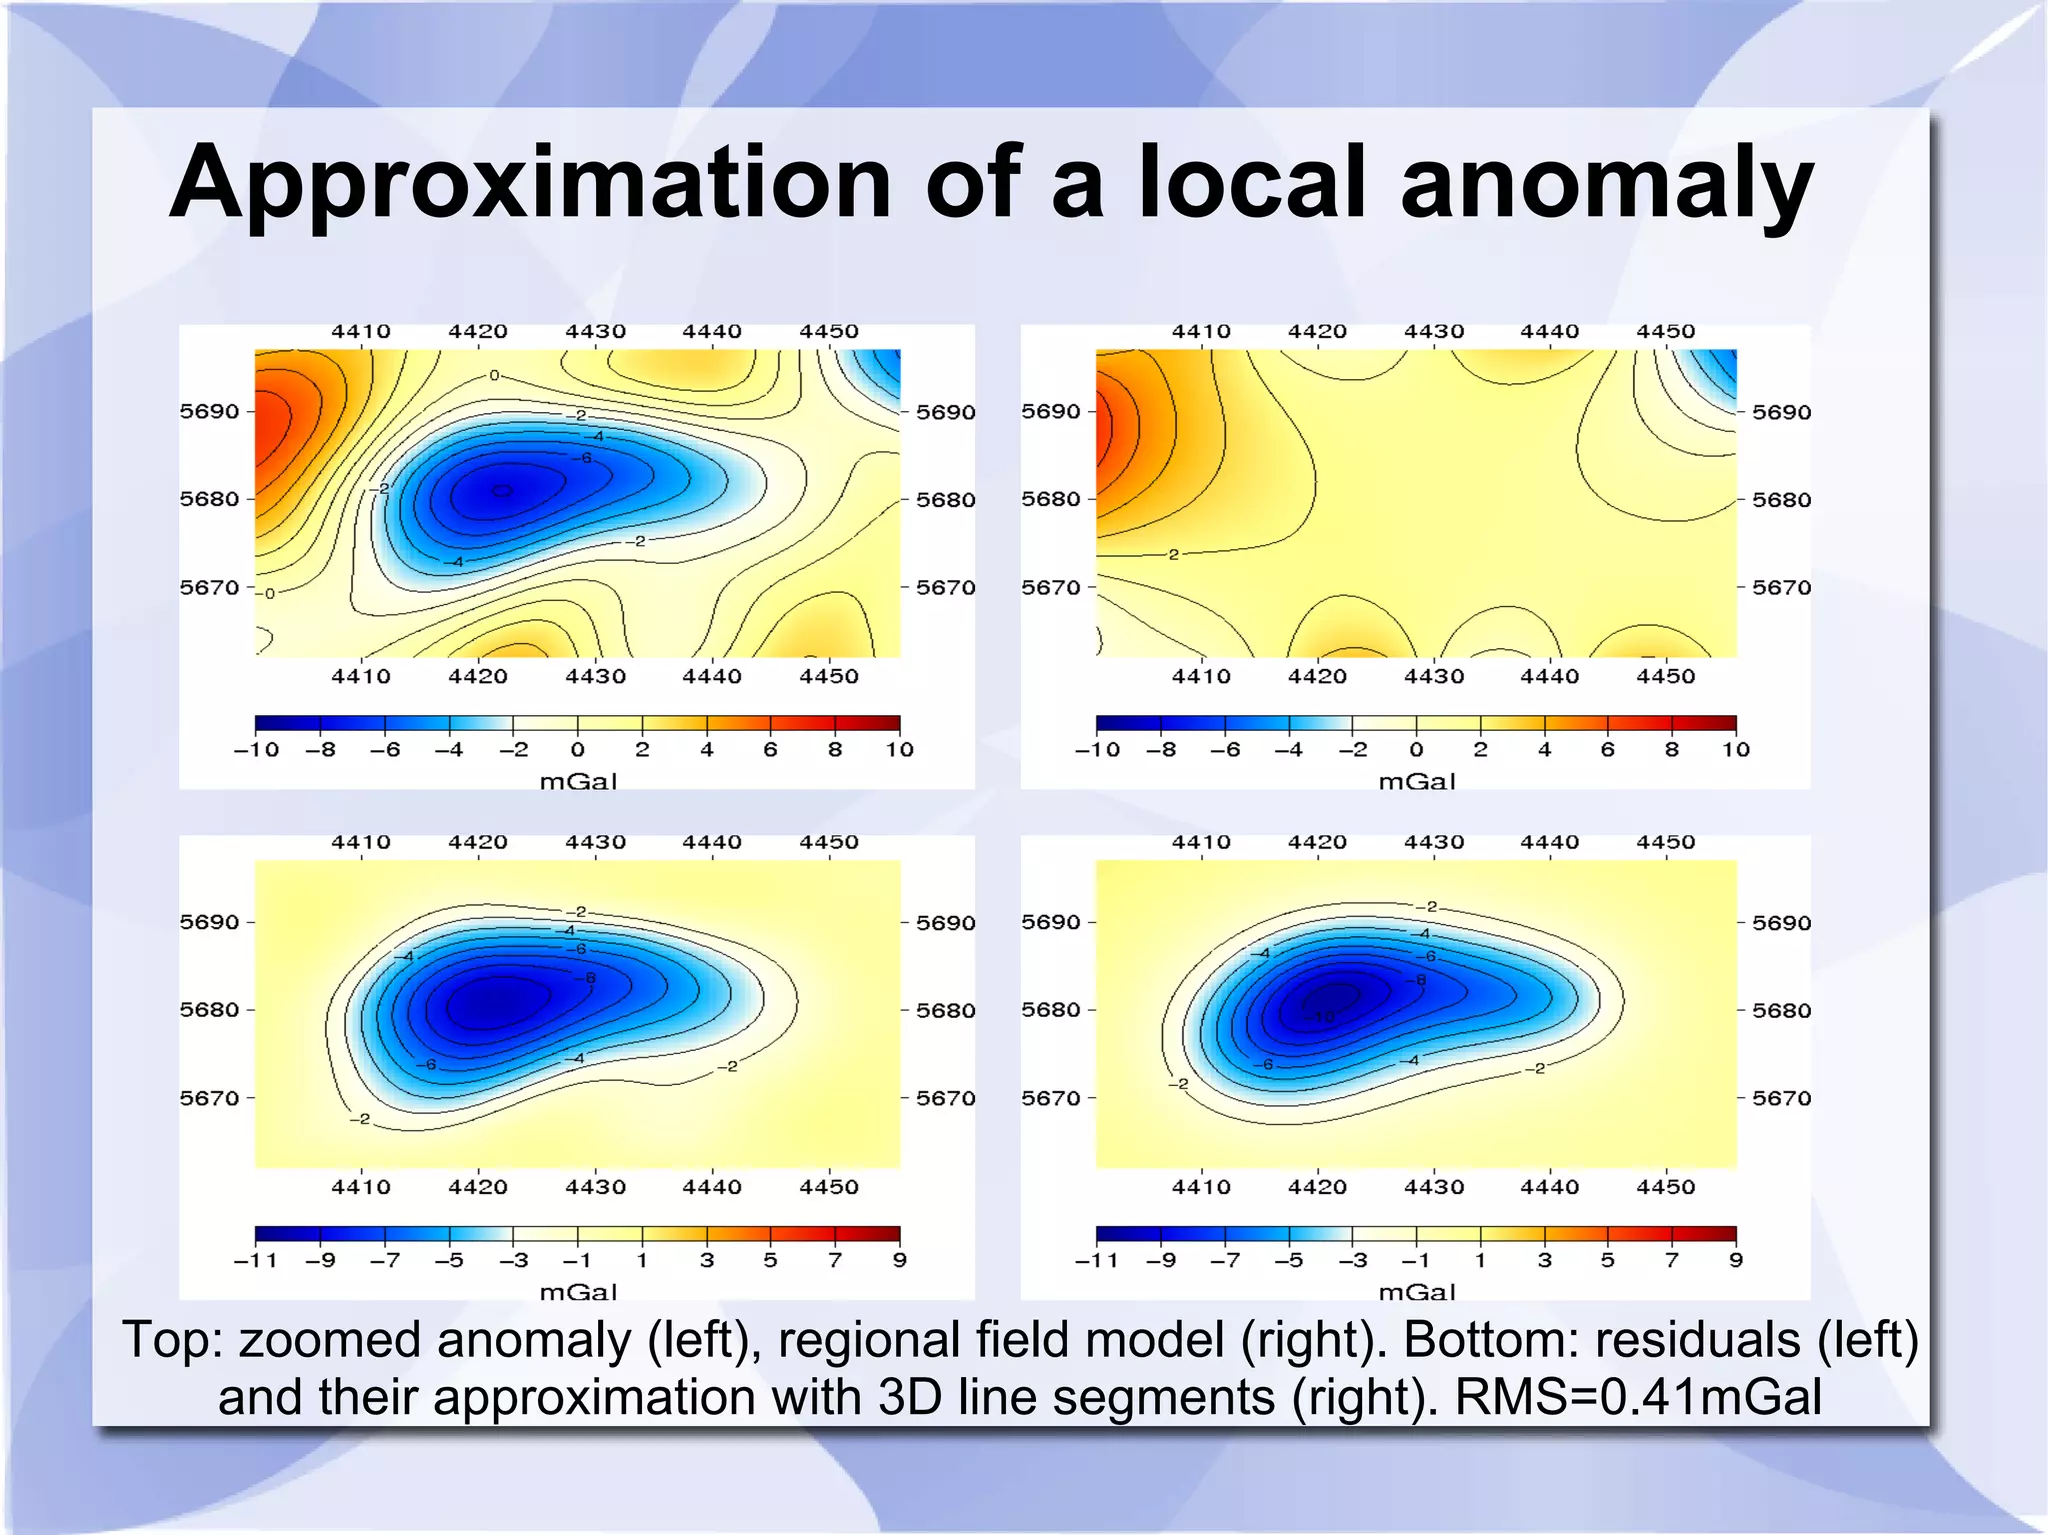
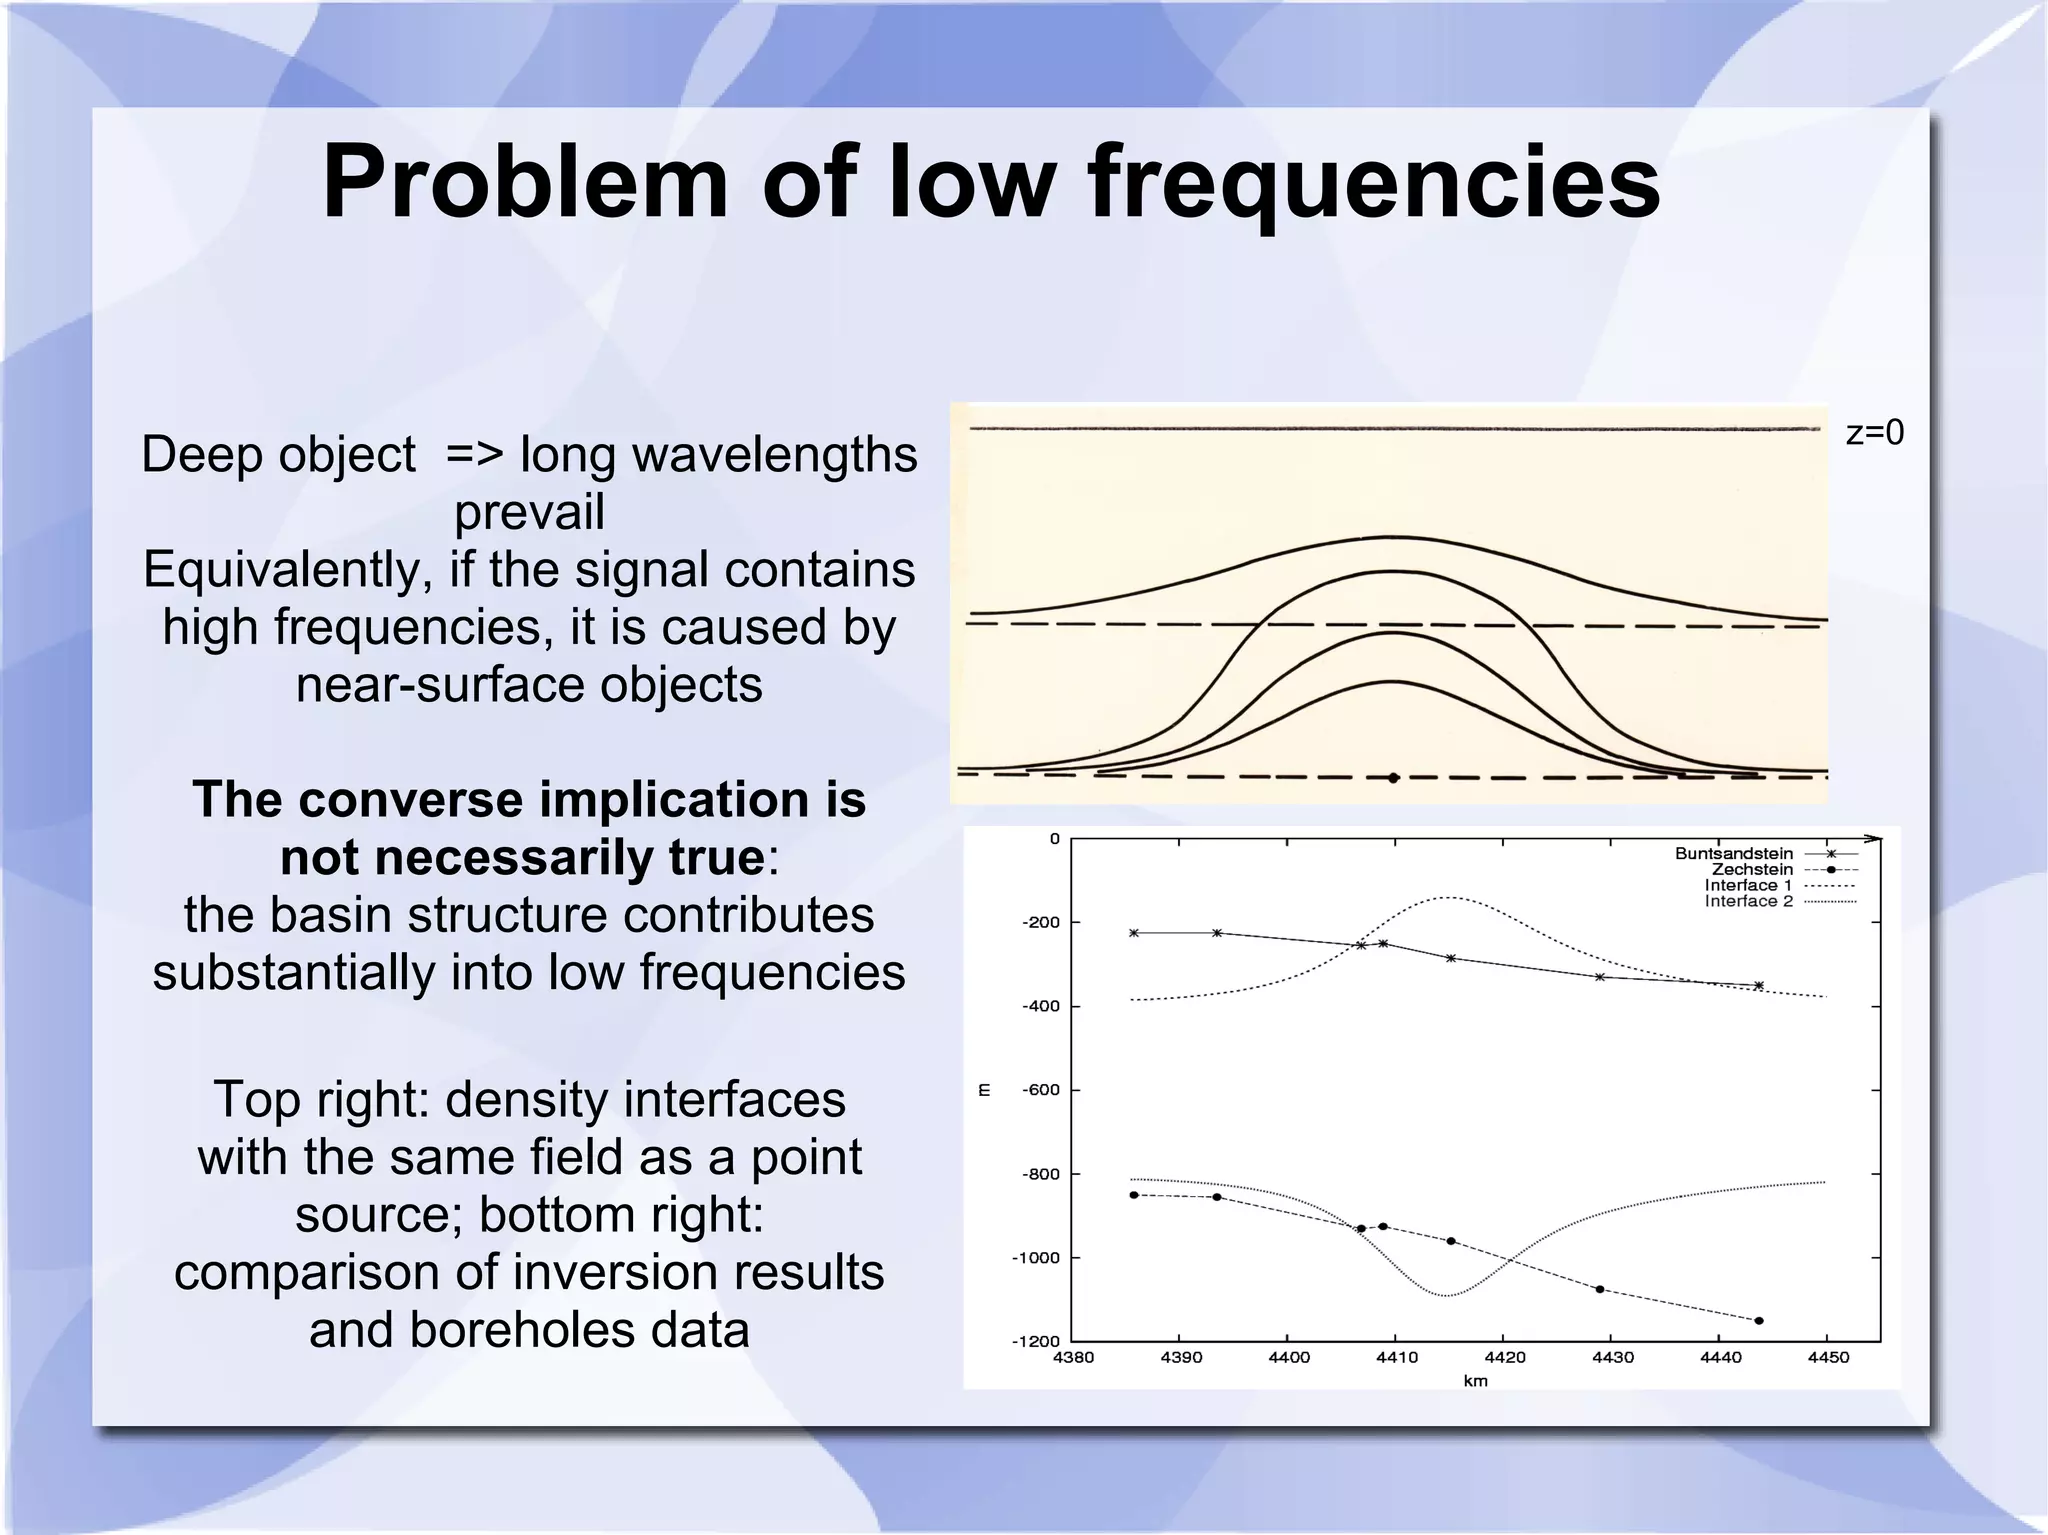
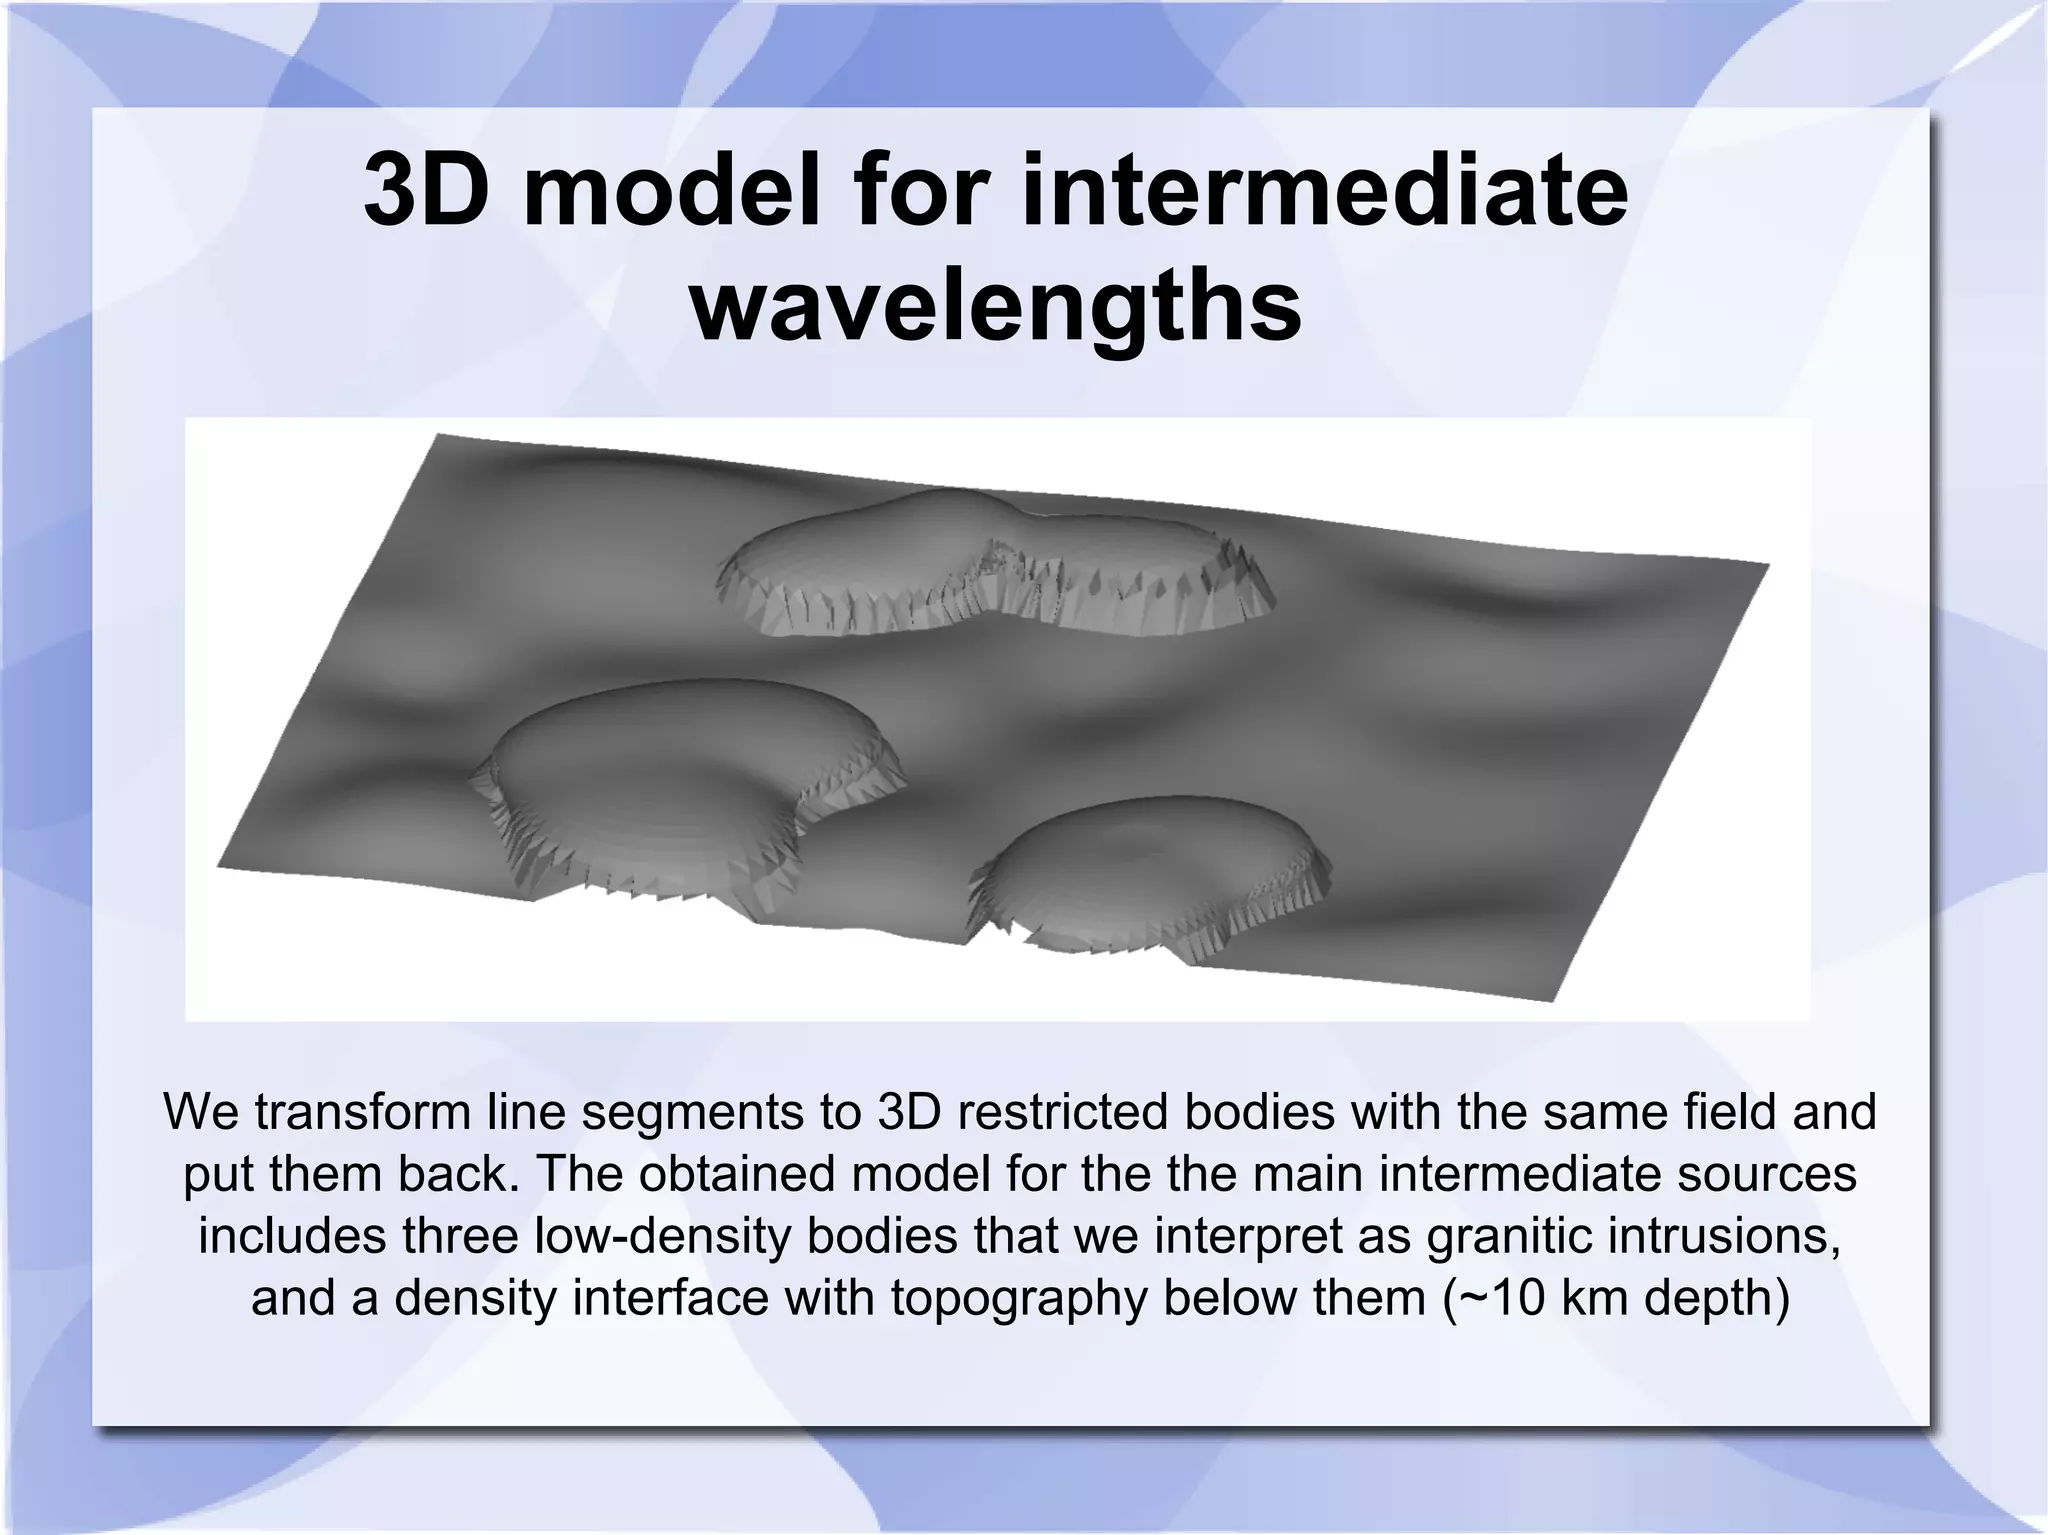
2) Preliminary steps include separating sources by depth, laterally, and based on density/magnetization contrasts. Original algorithms allow inverting for 3D shapes of interfaces and restricted bodies.
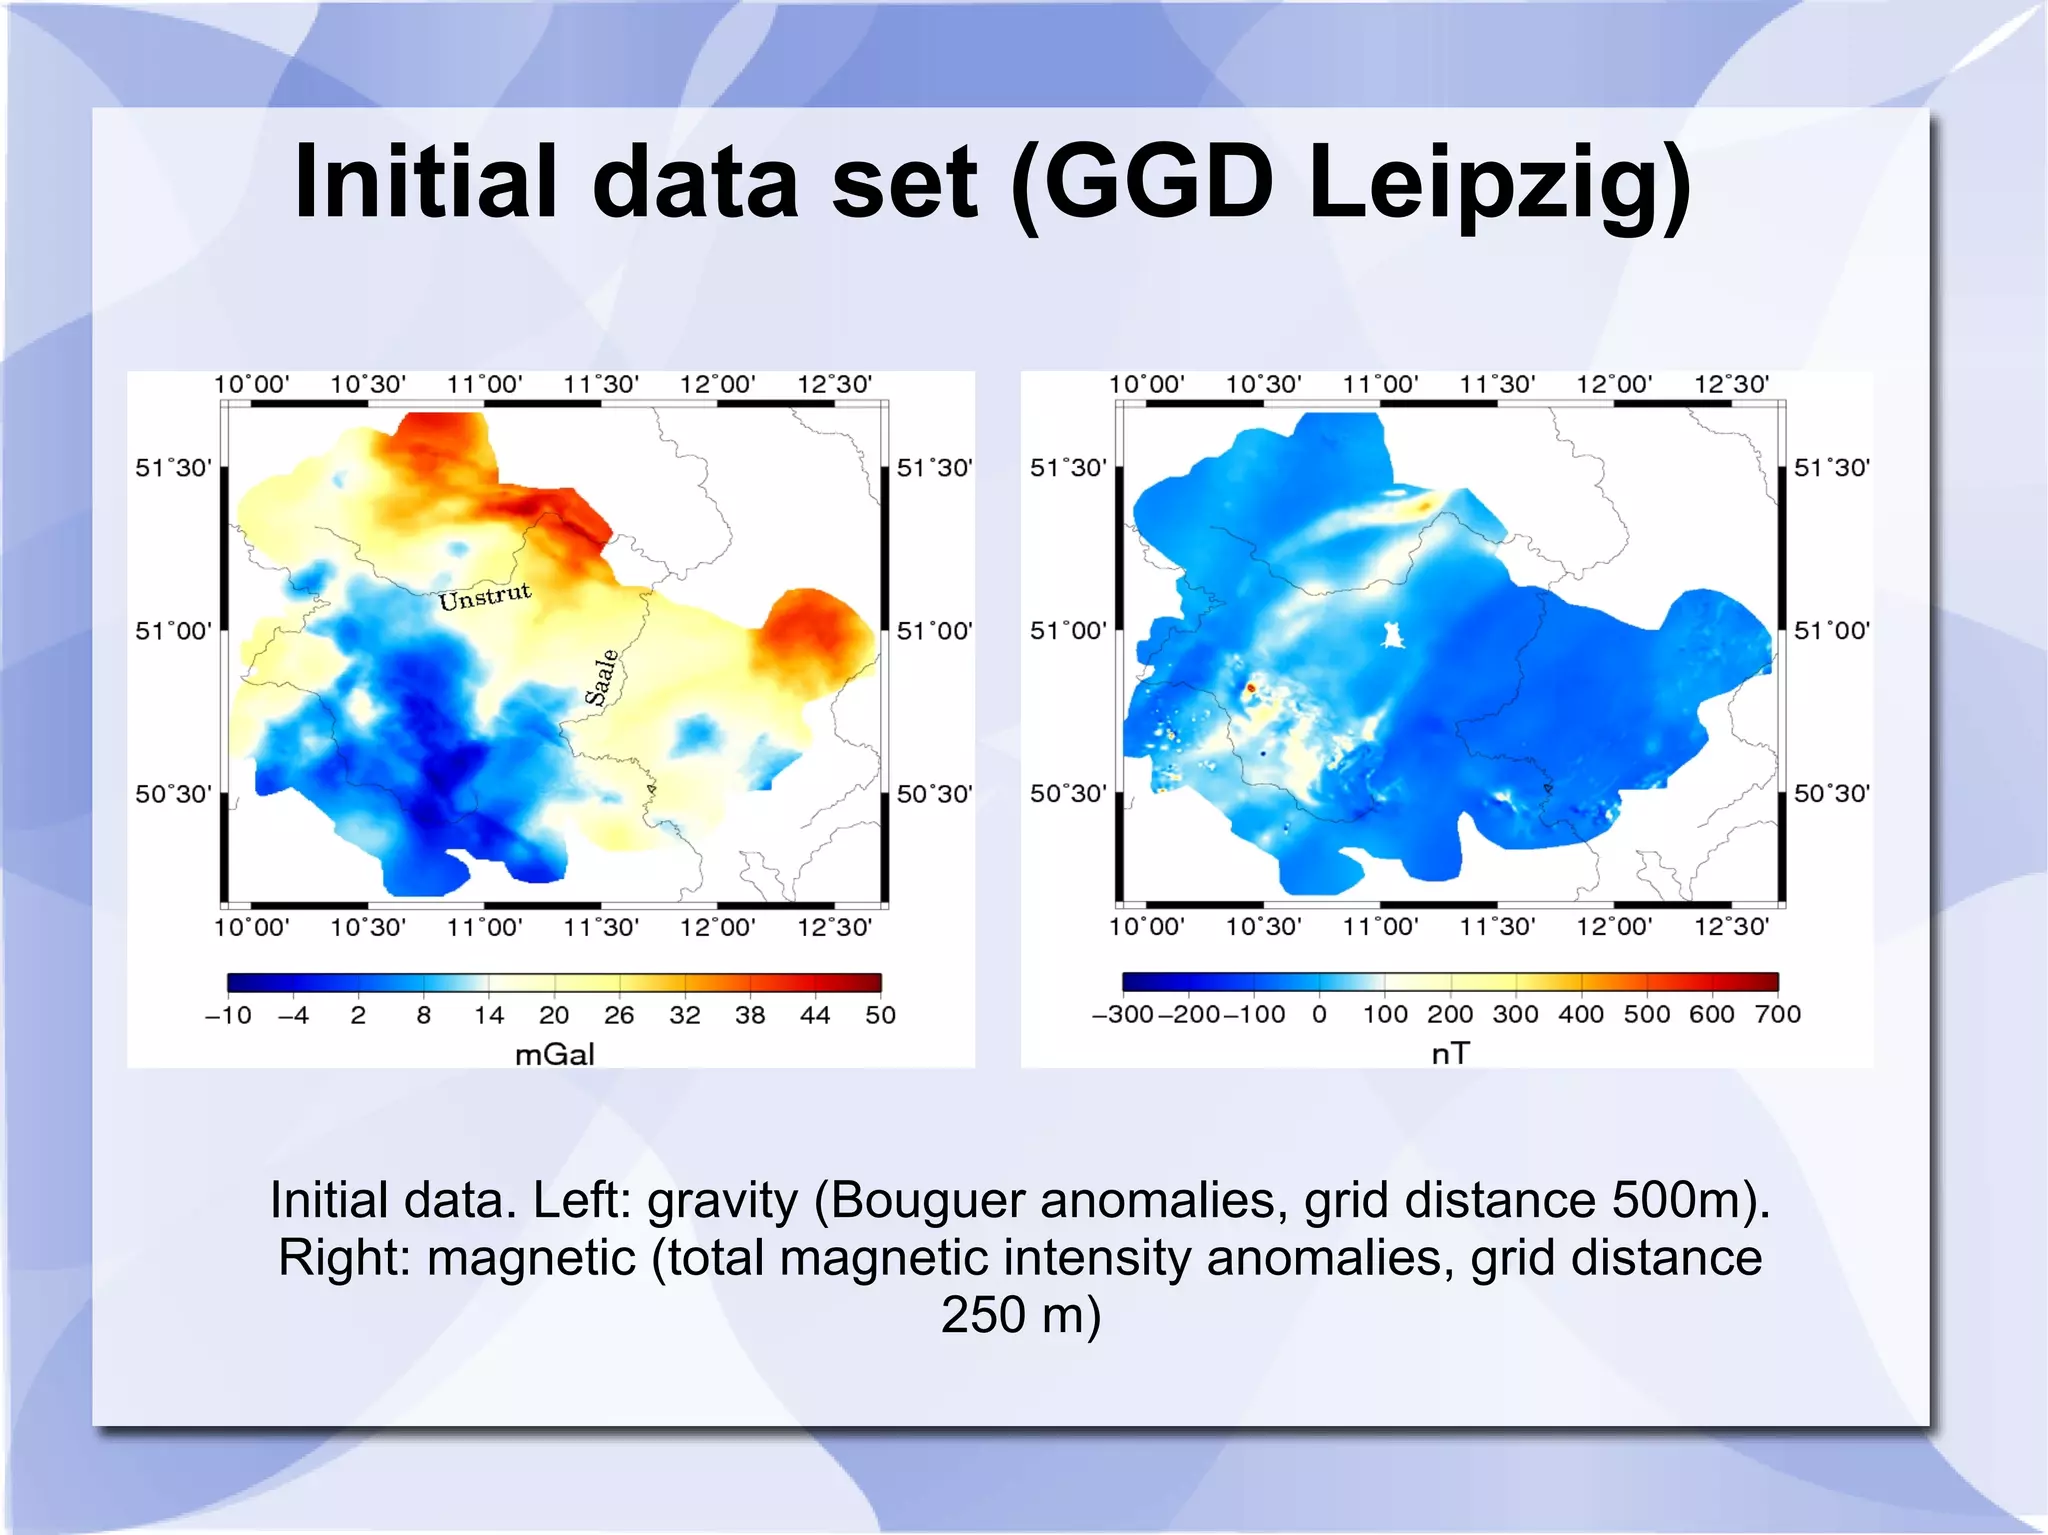
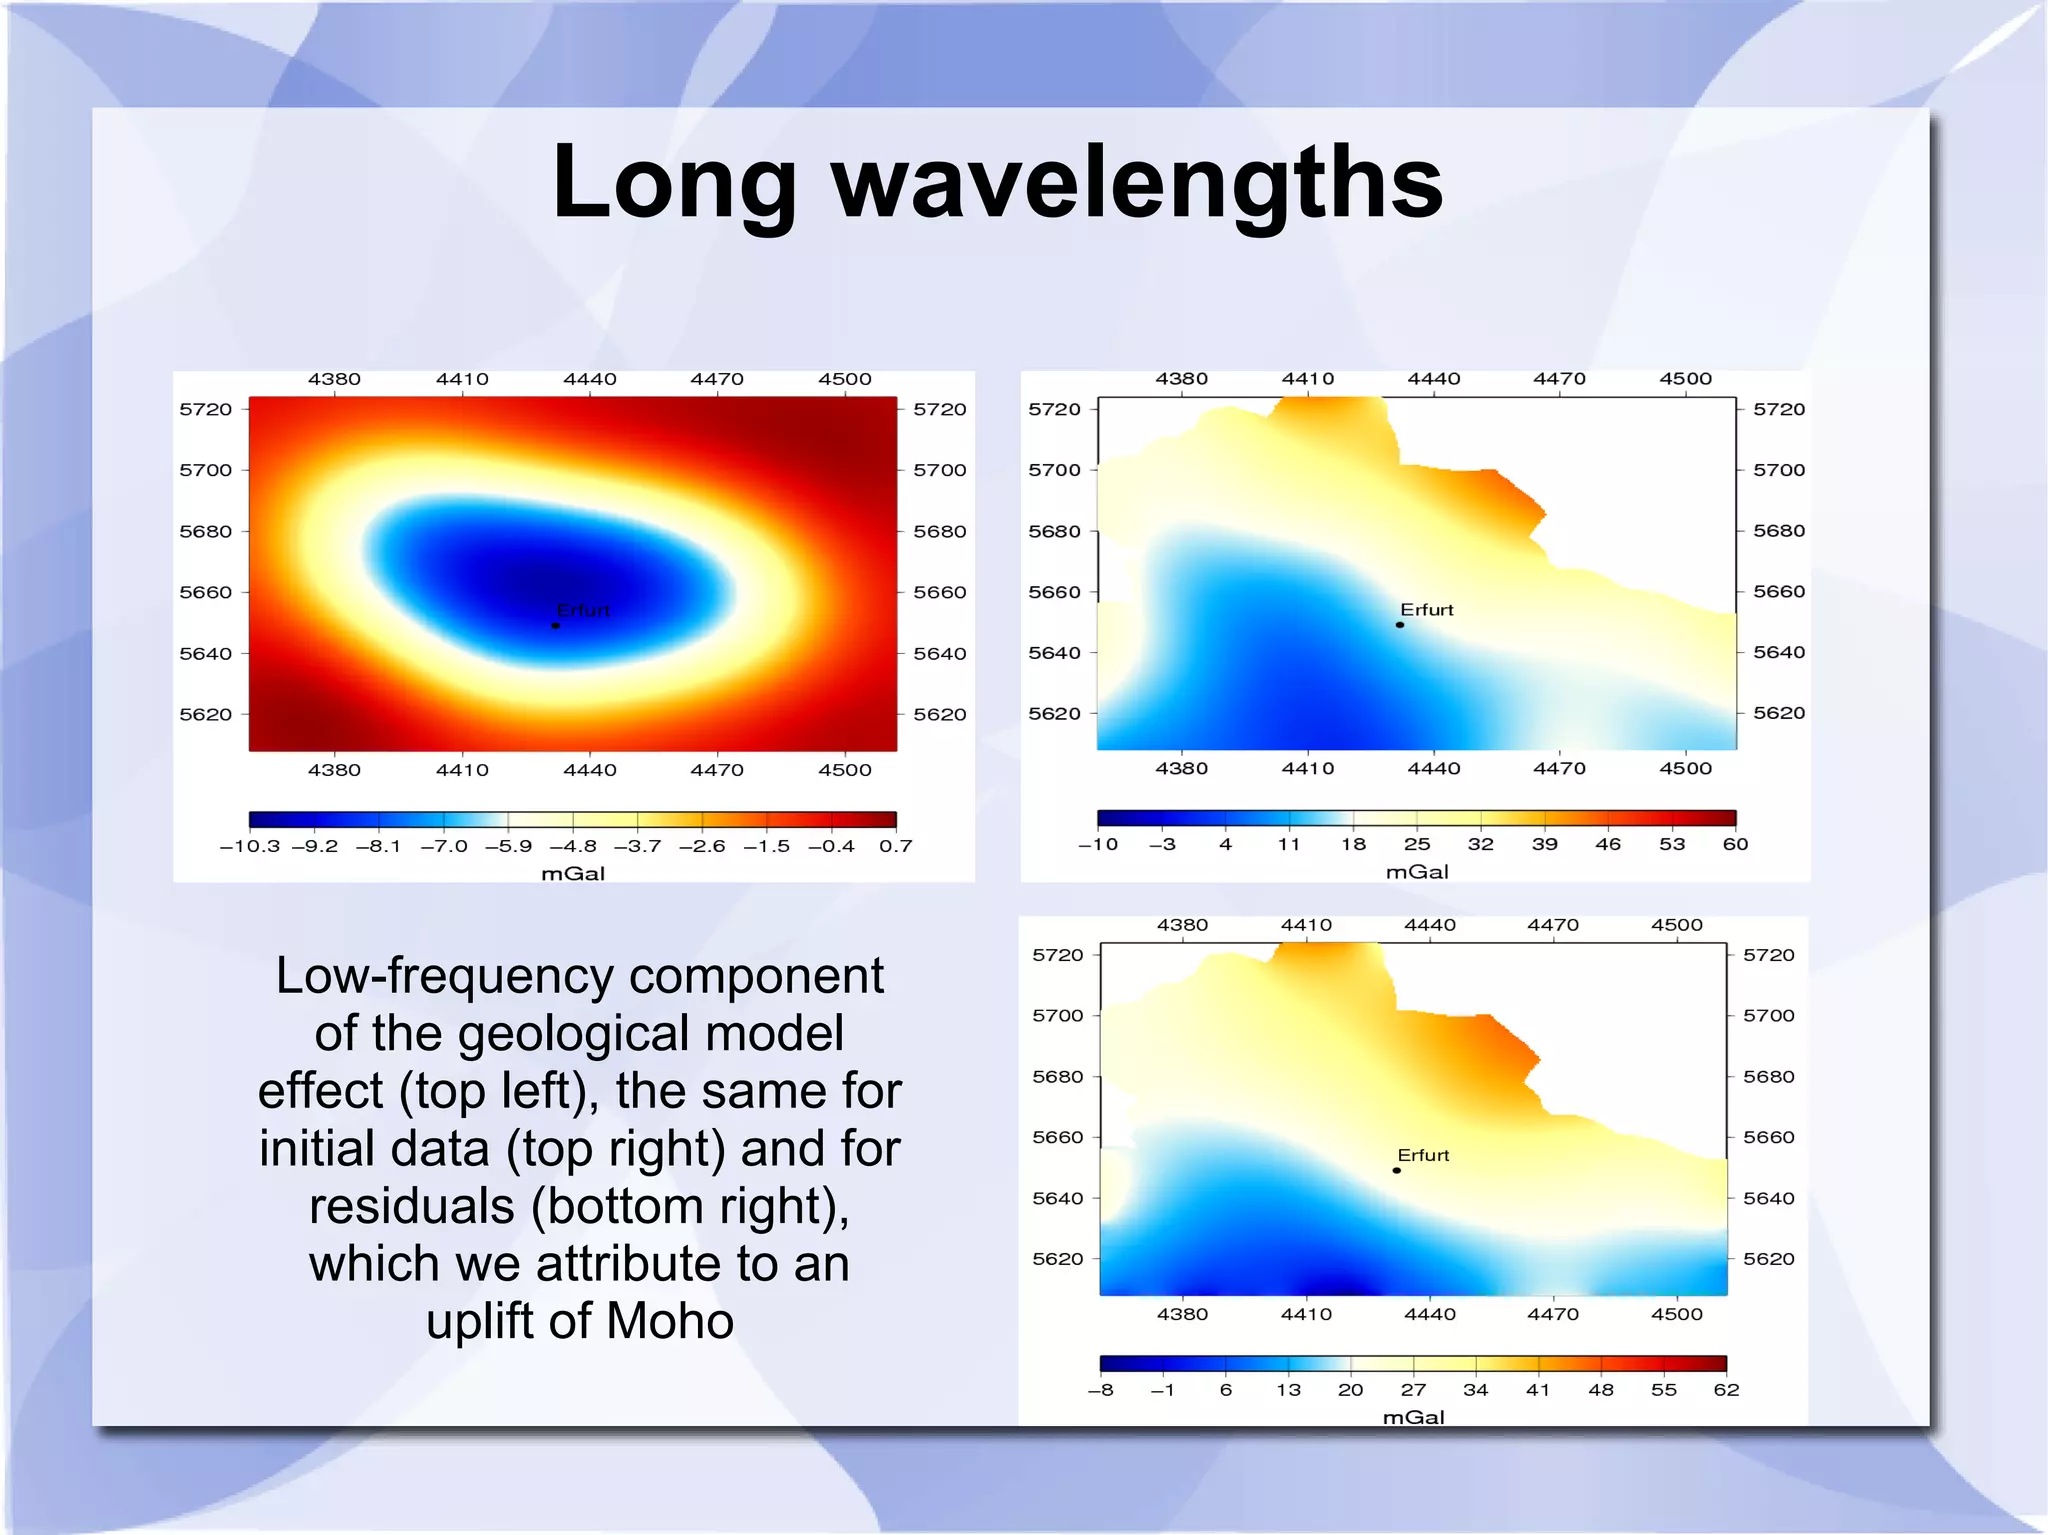
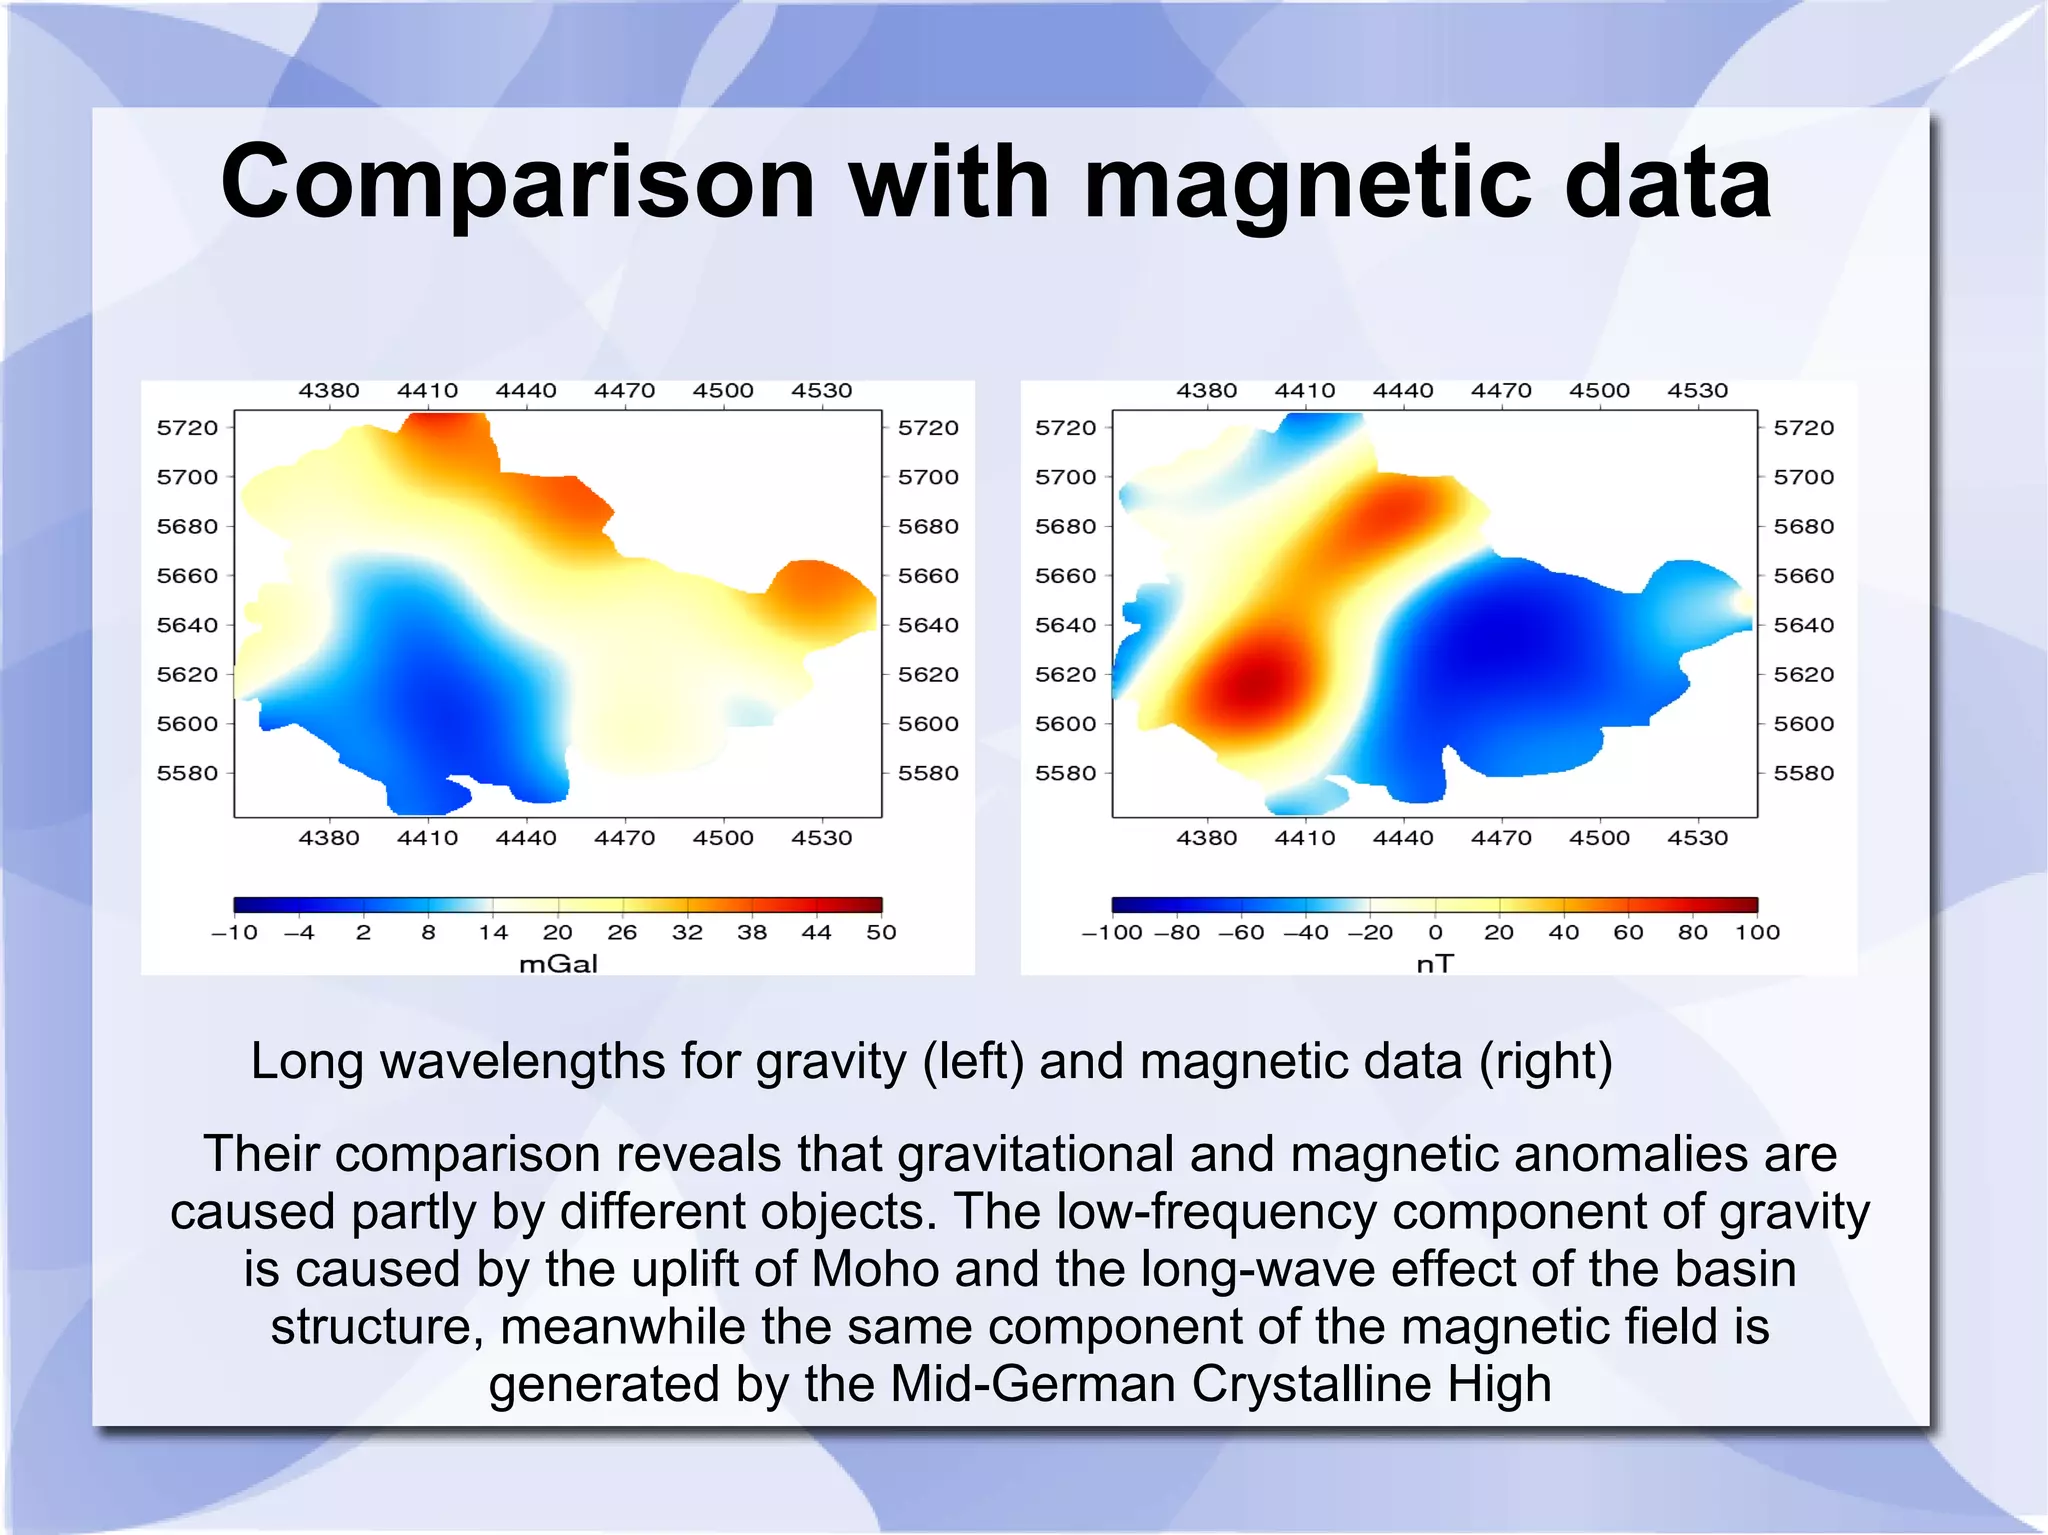
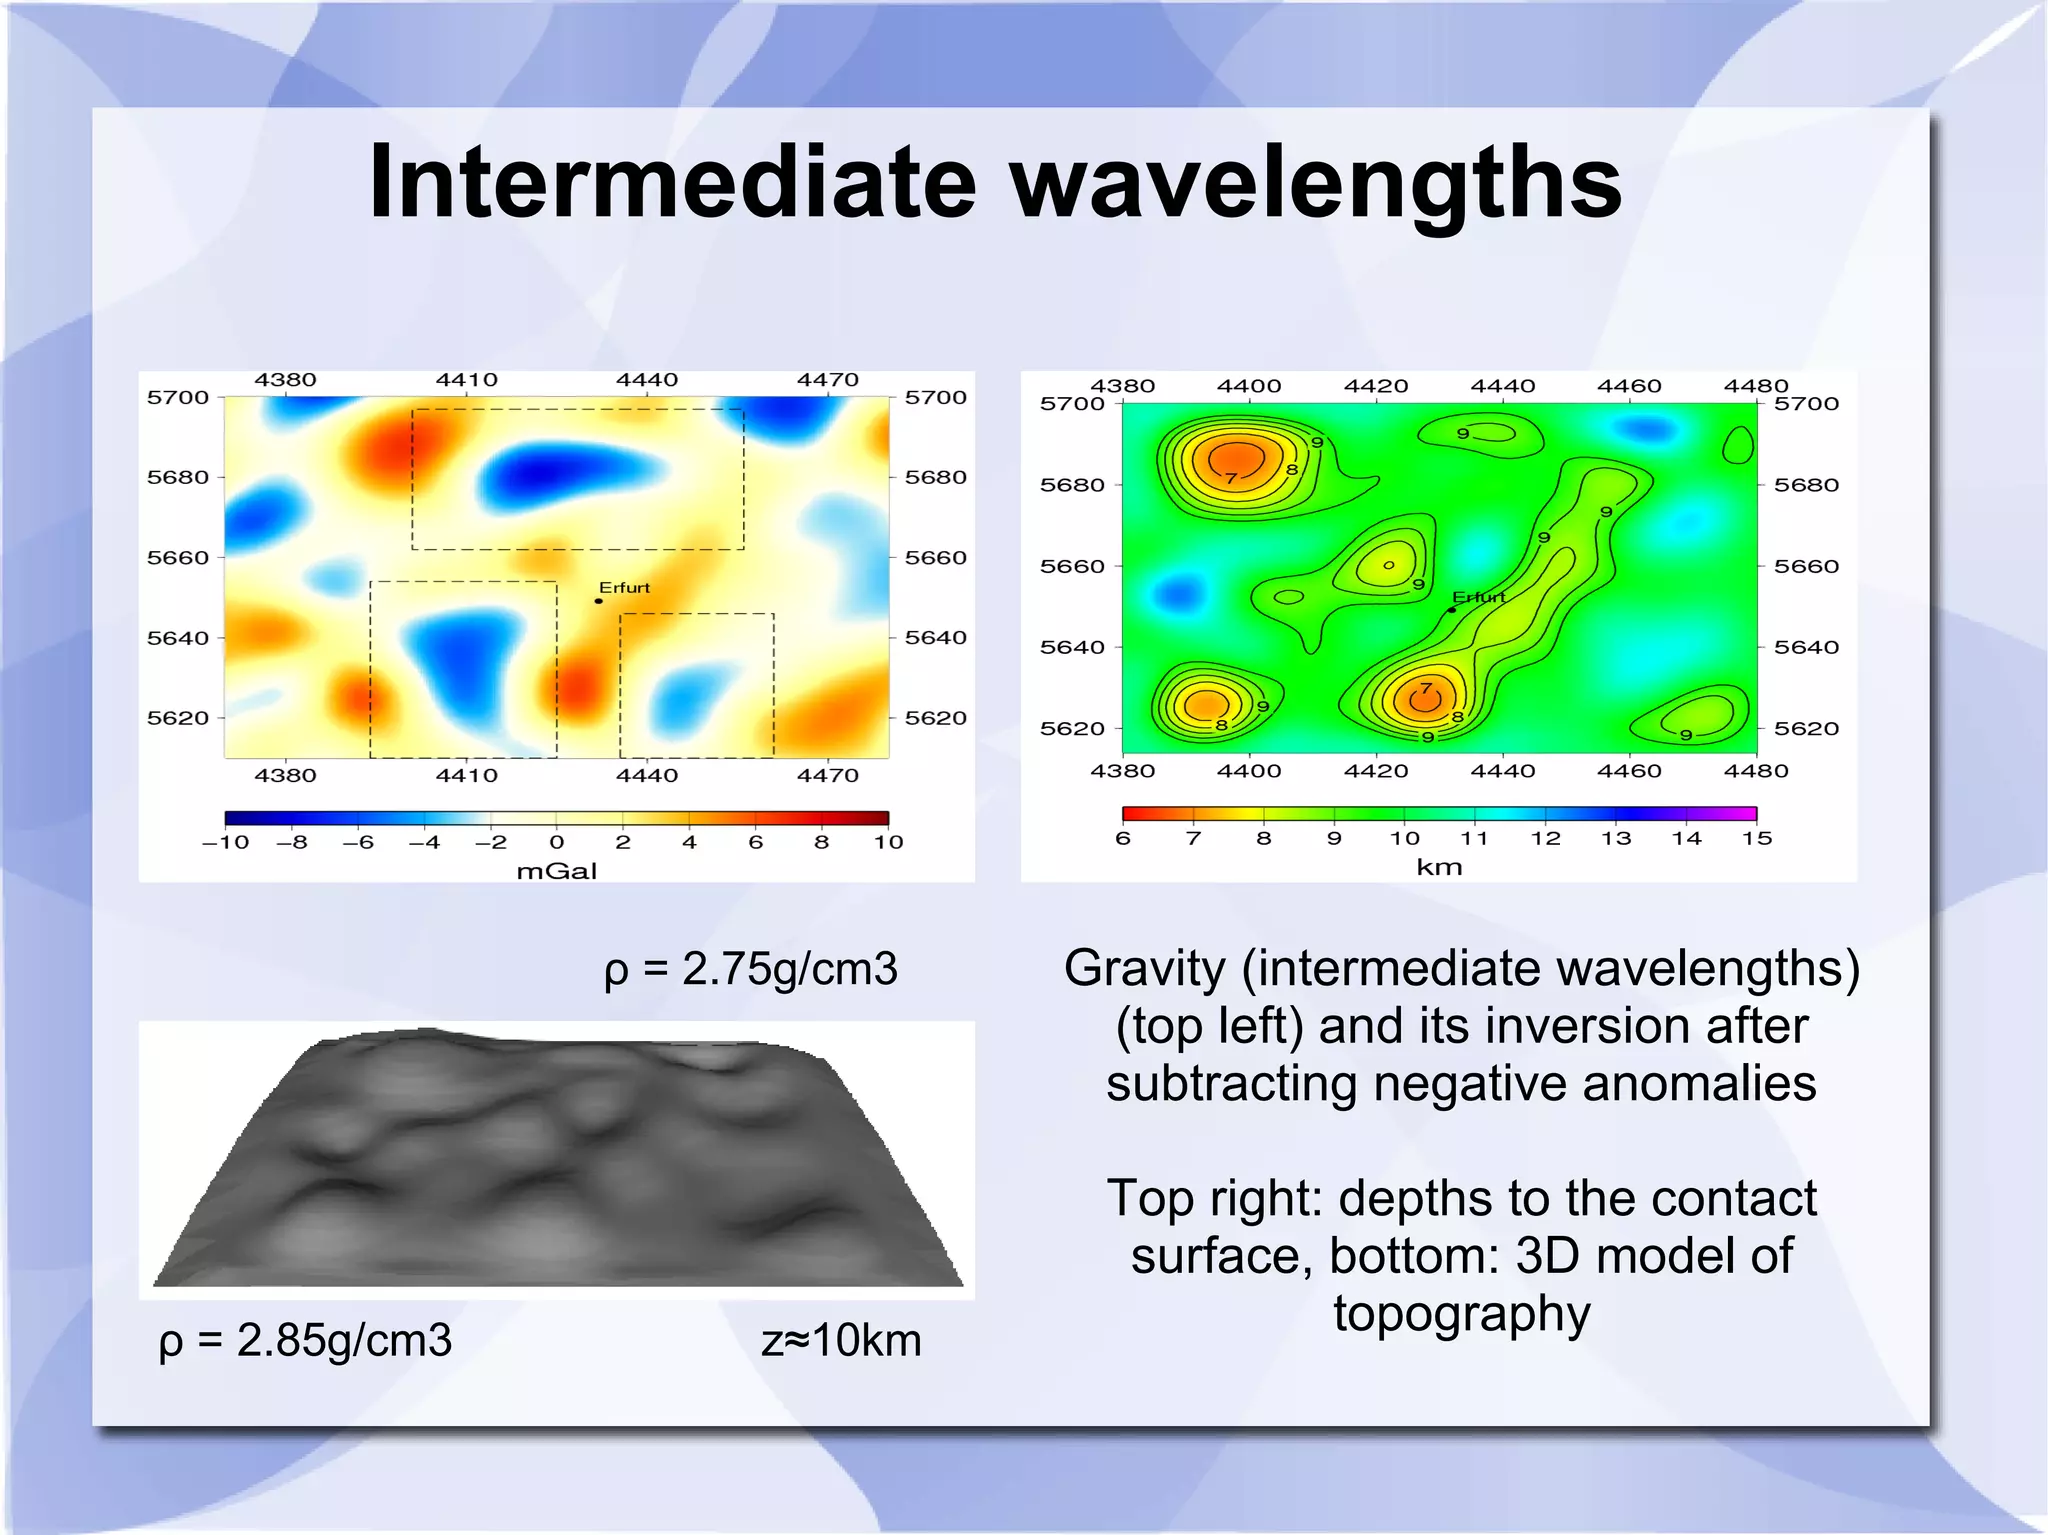
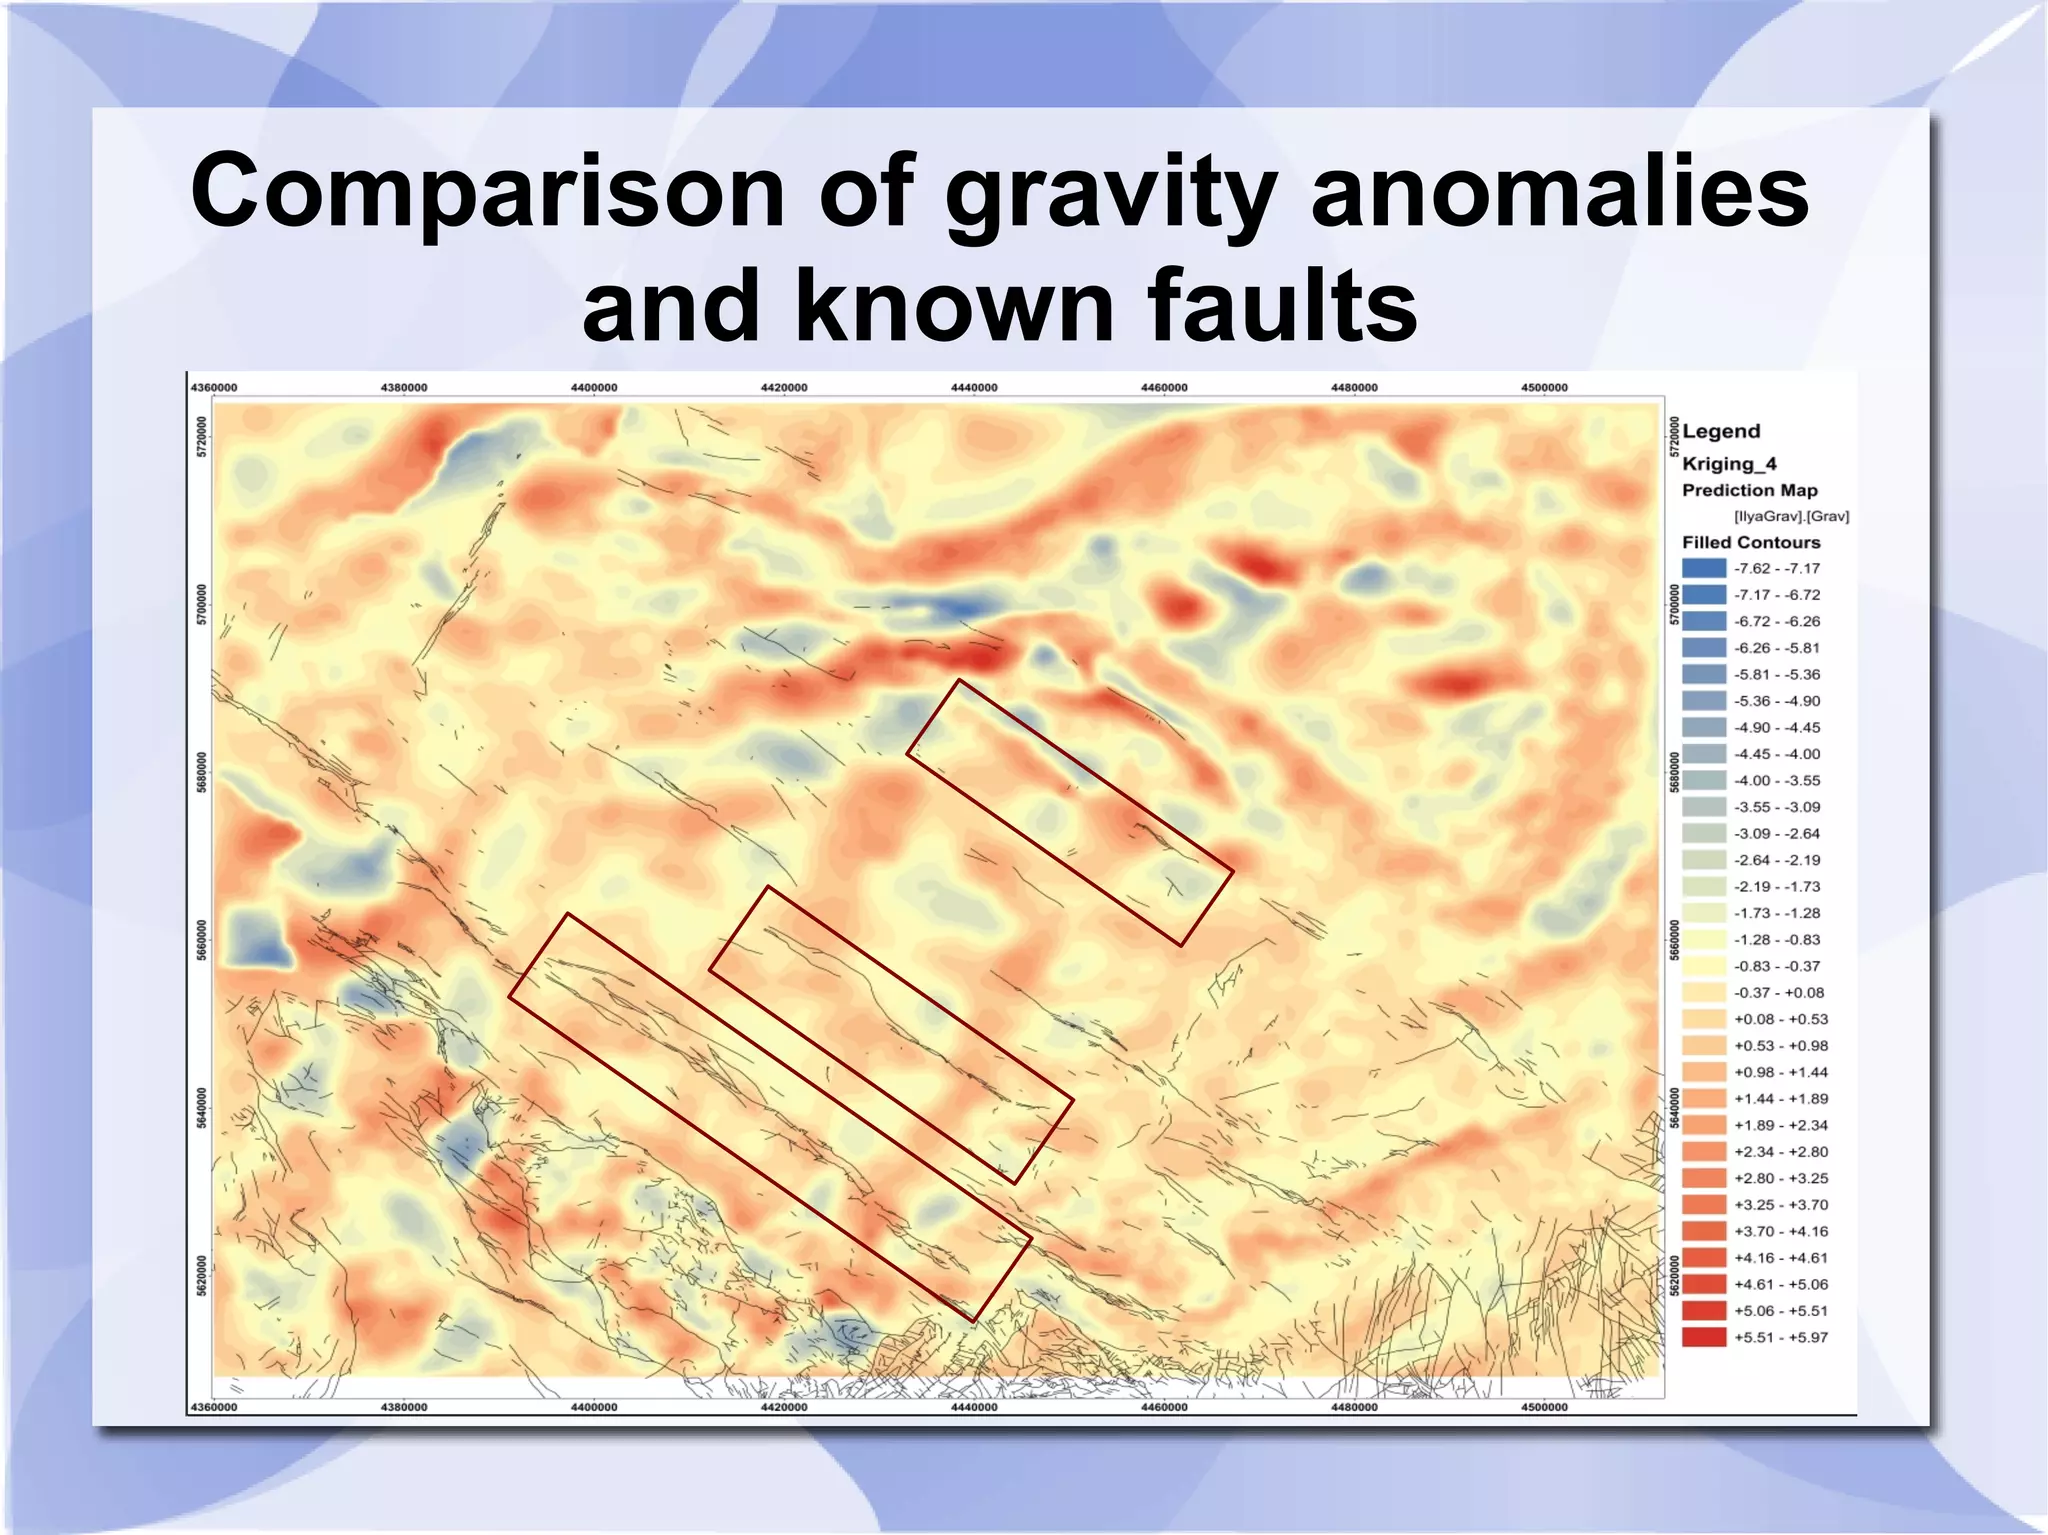
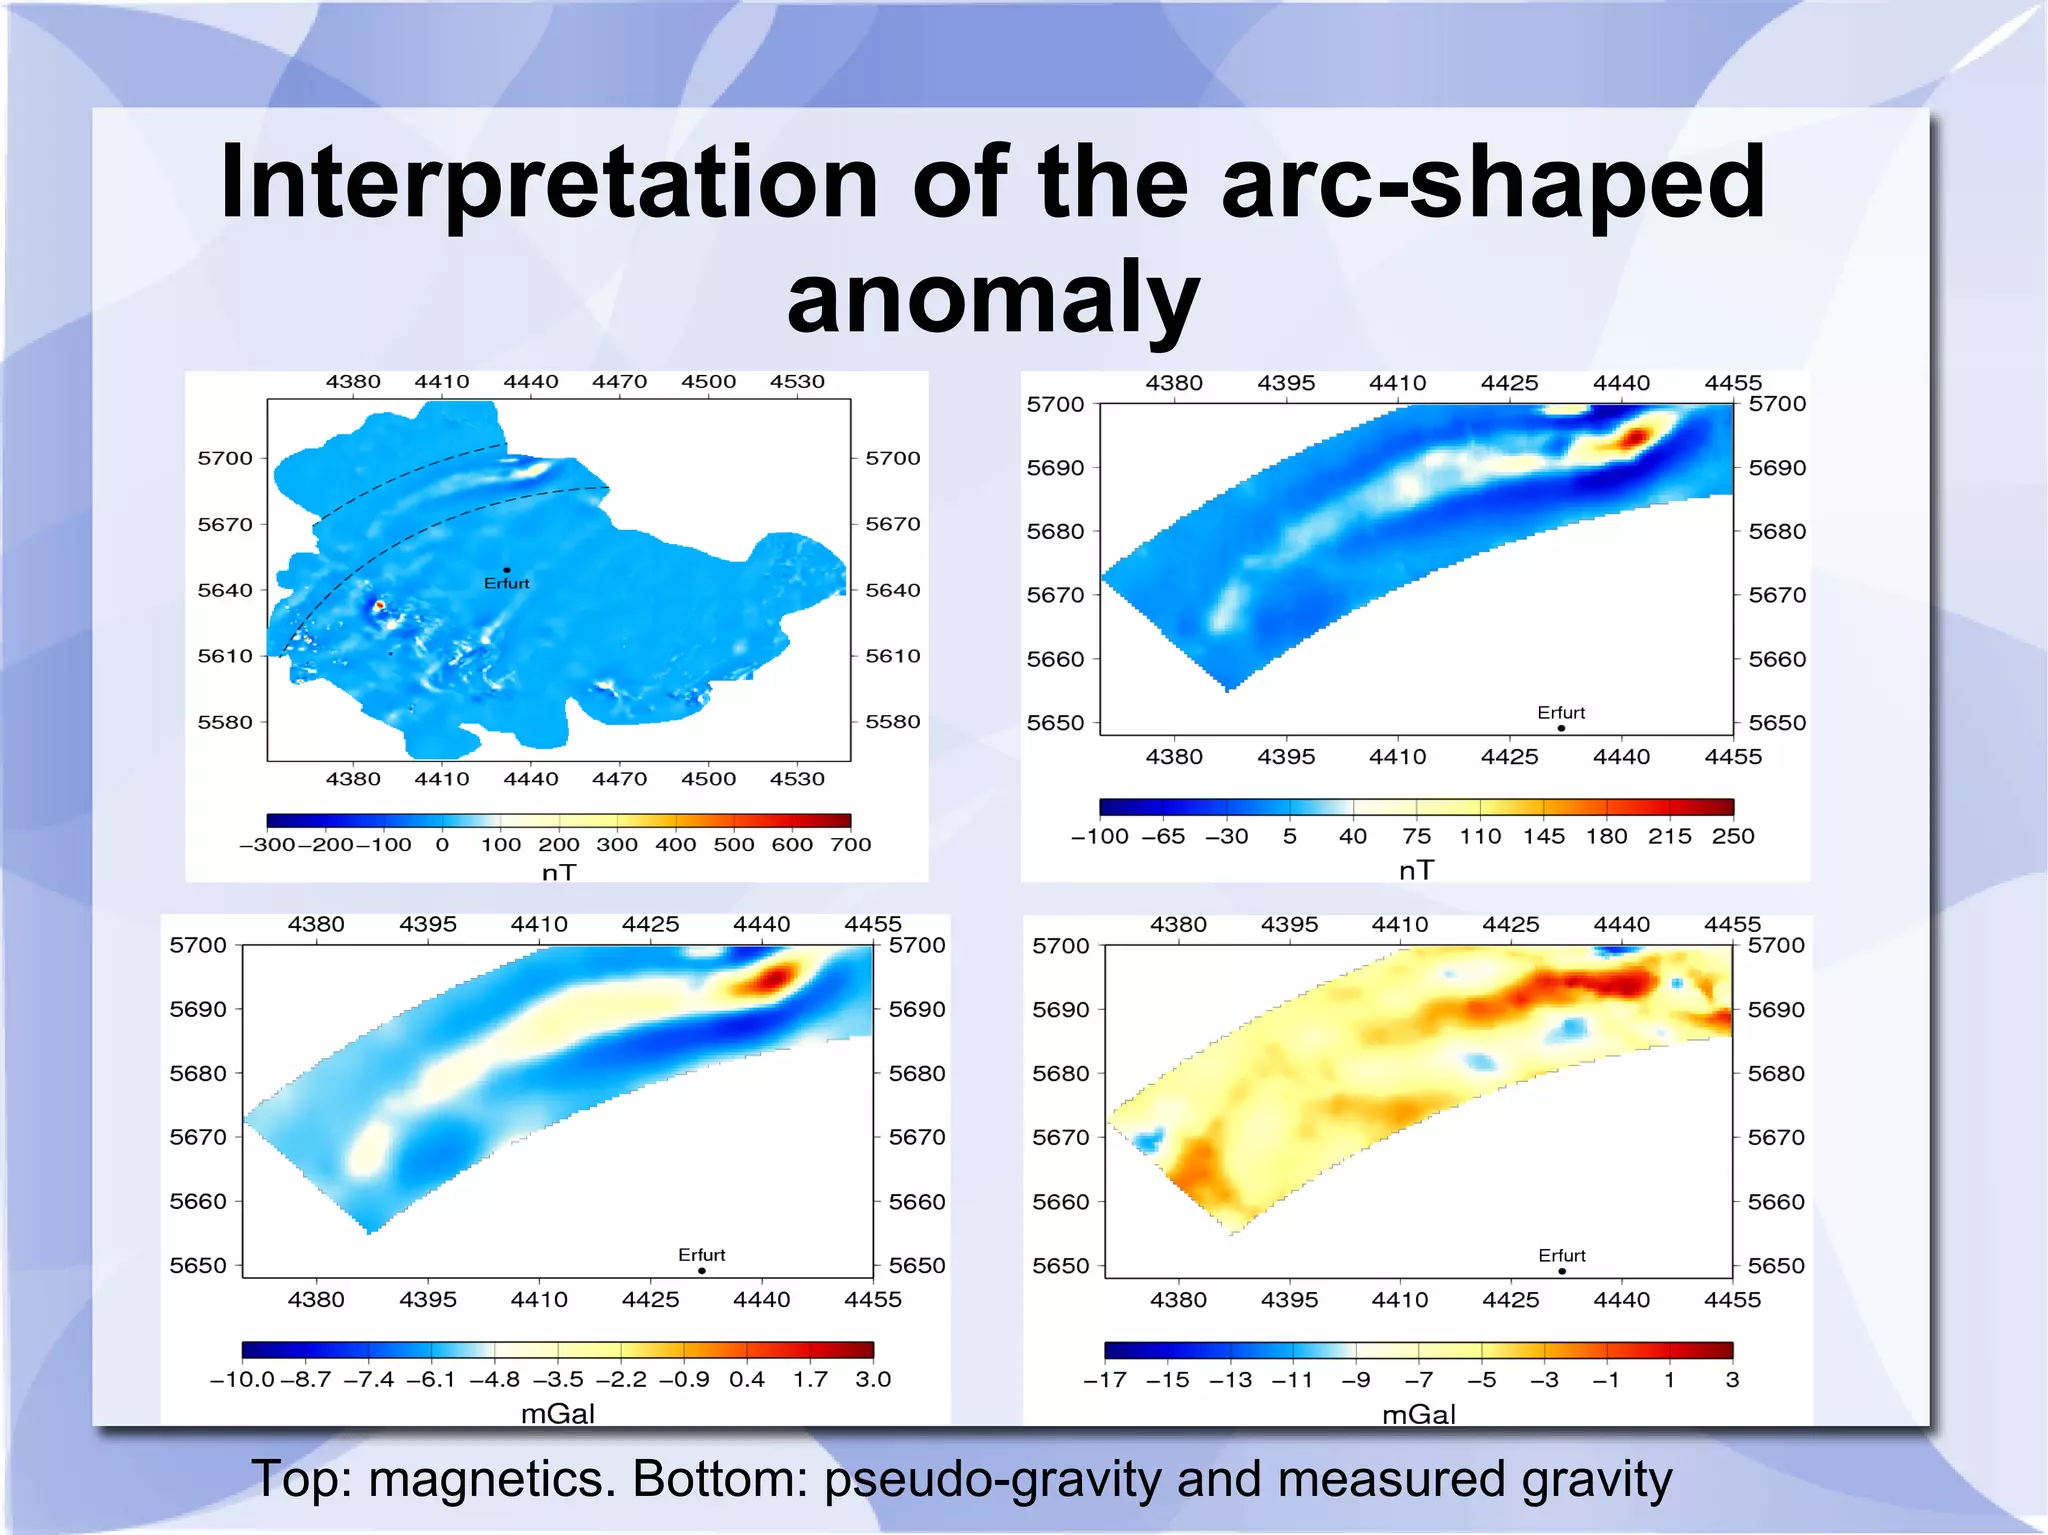
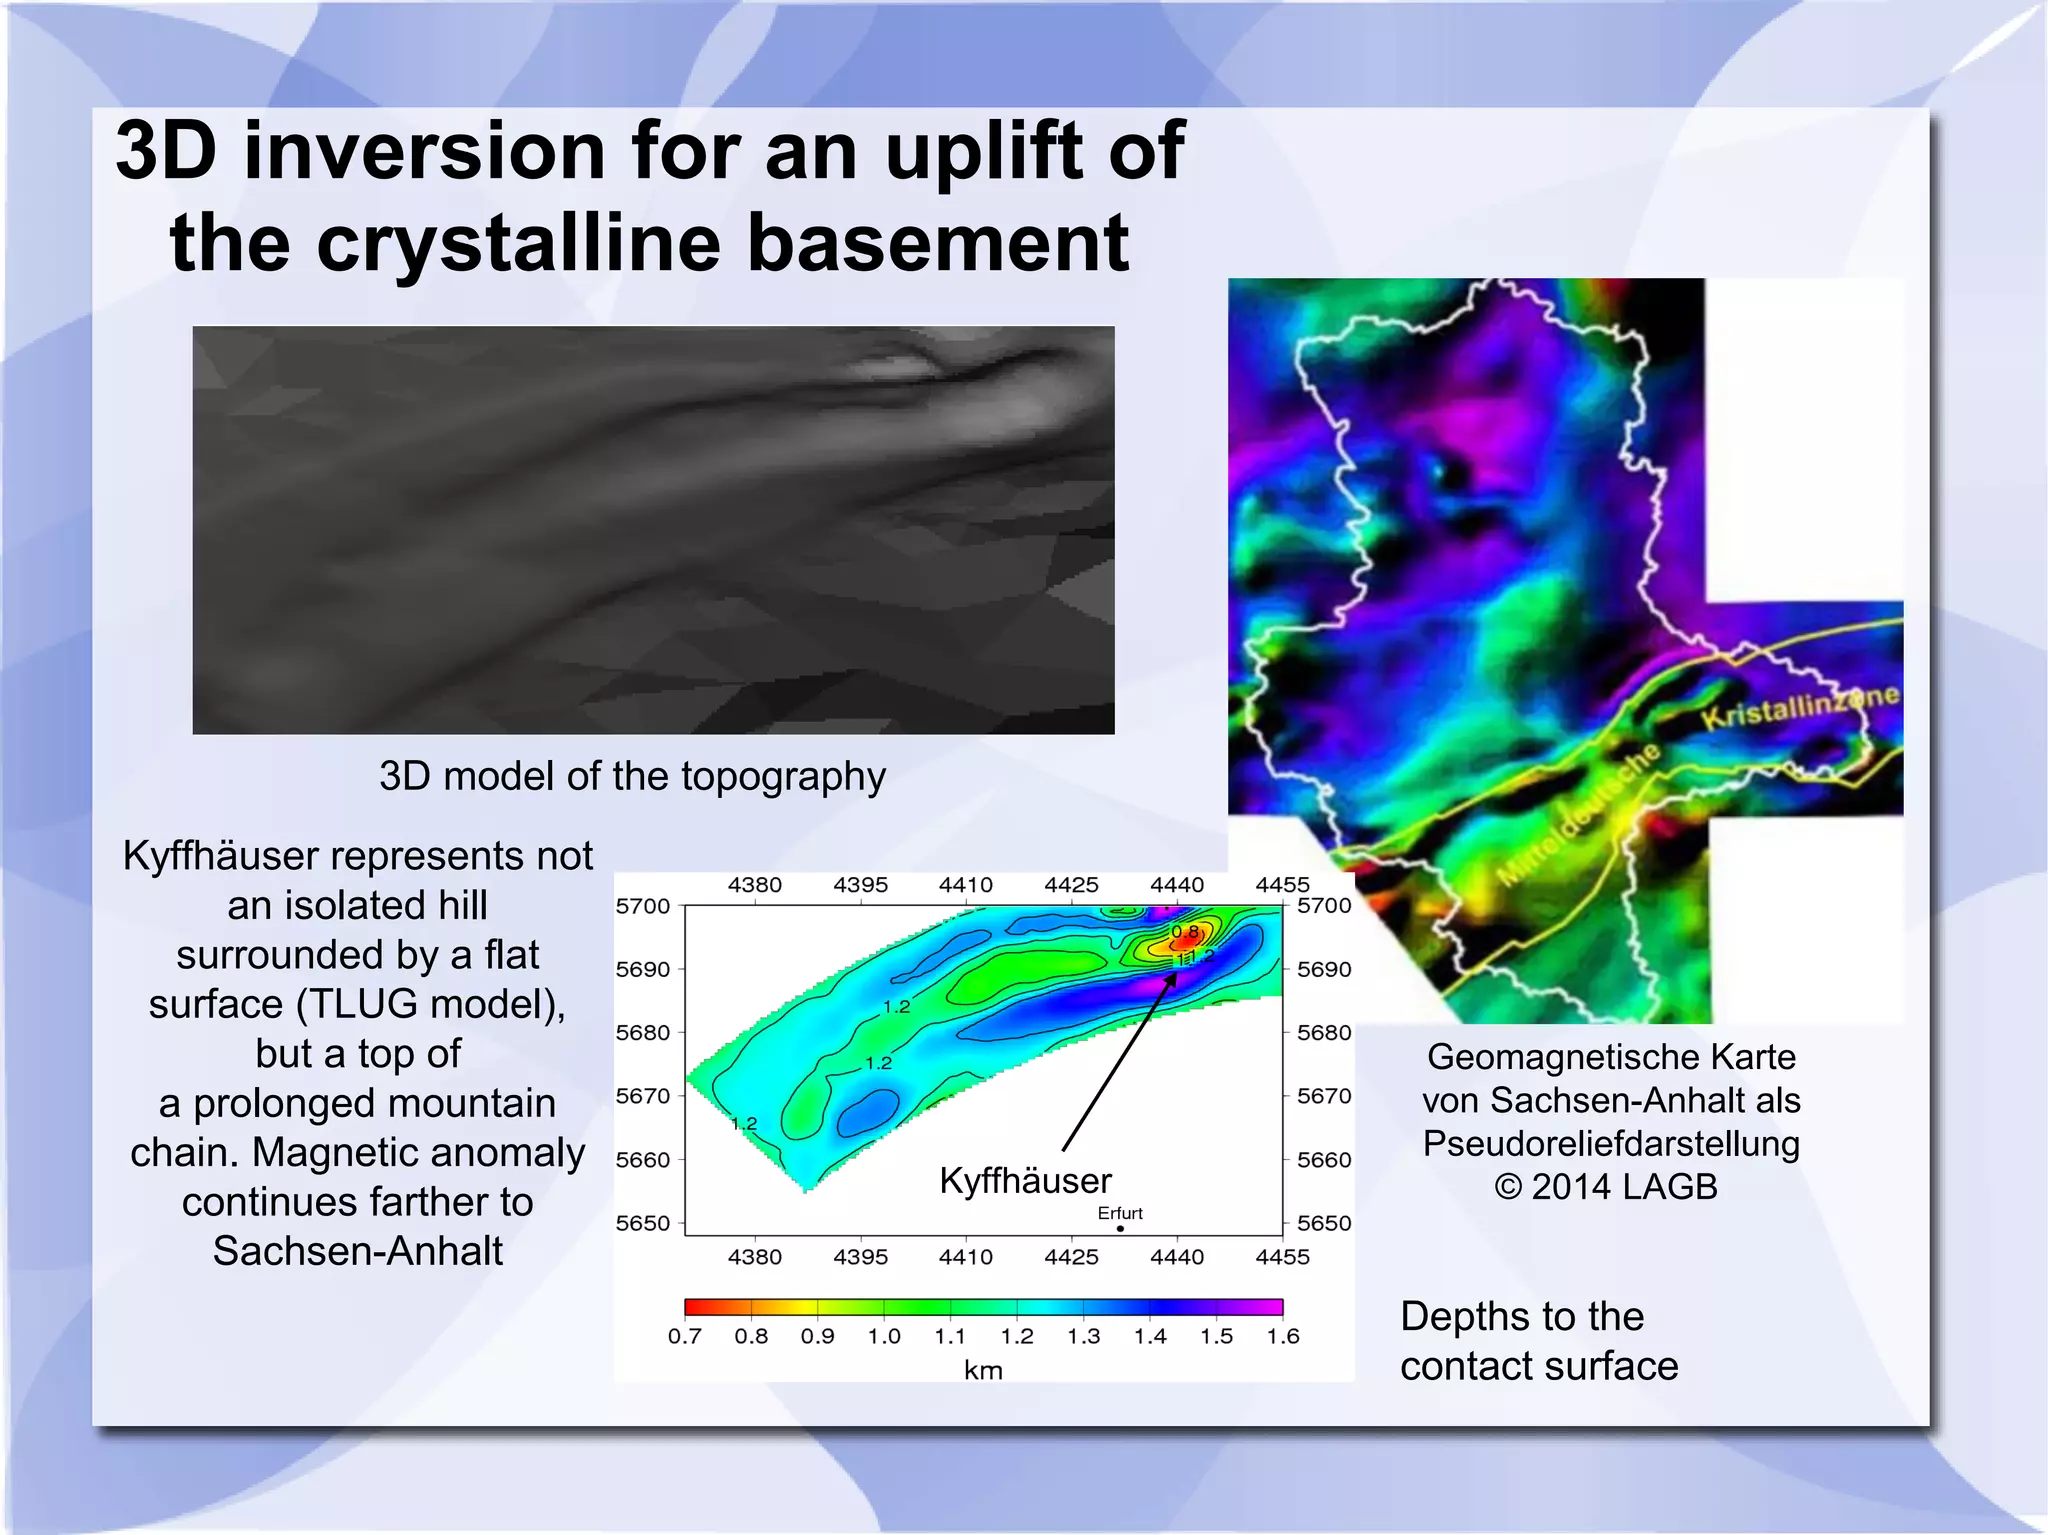
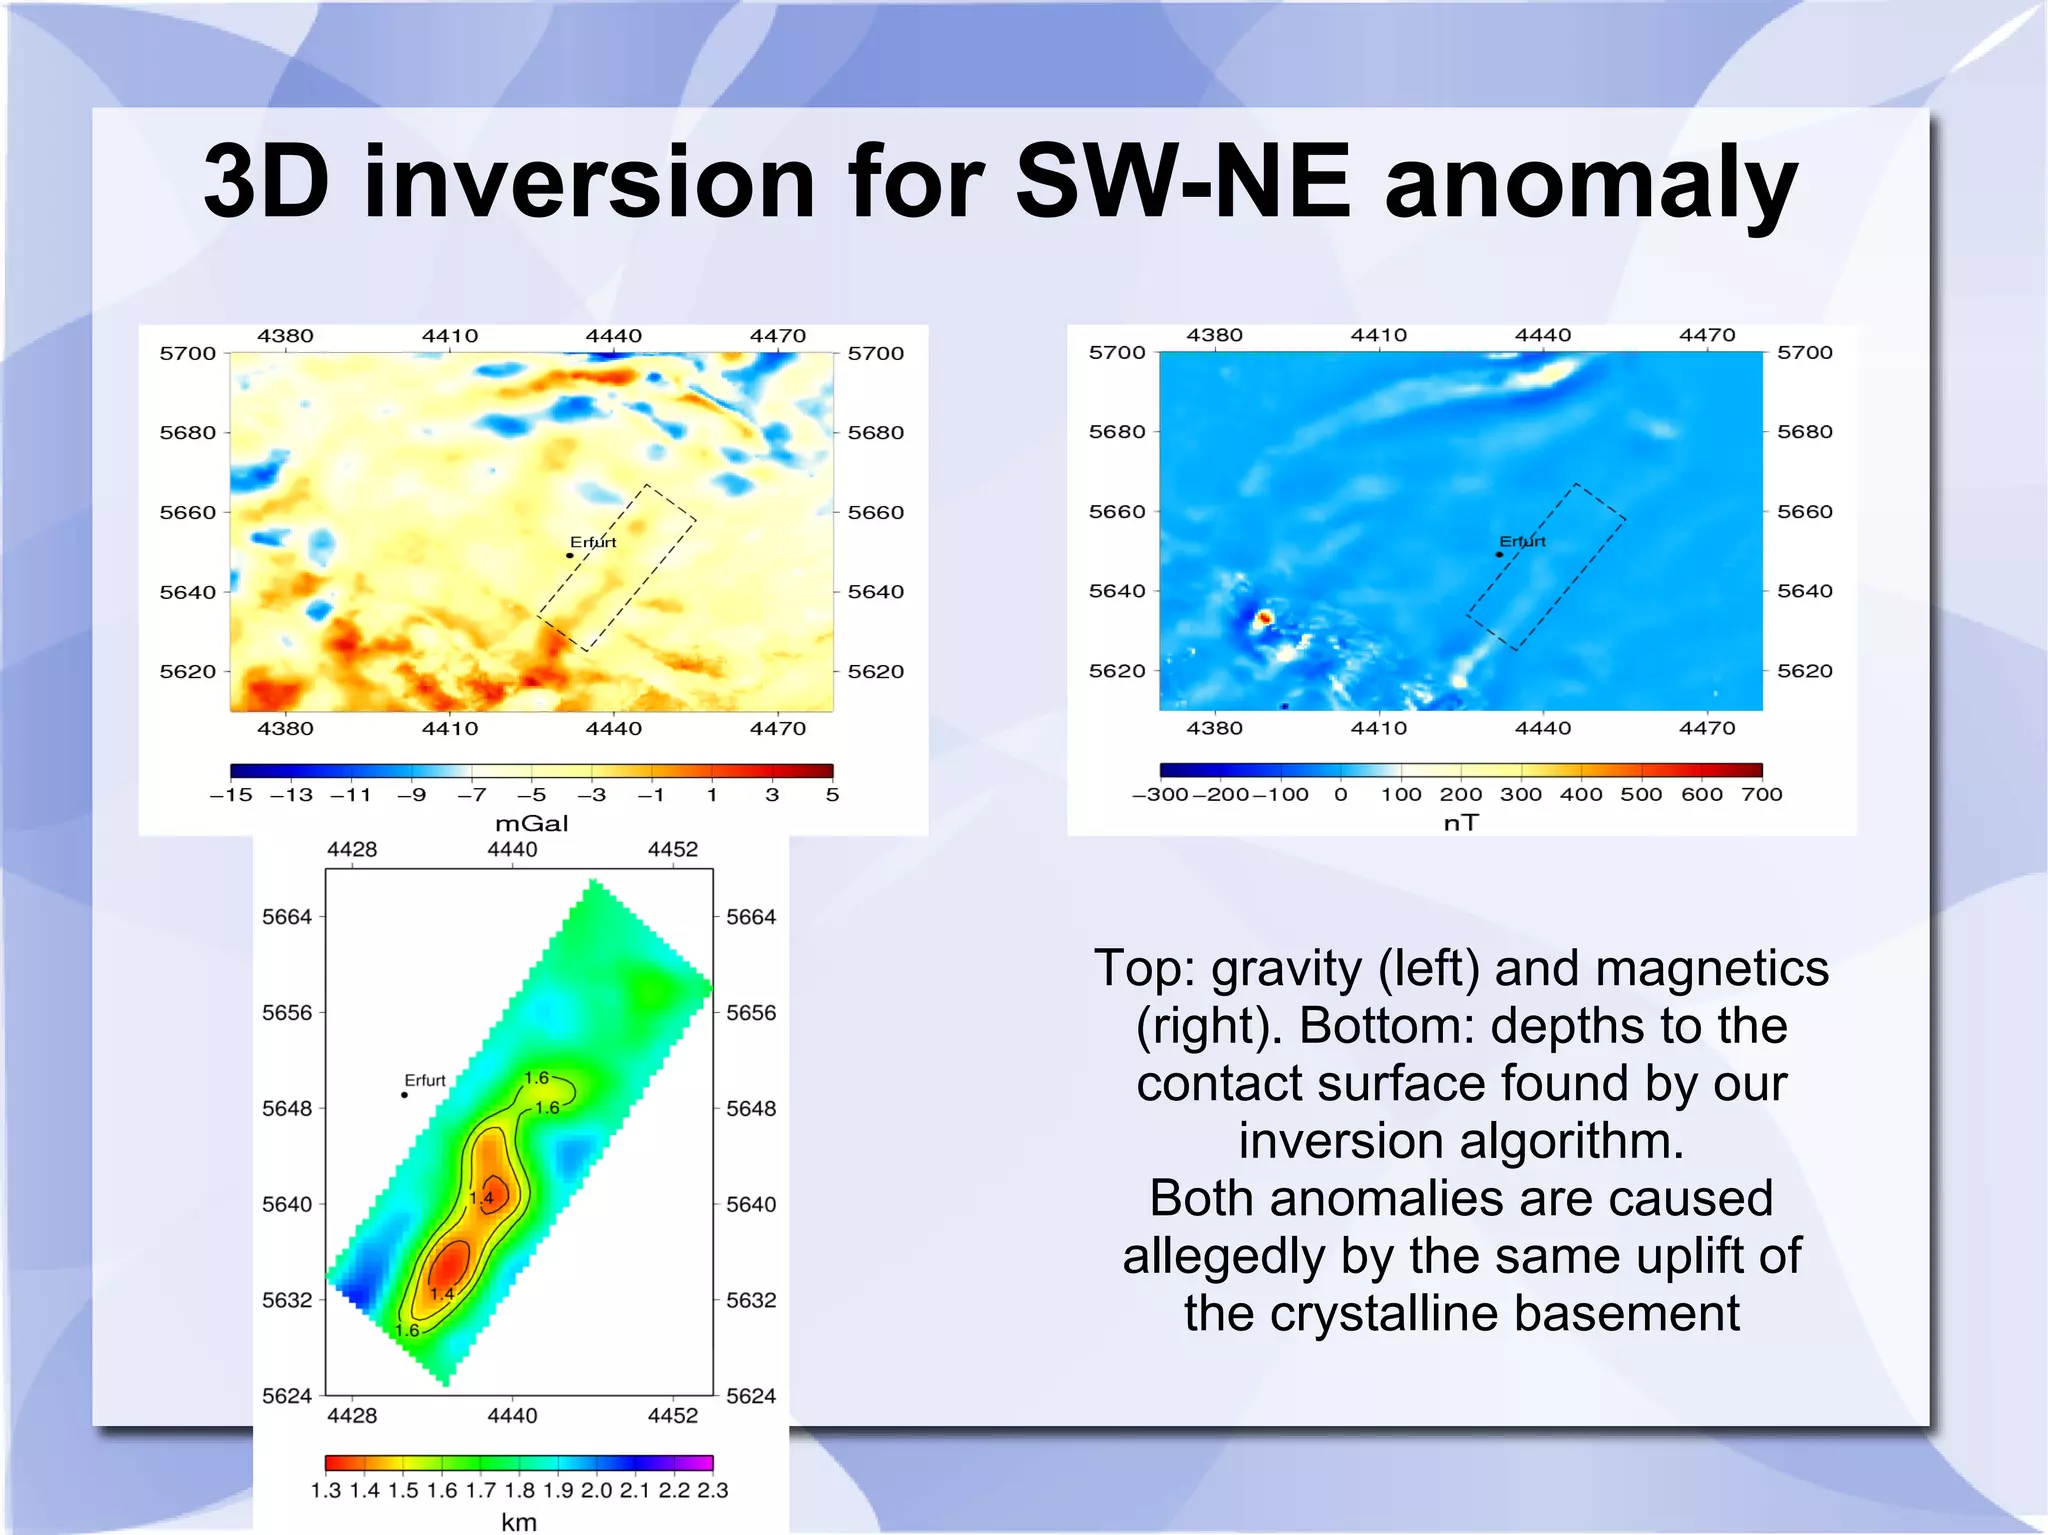
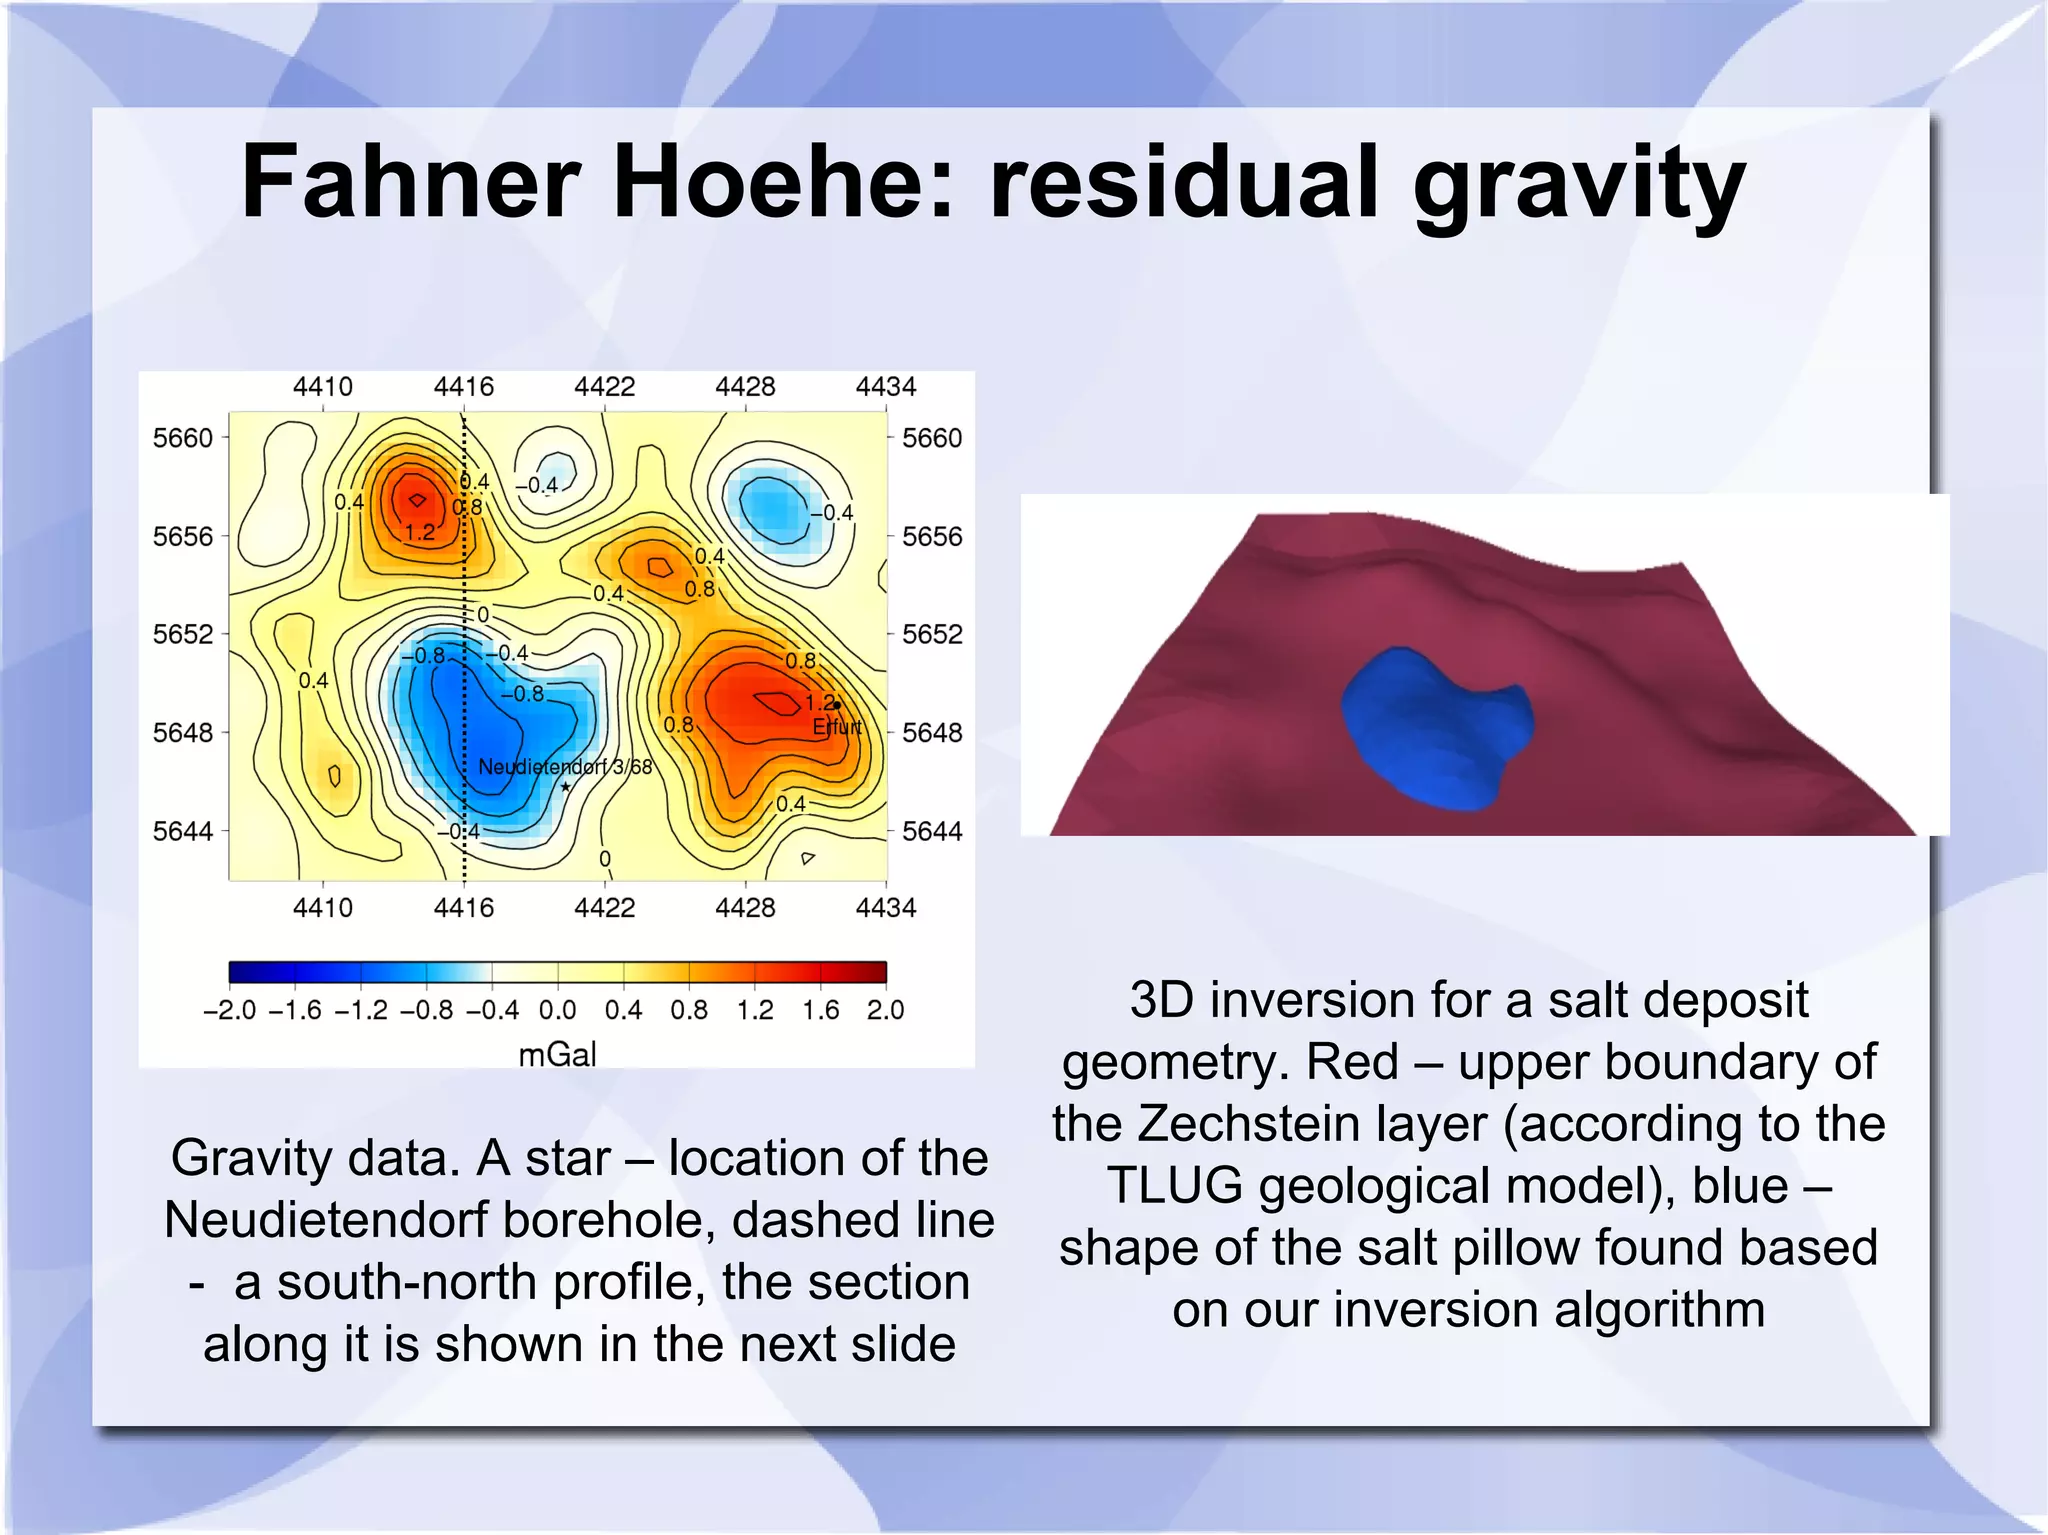
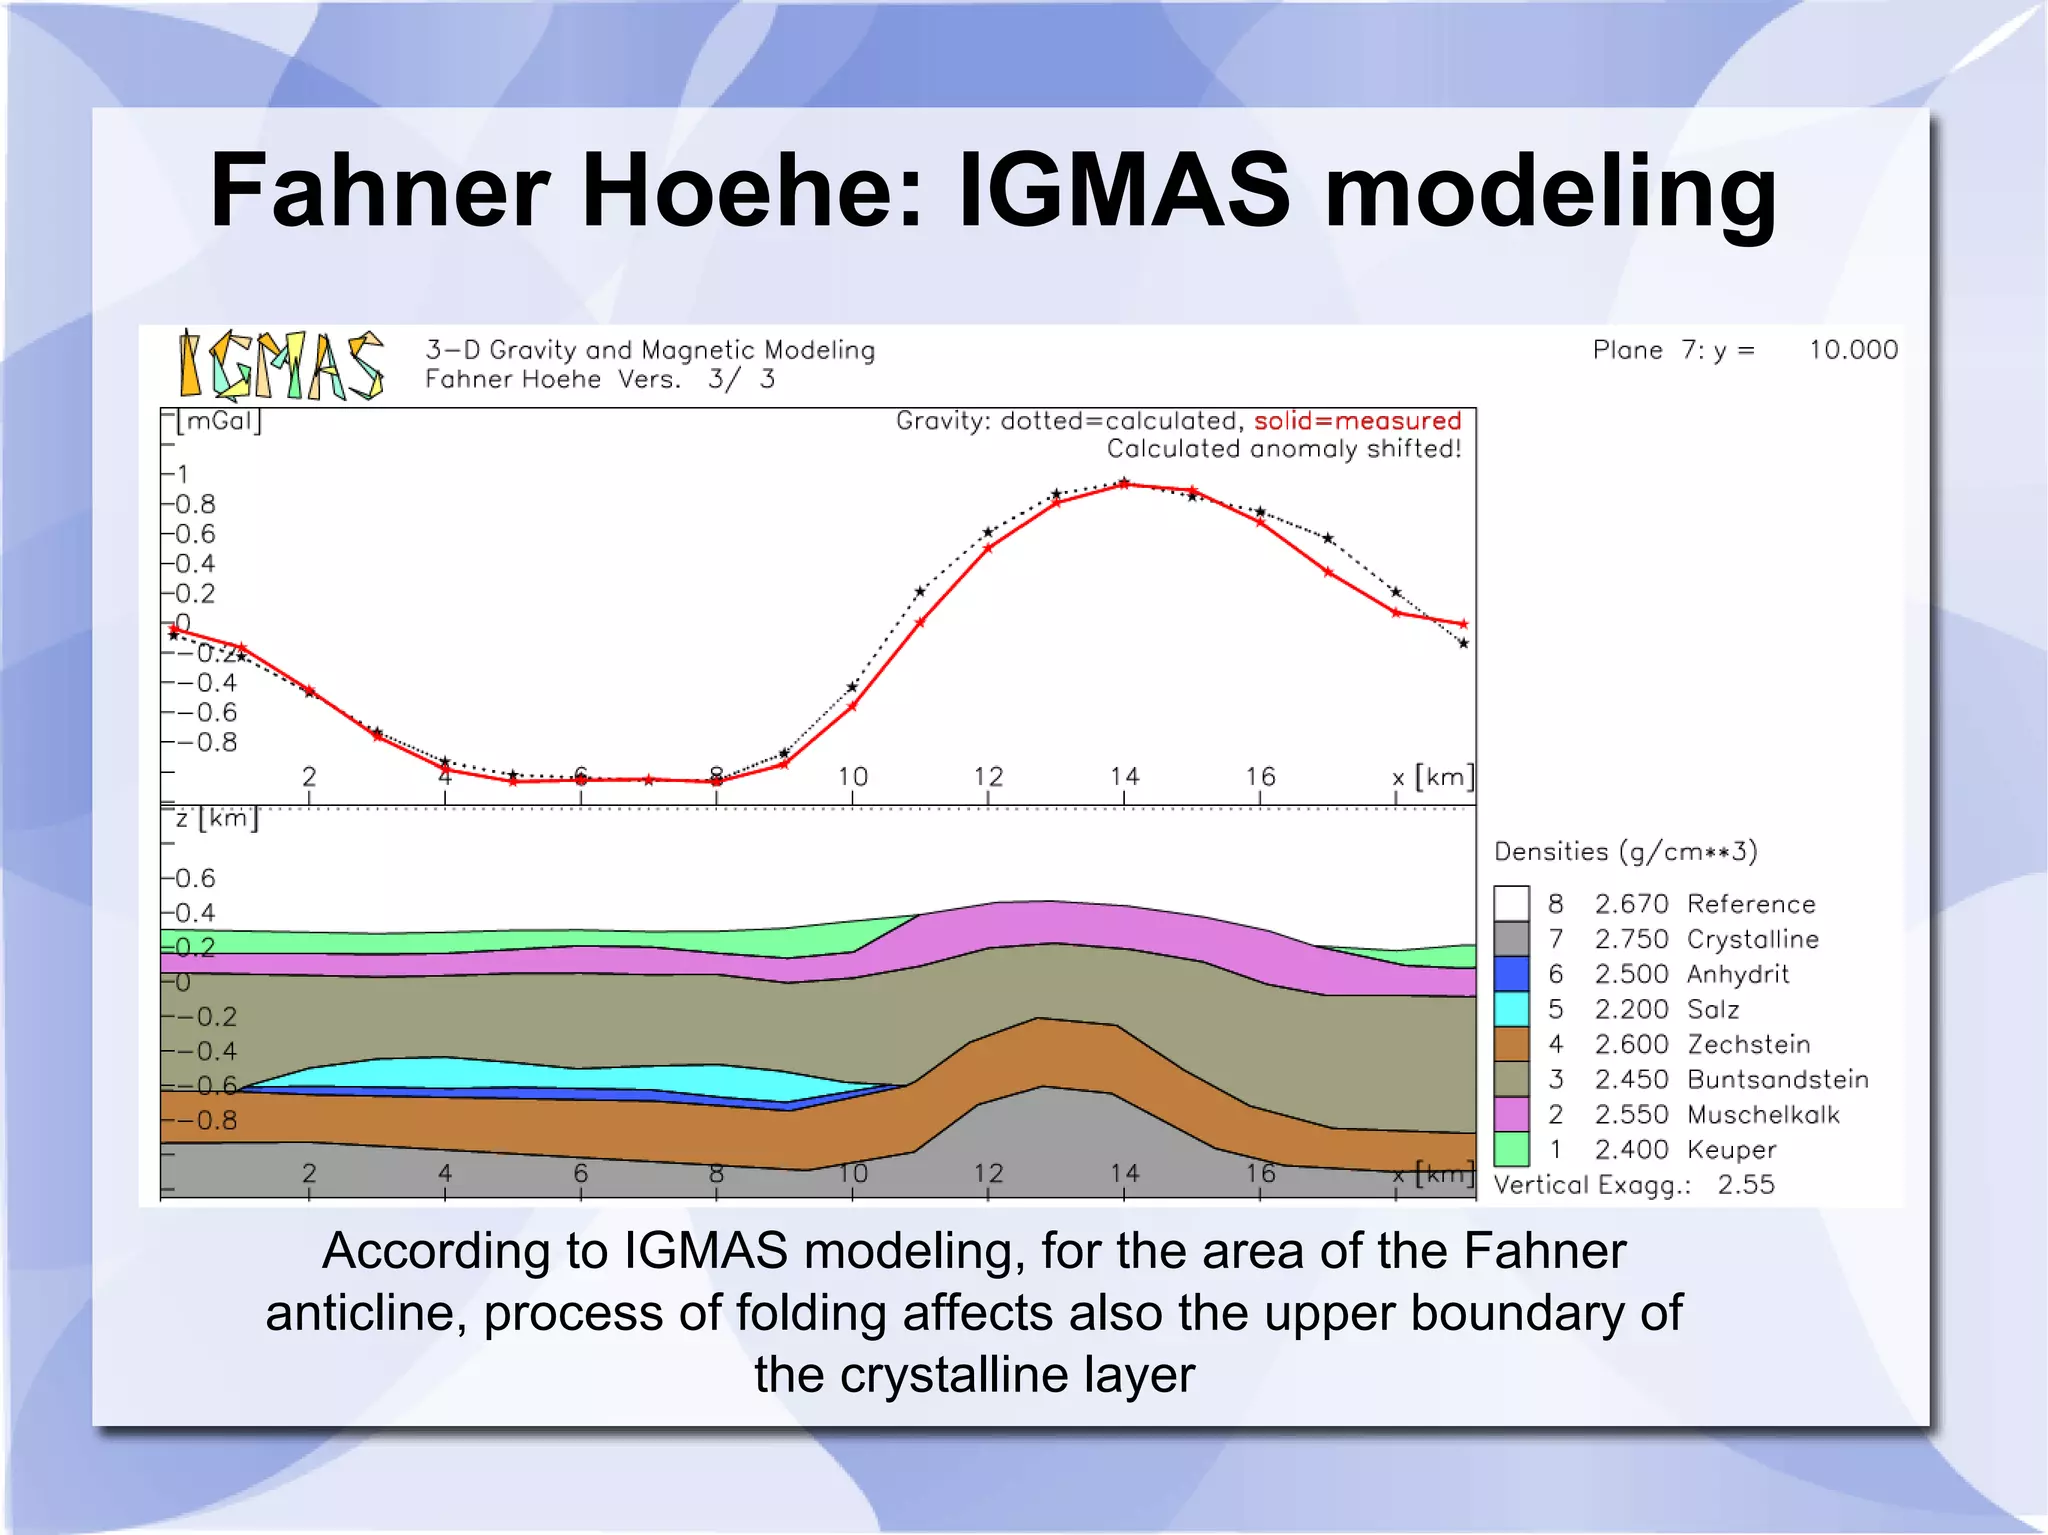
3) Case studies on data from Thuringia Basin reveal granitic intrusions above a density interface, uplifts in the crystalline basement matching magnetic anomalies, and the geometry of a salt deposit.