1) The document analyzes volume curvature attributes in seismic data to identify subtle faults and fractures in a carbonate reservoir.
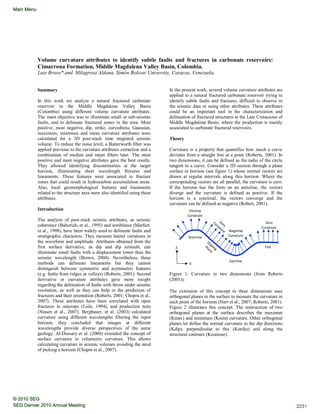
2) Volume curvature attributes, such as most positive and most negative, were better able to illuminate discontinuities and flexures associated with fracture zones and minor faults not evident in other seismic attributes or manual interpretation.
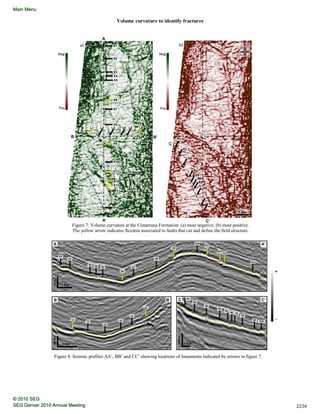
3) The identified lineaments from curvature attributes correlated with zones of high fracture density observed in well data, suggesting they could delineate faults with offsets below seismic resolution.