Download as PDF, PPTX


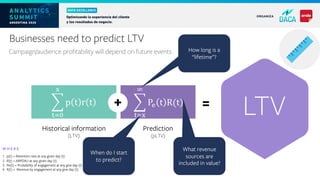
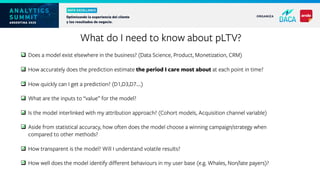
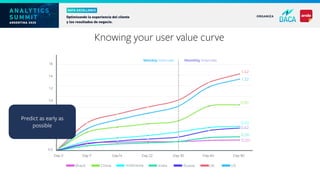
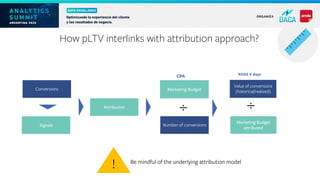

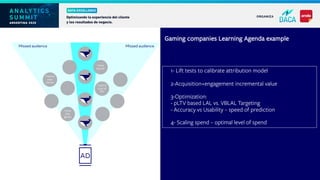
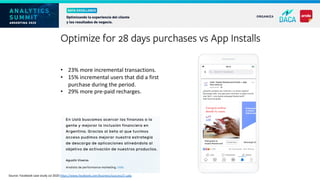

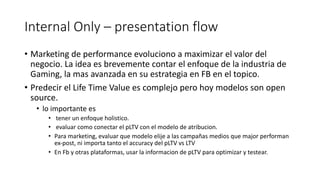

The document discusses the importance of measuring lifetime value (LTV) in marketing, particularly in the mobile age, highlighting the shift from volume-based to value-based marketing strategies. It emphasizes predicting LTV through various metrics and models, taking into account factors such as user engagement and retention. The document also stresses the need for aligning LTV predictions with attribution models to optimize marketing effectiveness and campaign strategies.


![Strategies for Achieving Native Scale Beyond the Walled Garden [Webinar]](https://cdn.slidesharecdn.com/ss_thumbnails/tripleliftappnexuswebinarfinal-160817171011-thumbnail.jpg?width=640&height=640&fit=bounds)