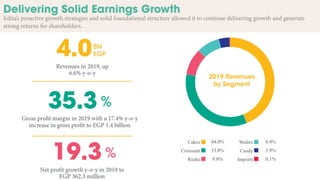
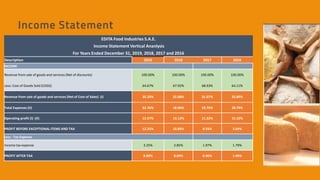
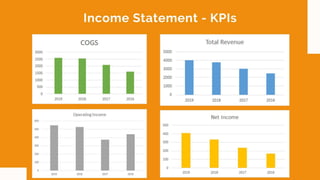
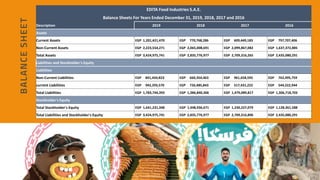
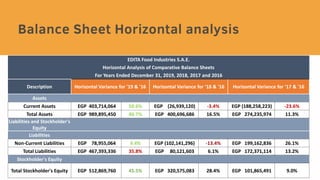
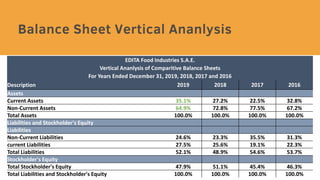
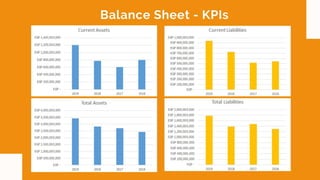
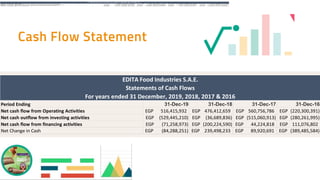
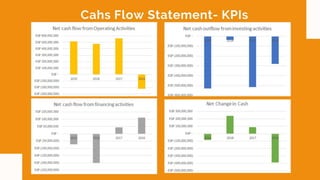
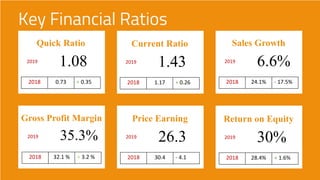
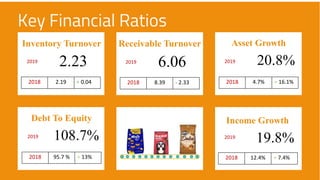
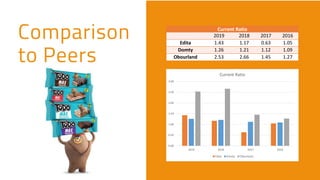
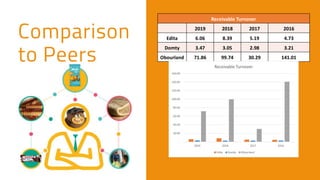
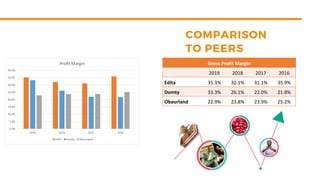
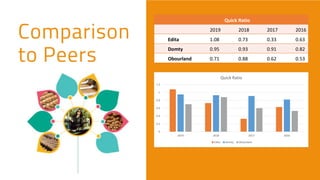
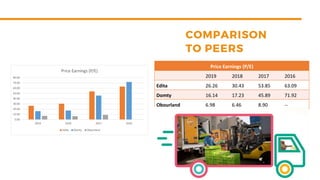
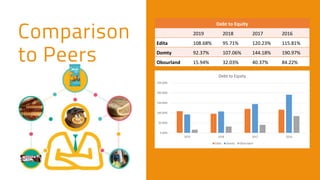
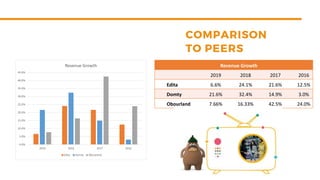
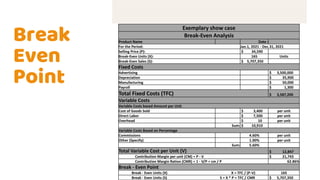
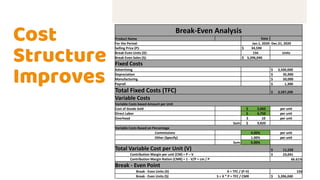
SlideShare a Scribd company logo
EDITA Food Industries S.A.E.
Income Statement Vertical Ananlysis
For Years Ended December 31, 2019, 2018, 2017 and 2016
Description 2019 2018 2017 2016
INCOME
Revenue from sale of goods and services (Net of discounts) 100.00% 100.00% 100.00% 100.00%
Less: Cost of Goods Sold (COGS) 64.67% 67.92% 68.93% 64.11%
Revenue from sale of goods and services (Net of Cost of Sales) (I) 35.33% 32.08% 31.07% 35.89%
Total Expenses (II) 22.76% 18.96% 19.75% 20.79%
Operating profit (I) -(II) 12.57% 13.12% 11.32% 15.10%
PROFIT BEFORE EXCEPTIONAL ITEMS AND TAX 12.25% 10.89% 8.93% 3.69%
Less : Tax Expense
Income tax expense 3.25% 2.85% 1.97% 1.79%
PROFIT AFTER TAX 9.00% 8.04% 6.96% 1.90%
EDITA Food Industries S.A.E.
Balance Sheets For Years Ended December 31, 2019, 2018, 2017 and 2016
Description 2019 2018 2017 2016
Assets
Current Assets EGP 1,201,421,470 EGP 770,768,286 EGP 609,449,183 EGP 797,707,406
Non-Current Assets EGP 2,223,554,271 EGP 2,065,008,691 EGP 2,099,867,082 EGP 1,637,372,885
Total Assets EGP 3,424,975,741 EGP 2,835,776,977 EGP 2,709,316,265 EGP 2,435,080,291
Liabilities and Stockholder's Equity
Liabilities
Non-Current Liabilities EGP 841,450,823 EGP 660,354,463 EGP 961,658,595 EGP 762,495,759
current Liabilities EGP 942,293,570 EGP 726,485,843 EGP 517,431,222 EGP 544,222,944
Total Liabilities EGP 1,783,744,393 EGP 1,386,840,306 EGP 1,479,089,817 EGP 1,306,718,703
Stockholder's Equity
Total Stockholder's Equity EGP 1,641,231,348 EGP 1,448,936,671 EGP 1,230,227,079 EGP 1,128,361,588
Total Liabilities and Stockholder's Equity EGP 3,424,975,741 EGP 2,835,776,977 EGP 2,709,316,896 EGP 2,435,080,291
EDITA Food Industries S.A.E.
Horizontal Analysis of Comparative Balance Sheets
For Years Ended December 31, 2019, 2018, 2017 and 2016
Description Horizontal Variance for '19 & '16 Horizontal Variance for '18 & '16 Horizontal Variance for '17 & '16
Assets
Current Assets EGP 403,714,064 50.6% EGP (26,939,120) -3.4% EGP (188,258,223) -23.6%
Total Assets EGP 989,895,450 40.7% EGP 400,696,686 16.5% EGP 274,235,974 11.3%
Liabilities and Stockholder's
Equity
Liabilities
Non-Current Liabilities EGP 78,955,064 9.4% EGP (102,141,296) -13.4% EGP 199,162,836 26.1%
Total Liabilities EGP 467,393,336 35.8% EGP 80,121,603 6.1% EGP 172,371,114 13.2%
Stockholder's Equity
Total Stockholder's Equity EGP 512,869,760 45.5% EGP 320,575,083 28.4% EGP 101,865,491 9.0%
EDITA Food Industries S.A.E.
Vertical Ananlysis of Comparitive Balance Sheets
For Years Ended December 31, 2019, 2018, 2017 and 2016
Description 2019 2018 2017 2016
Assets
Current Assets 35.1% 27.2% 22.5% 32.8%
Non-Current Assets 64.9% 72.8% 77.5% 67.2%
Total Assets 100.0% 100.0% 100.0% 100.0%
Liabilities and Stockholder's Equity
Liabilities
Non-Current Liabilities 24.6% 23.3% 35.5% 31.3%
current Liabilities 27.5% 25.6% 19.1% 22.3%
Total Liabilities 52.1% 48.9% 54.6% 53.7%
Stockholder's Equity
Total Stockholder's Equity 47.9% 51.1% 45.4% 46.3%
Total Liabilities and Stockholder's Equity 100.0% 100.0% 100.0% 100.0%
Period Ending 31-Dec-19 31-Dec-18 31-Dec-17 31-Dec-16
Net cash flow from Operating Activities 516,415,932
EGP 476,412,659
EGP 560,756,786
EGP (220,300,391)
EGP
Net cash outflow from investing activities (529,445,210)
EGP (36,689,836)
EGP (515,060,913)
EGP (280,261,995)
EGP
Net cash flow from financing activities (71,258,973)
EGP (200,224,590)
EGP 44,224,818
EGP 111,076,802
EGP
For years ended 31 December, 2019, 2018, 2017 & 2016
EDITA Food Industries S.A.E.
Statements of Cash Flows
Net Change in Cash (84,288,251)
EGP 239,498,233
EGP 89,920,691
EGP (389,485,584)
EGP
Period Ending 31-Dec-19 31-Dec-18 31-Dec-17 31-Dec-16
Net cash flow from Operating Activities 516,415,932
EGP 476,412,659
EGP 560,756,786
EGP (220,300,391)
EGP
Net cash outflow from investing activities (529,445,210)
EGP (36,689,836)
EGP (515,060,913)
EGP (280,261,995)
EGP
Net cash flow from financing activities (71,258,973)
EGP (200,224,590)
EGP 44,224,818
EGP 111,076,802
EGP
For years ended 31 December, 2019, 2018, 2017 & 2016
EDITA Food Industries S.A.E.
Statements of Cash Flows
Ne
t C
hange in C
ash (84,288,251)
EG
P 239,498,233
EG
P 89,920,691
EG
P (389,485,584)
EG
P
Quick Ratio
2019
1.08
2018 0.73 + 0.35
Current Ratio
2019
1.43
2018 1.17 + 0.26
Sales Growth
2019
6.6%
2018 24.1% - 17.5%
Gross Profit Margin
2019 35.3%
2018 32.1 % + 3.2 %
Price Earning
2019
26.3
2018 30.4 - 4.1
Return on Equity
2019
30%
2018 28.4% + 1.6%
Inventory Turnover
2019
2.23
2018 2.19 + 0.04
Receivable Turnover
2019
6.06
2018 8.39 - 2.33
Asset Growth
2019 20.8%
2018 4.7% + 16.1%
Debt To Equity
2019 108.7%
2018 95.7 % + 13%
Income Growth
2019
19.8%
2018 12.4% + 7.4%
Current Ratio
2019 2018 2017 2016
Edita 1.43 1.17 0.63 1.05
Domty 1.26 1.21 1.12 1.09
Obourland 2.53 2.66 1.45 1.27
0.00
0.50
1.00
1.50
2.00
2.50
3.00
2019 2018 2017 2016
Current Ratio
Edita Domty Obourland
Receivable Turnover
2019 2018 2017 2016
Edita 6.06 8.39 5.19 4.73
Domty 3.47 3.05 2.98 3.21
Obourland 71.86 99.74 30.29 141.01
-
20.00
40.00
60.00
80.00
100.00
120.00
140.00
160.00
2019 2018 2017 2016
Receivable Turnover
Edita Domty Obourland
Gross Profit Margin
2019 2018 2017 2016
Edita 35.3% 32.1% 31.1% 35.9%
Domty 33.3% 26.1% 22.0% 21.8%
Obourland 22.9% 23.8% 23.9% 25.2%
0.0%
5.0%
10.0%
15.0%
20.0%
25.0%
30.0%
35.0%
40.0%
2019 2018 2017 2016
Profit Margin
Edita Domty Obourland
Quick Ratio
2019 2018 2017 2016
Edita 1.08 0.73 0.33 0.63
Domty 0.95 0.93 0.91 0.82
Obourland 0.71 0.88 0.62 0.53
0
0.2
0.4
0.6
0.8
1
1.2
2019 2018 2017 2016
Quick Ratio
Edita Domty Obourland
Price Earnings (P/E)
2019 2018 2017 2016
Edita 26.26 30.43 53.85 63.09
Domty 16.14 17.23 45.89 71.92
Obourland 6.98 6.46 8.90 --
0.00
10.00
20.00
30.00
40.00
50.00
60.00
70.00
80.00
2019 2018 2017 2016
Price Earnings (P/E)
Edita Domty Obourland
Debt to Equity
2019 2018 2017 2016
Edita 108.68% 95.71% 120.23% 115.81%
Domty 92.37% 107.06% 144.18% 190.97%
Obourland 15.94% 32.03% 40.37% 84.22%
0.00%
50.00%
100.00%
150.00%
200.00%
250.00%
2019 2018 2017 2016
Debt to Equity
Edita Domty Obourland
Revenue Growth
2019 2018 2017 2016
Edita 6.6% 24.1% 21.6% 12.5%
Domty 21.6% 32.4% 14.9% 3.0%
Obourland 7.66% 16.33% 42.5% 24.0%
0.0%
5.0%
10.0%
15.0%
20.0%
25.0%
30.0%
35.0%
40.0%
45.0%
2019 2018 2017 2016
Revenue Growth
Edita Domty Obourland
Exemplary show case
Break-Even Analysis
Product Name Date :
For the Period: Jan.1, 2021 - Dec.31, 2021
Selling Price (P): $ 34,590
Break-Even Units (X): 165 Units
Break-Even Sales (S): $ 5,707,350
Fixed Costs
Advertising $ 3,500,000
Depreciation $ 35,900
Manufacturing $ 50,000
Payroll $ 1,300
Total Fixed Costs (TFC) $ 3,587,200
Variable Costs
Variable Costs based Amount per Unit
Cost of Goods Sold $ 3,400 per unit
Direct Labor $ 7,500 per unit
Overhead $ 10 per unit
Sum: $ 10,910
Variable Costs Based on Percentage
Commissions 4.60% per unit
Other (Specify) 1.00% per unit
Sum: 5.60%
Total Variable Cost per Unit (V) $ 12,847
Contribution Margin per unit (CM) = P - V $ 21,743
Contribution Margin Ration (CMR) = 1 - V/P = cm / P 62.86%
Break - Even Point
Break - Even Units (X) X = TFC / (P-V) 165
Break - Even Units (S) S = X * P = TFC / CMR $ 5,707,350
Reducing the Amount of
Fixed Cost
Reducing the Variable
Cost Per Unit
Increase Selling Price
Break-Even Analysis
Product Name Date :
For the Period: Jan.1, 2020- Dec.31, 2020
Selling Price (P): $ 34,590
Break-Even Units (X): 156 Units
Break-Even Sales (S): $ 5,396,040
Fixed Costs
Advertising $ 3,500,000
Depreciation $ 35,900
Manufacturing $ 50,000
Payroll $ 1,300
Total Fixed Costs (TFC) $ 3,587,200
Variable Costs
Variable Costs based Amount per Unit
Cost of Goods Sold $ 3,060 per unit
Direct Labor $ 6,750 per unit
Overhead $ 10 per unit
Sum: $ 9,820
Variable Costs Based on Percentage
Commissions 4.00% per unit
Other (Specify) 1.00% per unit
Sum: 5.00%
Total Variable Cost per Unit (V) $ 11,550
Contribution Margin per unit (CM) = P – V $ 23,041
Contribution Margin Ration (CMR) = 1 - V/P = cm / P 66.61%
Break - Even Point
Break - Even Units (X) X = TFC / (P-V) 156
Break - Even Units (S) S = X * P = TFC / CMR $ 5,396,040
Investing Activities
Cost Structure For Bakery & Rusk
Financing Growth
Profit Margin
Inventory Turnover
Quick Ratio
Receivables Turnover
Overall Performance
Edita Financial Analysis

More Related Content

What's hot

Toyota supply chain management
Toyota supply chain managementToyota supply chain management
Toyota supply chain management
Abhinav Kp
 
Toyota SCM
Toyota SCMToyota SCM
Toyota SCM
Aniruddh Tiwari
 
Gm Marketing Strategy1[1]
Gm Marketing Strategy1[1]Gm Marketing Strategy1[1]
Gm Marketing Strategy1[1]
ndessouky
 
Toyota case study
Toyota case studyToyota case study
Toyota case study
MdAbuKausarBhuiyan
 
International marketing: Emirates Airlines case study
International marketing: Emirates Airlines case studyInternational marketing: Emirates Airlines case study
International marketing: Emirates Airlines case study
Tamim Bin Shafique
 
Juhayna Food Industries - Initiation of Coverage - 22 February 2016
Juhayna Food Industries - Initiation of Coverage - 22 February 2016Juhayna Food Industries - Initiation of Coverage - 22 February 2016
Juhayna Food Industries - Initiation of Coverage - 22 February 2016Omneya El Hammamy
 
Toyota
ToyotaToyota
jet airways (Turnaround Strategy of Jet Airways) strategic management
jet airways (Turnaround Strategy of Jet Airways) strategic managementjet airways (Turnaround Strategy of Jet Airways) strategic management
jet airways (Turnaround Strategy of Jet Airways) strategic management
Purva Kini
 
Lufthansa Case Study
Lufthansa Case StudyLufthansa Case Study
Lufthansa Case Study
Donnych Diaz
 
Merger&Acquisitions-VW&Porsche
Merger&Acquisitions-VW&PorscheMerger&Acquisitions-VW&Porsche
Merger&Acquisitions-VW&Porsche
Gerhard Aggstein
 
TMG - Re Initiation of Coverage 26 Nov 2014
TMG - Re Initiation of Coverage 26 Nov 2014TMG - Re Initiation of Coverage 26 Nov 2014
TMG - Re Initiation of Coverage 26 Nov 2014Mahmoud Ibrahim
 
Toyota Digital Marketing Strategy
Toyota Digital Marketing StrategyToyota Digital Marketing Strategy
Toyota Digital Marketing Strategy
zhenyu zou
 
Toyota case study
Toyota case studyToyota case study
Toyota case study
Pragati Agrawal
 
Toyota - Setting Product Strategy
Toyota - Setting Product StrategyToyota - Setting Product Strategy
Toyota - Setting Product Strategy
Karan Shah
 
Emirates Strategy Analysis
Emirates Strategy AnalysisEmirates Strategy Analysis
Emirates Strategy Analysis
Tina Sepehrifar
 

What's hot (20)

Toyota supply chain management
Toyota supply chain managementToyota supply chain management
Toyota supply chain management
 
Toyota SCM
Toyota SCMToyota SCM
Toyota SCM
 
Gm Marketing Strategy1[1]
Gm Marketing Strategy1[1]Gm Marketing Strategy1[1]
Gm Marketing Strategy1[1]
 
Ford presetation
Ford presetationFord presetation
Ford presetation
 
Toyota case study
Toyota case studyToyota case study
Toyota case study
 
TOYOTA
TOYOTATOYOTA
TOYOTA
 
International marketing: Emirates Airlines case study
International marketing: Emirates Airlines case studyInternational marketing: Emirates Airlines case study
International marketing: Emirates Airlines case study
 
Juhayna Food Industries - Initiation of Coverage - 22 February 2016
Juhayna Food Industries - Initiation of Coverage - 22 February 2016Juhayna Food Industries - Initiation of Coverage - 22 February 2016
Juhayna Food Industries - Initiation of Coverage - 22 February 2016
 
Toyota
ToyotaToyota
Toyota
 
Ford pp
Ford ppFord pp
Ford pp
 
jet airways (Turnaround Strategy of Jet Airways) strategic management
jet airways (Turnaround Strategy of Jet Airways) strategic managementjet airways (Turnaround Strategy of Jet Airways) strategic management
jet airways (Turnaround Strategy of Jet Airways) strategic management
 
Lufthansa Case Study
Lufthansa Case StudyLufthansa Case Study
Lufthansa Case Study
 
Merger&Acquisitions-VW&Porsche
Merger&Acquisitions-VW&PorscheMerger&Acquisitions-VW&Porsche
Merger&Acquisitions-VW&Porsche
 
TMG - Re Initiation of Coverage 26 Nov 2014
TMG - Re Initiation of Coverage 26 Nov 2014TMG - Re Initiation of Coverage 26 Nov 2014
TMG - Re Initiation of Coverage 26 Nov 2014
 
Toyota Digital Marketing Strategy
Toyota Digital Marketing StrategyToyota Digital Marketing Strategy
Toyota Digital Marketing Strategy
 
Ferrari
FerrariFerrari
Ferrari
 
Toyota case study
Toyota case studyToyota case study
Toyota case study
 
Toyota
ToyotaToyota
Toyota
 
Toyota - Setting Product Strategy
Toyota - Setting Product StrategyToyota - Setting Product Strategy
Toyota - Setting Product Strategy
 
Emirates Strategy Analysis
Emirates Strategy AnalysisEmirates Strategy Analysis
Emirates Strategy Analysis
 

Similar to Edita Financial Analysis

Zydus Wellness reports a subdued quarter, hold - Nirmal Bang
Zydus Wellness reports a subdued quarter, hold - Nirmal BangZydus Wellness reports a subdued quarter, hold - Nirmal Bang
Zydus Wellness reports a subdued quarter, hold - Nirmal BangIndiaNotes.com
 
Cfa research presentation university at buffalo
Cfa research presentation university at buffalo Cfa research presentation university at buffalo
Cfa research presentation university at buffalo
Ke Guo
 
Financial Statement Analysis PowerPoint Presentation Slides
Financial Statement Analysis PowerPoint Presentation SlidesFinancial Statement Analysis PowerPoint Presentation Slides
Financial Statement Analysis PowerPoint Presentation Slides
SlideTeam
 
Q2 results overview 2014
Q2 results overview 2014Q2 results overview 2014
Q2 results overview 2014
Clutch animation house
 
Financial Statement Analysis Powerpoint Presentation Slides
Financial Statement Analysis Powerpoint Presentation SlidesFinancial Statement Analysis Powerpoint Presentation Slides
Financial Statement Analysis Powerpoint Presentation Slides
SlideTeam
 
1. Prepare and analize the common statement for An.pdf
1. Prepare and analize the common statement for An.pdf1. Prepare and analize the common statement for An.pdf
1. Prepare and analize the common statement for An.pdf
lejeunehayneswowel96
 
Delta Galil Industries Q3 Results
Delta Galil Industries Q3 ResultsDelta Galil Industries Q3 Results
Delta Galil Industries Q3 Results
Factstories
 
Analyst presentation q2 2019
Analyst presentation   q2 2019Analyst presentation   q2 2019
Analyst presentation q2 2019
Clutch animation house
 
Delta Galil Reports Strong Performance for Third Quarter of 2014
Delta Galil Reports Strong Performance for Third Quarter of 2014Delta Galil Reports Strong Performance for Third Quarter of 2014
Delta Galil Reports Strong Performance for Third Quarter of 2014
Clutch animation house
 
Hansson
HanssonHansson
Analyst presentation q4 2019
Analyst presentation   q4 2019Analyst presentation   q4 2019
Analyst presentation q4 2019
Clutch animation house
 
Presentation Material for 3Q / Mar. 2020
Presentation Material for 3Q / Mar. 2020Presentation Material for 3Q / Mar. 2020
Presentation Material for 3Q / Mar. 2020
RicohLease
 
Example print out-efm-de
Example print out-efm-deExample print out-efm-de
Example print out-efm-de
Excel Financial Model
 
Q4 16 earnings deck 2017.01.31 v final
Q4 16 earnings deck 2017.01.31 v finalQ4 16 earnings deck 2017.01.31 v final
Q4 16 earnings deck 2017.01.31 v final
chrobinsonir
 
Press release presentation 2014
Press release presentation 2014Press release presentation 2014
Press release presentation 2014Juliana Arutin
 
Example Presentation Of Financial Reports PowerPoint Presentation Slides
Example Presentation Of Financial Reports PowerPoint Presentation Slides Example Presentation Of Financial Reports PowerPoint Presentation Slides
Example Presentation Of Financial Reports PowerPoint Presentation Slides
SlideTeam
 
Analyst presentation Q2 2017
Analyst presentation Q2 2017Analyst presentation Q2 2017
Analyst presentation Q2 2017
Osnat Naot
 
Fixed Capital Analysis PowerPoint Presentation Slides
Fixed Capital Analysis PowerPoint Presentation SlidesFixed Capital Analysis PowerPoint Presentation Slides
Fixed Capital Analysis PowerPoint Presentation Slides
SlideTeam
 
Deutsche EuroShop - Conference Call Presentation - Preliminary Results FY 2015
Deutsche EuroShop - Conference Call Presentation - Preliminary Results FY 2015Deutsche EuroShop - Conference Call Presentation - Preliminary Results FY 2015
Deutsche EuroShop - Conference Call Presentation - Preliminary Results FY 2015
Deutsche EuroShop AG
 

Similar to Edita Financial Analysis (20)

Zydus Wellness reports a subdued quarter, hold - Nirmal Bang
Zydus Wellness reports a subdued quarter, hold - Nirmal BangZydus Wellness reports a subdued quarter, hold - Nirmal Bang
Zydus Wellness reports a subdued quarter, hold - Nirmal Bang
 
Cfa research presentation university at buffalo
Cfa research presentation university at buffalo Cfa research presentation university at buffalo
Cfa research presentation university at buffalo
 
Financial Statement Analysis PowerPoint Presentation Slides
Financial Statement Analysis PowerPoint Presentation SlidesFinancial Statement Analysis PowerPoint Presentation Slides
Financial Statement Analysis PowerPoint Presentation Slides
 
Q2 results overview 2014
Q2 results overview 2014Q2 results overview 2014
Q2 results overview 2014
 
Financial Statement Analysis Powerpoint Presentation Slides
Financial Statement Analysis Powerpoint Presentation SlidesFinancial Statement Analysis Powerpoint Presentation Slides
Financial Statement Analysis Powerpoint Presentation Slides
 
1. Prepare and analize the common statement for An.pdf
1. Prepare and analize the common statement for An.pdf1. Prepare and analize the common statement for An.pdf
1. Prepare and analize the common statement for An.pdf
 
Delta Galil Industries Q3 Results
Delta Galil Industries Q3 ResultsDelta Galil Industries Q3 Results
Delta Galil Industries Q3 Results
 
Analyst presentation q2 2019
Analyst presentation   q2 2019Analyst presentation   q2 2019
Analyst presentation q2 2019
 
Delta Galil Reports Strong Performance for Third Quarter of 2014
Delta Galil Reports Strong Performance for Third Quarter of 2014Delta Galil Reports Strong Performance for Third Quarter of 2014
Delta Galil Reports Strong Performance for Third Quarter of 2014
 
Hansson
HanssonHansson
Hansson
 
Analyst presentation q4 2019
Analyst presentation   q4 2019Analyst presentation   q4 2019
Analyst presentation q4 2019
 
CNR_DCF(USD)
CNR_DCF(USD)CNR_DCF(USD)
CNR_DCF(USD)
 
Presentation Material for 3Q / Mar. 2020
Presentation Material for 3Q / Mar. 2020Presentation Material for 3Q / Mar. 2020
Presentation Material for 3Q / Mar. 2020
 
Example print out-efm-de
Example print out-efm-deExample print out-efm-de
Example print out-efm-de
 
Q4 16 earnings deck 2017.01.31 v final
Q4 16 earnings deck 2017.01.31 v finalQ4 16 earnings deck 2017.01.31 v final
Q4 16 earnings deck 2017.01.31 v final
 
Press release presentation 2014
Press release presentation 2014Press release presentation 2014
Press release presentation 2014
 
Example Presentation Of Financial Reports PowerPoint Presentation Slides
Example Presentation Of Financial Reports PowerPoint Presentation Slides Example Presentation Of Financial Reports PowerPoint Presentation Slides
Example Presentation Of Financial Reports PowerPoint Presentation Slides
 
Analyst presentation Q2 2017
Analyst presentation Q2 2017Analyst presentation Q2 2017
Analyst presentation Q2 2017
 
Fixed Capital Analysis PowerPoint Presentation Slides
Fixed Capital Analysis PowerPoint Presentation SlidesFixed Capital Analysis PowerPoint Presentation Slides
Fixed Capital Analysis PowerPoint Presentation Slides
 
Deutsche EuroShop - Conference Call Presentation - Preliminary Results FY 2015
Deutsche EuroShop - Conference Call Presentation - Preliminary Results FY 2015Deutsche EuroShop - Conference Call Presentation - Preliminary Results FY 2015
Deutsche EuroShop - Conference Call Presentation - Preliminary Results FY 2015
 

Recently uploaded

what is the best method to sell pi coins in 2024
what is the best method to sell pi coins in 2024what is the best method to sell pi coins in 2024
what is the best method to sell pi coins in 2024
DOT TECH
 
Introduction to Value Added Tax System.ppt
Introduction to Value Added Tax System.pptIntroduction to Value Added Tax System.ppt
Introduction to Value Added Tax System.ppt
VishnuVenugopal84
 
The WhatsPump Pseudonym Problem and the Hilarious Downfall of Artificial Enga...
The WhatsPump Pseudonym Problem and the Hilarious Downfall of Artificial Enga...The WhatsPump Pseudonym Problem and the Hilarious Downfall of Artificial Enga...
The WhatsPump Pseudonym Problem and the Hilarious Downfall of Artificial Enga...
muslimdavidovich670
 
How to get verified on Coinbase Account?_.docx
How to get verified on Coinbase Account?_.docxHow to get verified on Coinbase Account?_.docx
How to get verified on Coinbase Account?_.docx
Buy bitget
 
Turin Startup Ecosystem 2024 - Ricerca sulle Startup e il Sistema dell'Innov...
Turin Startup Ecosystem 2024  - Ricerca sulle Startup e il Sistema dell'Innov...Turin Startup Ecosystem 2024  - Ricerca sulle Startup e il Sistema dell'Innov...
Turin Startup Ecosystem 2024 - Ricerca sulle Startup e il Sistema dell'Innov...
Quotidiano Piemontese
 
how to sell pi coins on Bitmart crypto exchange
how to sell pi coins on Bitmart crypto exchangehow to sell pi coins on Bitmart crypto exchange
how to sell pi coins on Bitmart crypto exchange
DOT TECH
 
The secret way to sell pi coins effortlessly.
The secret way to sell pi coins effortlessly.The secret way to sell pi coins effortlessly.
The secret way to sell pi coins effortlessly.
DOT TECH
 
655264371-checkpoint-science-past-papers-april-2023.pdf
655264371-checkpoint-science-past-papers-april-2023.pdf655264371-checkpoint-science-past-papers-april-2023.pdf
655264371-checkpoint-science-past-papers-april-2023.pdf
morearsh02
 
where can I find a legit pi merchant online
where can I find a legit pi merchant onlinewhere can I find a legit pi merchant online
where can I find a legit pi merchant online
DOT TECH
 
how can I sell pi coins after successfully completing KYC
how can I sell pi coins after successfully completing KYChow can I sell pi coins after successfully completing KYC
how can I sell pi coins after successfully completing KYC
DOT TECH
 
how to sell pi coins at high rate quickly.
how to sell pi coins at high rate quickly.how to sell pi coins at high rate quickly.
how to sell pi coins at high rate quickly.
DOT TECH
 
The Evolution of Non-Banking Financial Companies (NBFCs) in India: Challenges...
The Evolution of Non-Banking Financial Companies (NBFCs) in India: Challenges...The Evolution of Non-Banking Financial Companies (NBFCs) in India: Challenges...
The Evolution of Non-Banking Financial Companies (NBFCs) in India: Challenges...
beulahfernandes8
 
Intro_Economics_ GPresentation Week 4.pptx
Intro_Economics_ GPresentation Week 4.pptxIntro_Economics_ GPresentation Week 4.pptx
Intro_Economics_ GPresentation Week 4.pptx
shetivia
 
what is the future of Pi Network currency.
what is the future of Pi Network currency.what is the future of Pi Network currency.
what is the future of Pi Network currency.
DOT TECH
 
What price will pi network be listed on exchanges
What price will pi network be listed on exchangesWhat price will pi network be listed on exchanges
What price will pi network be listed on exchanges
DOT TECH
 
managementaccountingunitiv-230422140105-dd17d80b.ppt
managementaccountingunitiv-230422140105-dd17d80b.pptmanagementaccountingunitiv-230422140105-dd17d80b.ppt
managementaccountingunitiv-230422140105-dd17d80b.ppt
SuseelaPalanimuthu
 
Financial Assets: Debit vs Equity Securities.pptx
Financial Assets: Debit vs Equity Securities.pptxFinancial Assets: Debit vs Equity Securities.pptx
Financial Assets: Debit vs Equity Securities.pptx
Writo-Finance
 
Exploring Abhay Bhutada’s Views After Poonawalla Fincorp’s Collaboration With...
Exploring Abhay Bhutada’s Views After Poonawalla Fincorp’s Collaboration With...Exploring Abhay Bhutada’s Views After Poonawalla Fincorp’s Collaboration With...
Exploring Abhay Bhutada’s Views After Poonawalla Fincorp’s Collaboration With...
beulahfernandes8
 
when will pi network coin be available on crypto exchange.
when will pi network coin be available on crypto exchange.when will pi network coin be available on crypto exchange.
when will pi network coin be available on crypto exchange.
DOT TECH
 
Introduction to Indian Financial System ()
Introduction to Indian Financial System ()Introduction to Indian Financial System ()
Introduction to Indian Financial System ()
Avanish Goel
 

Recently uploaded (20)

what is the best method to sell pi coins in 2024
what is the best method to sell pi coins in 2024what is the best method to sell pi coins in 2024
what is the best method to sell pi coins in 2024
 
Introduction to Value Added Tax System.ppt
Introduction to Value Added Tax System.pptIntroduction to Value Added Tax System.ppt
Introduction to Value Added Tax System.ppt
 
The WhatsPump Pseudonym Problem and the Hilarious Downfall of Artificial Enga...
The WhatsPump Pseudonym Problem and the Hilarious Downfall of Artificial Enga...The WhatsPump Pseudonym Problem and the Hilarious Downfall of Artificial Enga...
The WhatsPump Pseudonym Problem and the Hilarious Downfall of Artificial Enga...
 
How to get verified on Coinbase Account?_.docx
How to get verified on Coinbase Account?_.docxHow to get verified on Coinbase Account?_.docx
How to get verified on Coinbase Account?_.docx
 
Turin Startup Ecosystem 2024 - Ricerca sulle Startup e il Sistema dell'Innov...
Turin Startup Ecosystem 2024  - Ricerca sulle Startup e il Sistema dell'Innov...Turin Startup Ecosystem 2024  - Ricerca sulle Startup e il Sistema dell'Innov...
Turin Startup Ecosystem 2024 - Ricerca sulle Startup e il Sistema dell'Innov...
 
how to sell pi coins on Bitmart crypto exchange
how to sell pi coins on Bitmart crypto exchangehow to sell pi coins on Bitmart crypto exchange
how to sell pi coins on Bitmart crypto exchange
 
The secret way to sell pi coins effortlessly.
The secret way to sell pi coins effortlessly.The secret way to sell pi coins effortlessly.
The secret way to sell pi coins effortlessly.
 
655264371-checkpoint-science-past-papers-april-2023.pdf
655264371-checkpoint-science-past-papers-april-2023.pdf655264371-checkpoint-science-past-papers-april-2023.pdf
655264371-checkpoint-science-past-papers-april-2023.pdf
 
where can I find a legit pi merchant online
where can I find a legit pi merchant onlinewhere can I find a legit pi merchant online
where can I find a legit pi merchant online
 
how can I sell pi coins after successfully completing KYC
how can I sell pi coins after successfully completing KYChow can I sell pi coins after successfully completing KYC
how can I sell pi coins after successfully completing KYC
 
how to sell pi coins at high rate quickly.
how to sell pi coins at high rate quickly.how to sell pi coins at high rate quickly.
how to sell pi coins at high rate quickly.
 
The Evolution of Non-Banking Financial Companies (NBFCs) in India: Challenges...
The Evolution of Non-Banking Financial Companies (NBFCs) in India: Challenges...The Evolution of Non-Banking Financial Companies (NBFCs) in India: Challenges...
The Evolution of Non-Banking Financial Companies (NBFCs) in India: Challenges...
 
Intro_Economics_ GPresentation Week 4.pptx
Intro_Economics_ GPresentation Week 4.pptxIntro_Economics_ GPresentation Week 4.pptx
Intro_Economics_ GPresentation Week 4.pptx
 
what is the future of Pi Network currency.
what is the future of Pi Network currency.what is the future of Pi Network currency.
what is the future of Pi Network currency.
 
What price will pi network be listed on exchanges
What price will pi network be listed on exchangesWhat price will pi network be listed on exchanges
What price will pi network be listed on exchanges
 
managementaccountingunitiv-230422140105-dd17d80b.ppt
managementaccountingunitiv-230422140105-dd17d80b.pptmanagementaccountingunitiv-230422140105-dd17d80b.ppt
managementaccountingunitiv-230422140105-dd17d80b.ppt
 
Financial Assets: Debit vs Equity Securities.pptx
Financial Assets: Debit vs Equity Securities.pptxFinancial Assets: Debit vs Equity Securities.pptx
Financial Assets: Debit vs Equity Securities.pptx
 
Exploring Abhay Bhutada’s Views After Poonawalla Fincorp’s Collaboration With...
Exploring Abhay Bhutada’s Views After Poonawalla Fincorp’s Collaboration With...Exploring Abhay Bhutada’s Views After Poonawalla Fincorp’s Collaboration With...
Exploring Abhay Bhutada’s Views After Poonawalla Fincorp’s Collaboration With...
 
when will pi network coin be available on crypto exchange.
when will pi network coin be available on crypto exchange.when will pi network coin be available on crypto exchange.
when will pi network coin be available on crypto exchange.
 
Introduction to Indian Financial System ()
Introduction to Indian Financial System ()Introduction to Indian Financial System ()
Introduction to Indian Financial System ()
 

Edita Financial Analysis

  • 1.
  • 2.
  • 3.
  • 4.
  • 5. EDITA Food Industries S.A.E. Income Statement Vertical Ananlysis For Years Ended December 31, 2019, 2018, 2017 and 2016 Description 2019 2018 2017 2016 INCOME Revenue from sale of goods and services (Net of discounts) 100.00% 100.00% 100.00% 100.00% Less: Cost of Goods Sold (COGS) 64.67% 67.92% 68.93% 64.11% Revenue from sale of goods and services (Net of Cost of Sales) (I) 35.33% 32.08% 31.07% 35.89% Total Expenses (II) 22.76% 18.96% 19.75% 20.79% Operating profit (I) -(II) 12.57% 13.12% 11.32% 15.10% PROFIT BEFORE EXCEPTIONAL ITEMS AND TAX 12.25% 10.89% 8.93% 3.69% Less : Tax Expense Income tax expense 3.25% 2.85% 1.97% 1.79% PROFIT AFTER TAX 9.00% 8.04% 6.96% 1.90%
  • 6.
  • 7.
  • 8. EDITA Food Industries S.A.E. Balance Sheets For Years Ended December 31, 2019, 2018, 2017 and 2016 Description 2019 2018 2017 2016 Assets Current Assets EGP 1,201,421,470 EGP 770,768,286 EGP 609,449,183 EGP 797,707,406 Non-Current Assets EGP 2,223,554,271 EGP 2,065,008,691 EGP 2,099,867,082 EGP 1,637,372,885 Total Assets EGP 3,424,975,741 EGP 2,835,776,977 EGP 2,709,316,265 EGP 2,435,080,291 Liabilities and Stockholder's Equity Liabilities Non-Current Liabilities EGP 841,450,823 EGP 660,354,463 EGP 961,658,595 EGP 762,495,759 current Liabilities EGP 942,293,570 EGP 726,485,843 EGP 517,431,222 EGP 544,222,944 Total Liabilities EGP 1,783,744,393 EGP 1,386,840,306 EGP 1,479,089,817 EGP 1,306,718,703 Stockholder's Equity Total Stockholder's Equity EGP 1,641,231,348 EGP 1,448,936,671 EGP 1,230,227,079 EGP 1,128,361,588 Total Liabilities and Stockholder's Equity EGP 3,424,975,741 EGP 2,835,776,977 EGP 2,709,316,896 EGP 2,435,080,291
  • 9. EDITA Food Industries S.A.E. Horizontal Analysis of Comparative Balance Sheets For Years Ended December 31, 2019, 2018, 2017 and 2016 Description Horizontal Variance for '19 & '16 Horizontal Variance for '18 & '16 Horizontal Variance for '17 & '16 Assets Current Assets EGP 403,714,064 50.6% EGP (26,939,120) -3.4% EGP (188,258,223) -23.6% Total Assets EGP 989,895,450 40.7% EGP 400,696,686 16.5% EGP 274,235,974 11.3% Liabilities and Stockholder's Equity Liabilities Non-Current Liabilities EGP 78,955,064 9.4% EGP (102,141,296) -13.4% EGP 199,162,836 26.1% Total Liabilities EGP 467,393,336 35.8% EGP 80,121,603 6.1% EGP 172,371,114 13.2% Stockholder's Equity Total Stockholder's Equity EGP 512,869,760 45.5% EGP 320,575,083 28.4% EGP 101,865,491 9.0%
  • 10. EDITA Food Industries S.A.E. Vertical Ananlysis of Comparitive Balance Sheets For Years Ended December 31, 2019, 2018, 2017 and 2016 Description 2019 2018 2017 2016 Assets Current Assets 35.1% 27.2% 22.5% 32.8% Non-Current Assets 64.9% 72.8% 77.5% 67.2% Total Assets 100.0% 100.0% 100.0% 100.0% Liabilities and Stockholder's Equity Liabilities Non-Current Liabilities 24.6% 23.3% 35.5% 31.3% current Liabilities 27.5% 25.6% 19.1% 22.3% Total Liabilities 52.1% 48.9% 54.6% 53.7% Stockholder's Equity Total Stockholder's Equity 47.9% 51.1% 45.4% 46.3% Total Liabilities and Stockholder's Equity 100.0% 100.0% 100.0% 100.0%
  • 11.
  • 12. Period Ending 31-Dec-19 31-Dec-18 31-Dec-17 31-Dec-16 Net cash flow from Operating Activities 516,415,932 EGP 476,412,659 EGP 560,756,786 EGP (220,300,391) EGP Net cash outflow from investing activities (529,445,210) EGP (36,689,836) EGP (515,060,913) EGP (280,261,995) EGP Net cash flow from financing activities (71,258,973) EGP (200,224,590) EGP 44,224,818 EGP 111,076,802 EGP For years ended 31 December, 2019, 2018, 2017 & 2016 EDITA Food Industries S.A.E. Statements of Cash Flows Net Change in Cash (84,288,251) EGP 239,498,233 EGP 89,920,691 EGP (389,485,584) EGP Period Ending 31-Dec-19 31-Dec-18 31-Dec-17 31-Dec-16 Net cash flow from Operating Activities 516,415,932 EGP 476,412,659 EGP 560,756,786 EGP (220,300,391) EGP Net cash outflow from investing activities (529,445,210) EGP (36,689,836) EGP (515,060,913) EGP (280,261,995) EGP Net cash flow from financing activities (71,258,973) EGP (200,224,590) EGP 44,224,818 EGP 111,076,802 EGP For years ended 31 December, 2019, 2018, 2017 & 2016 EDITA Food Industries S.A.E. Statements of Cash Flows Ne t C hange in C ash (84,288,251) EG P 239,498,233 EG P 89,920,691 EG P (389,485,584) EG P
  • 13.
  • 14. Quick Ratio 2019 1.08 2018 0.73 + 0.35 Current Ratio 2019 1.43 2018 1.17 + 0.26 Sales Growth 2019 6.6% 2018 24.1% - 17.5% Gross Profit Margin 2019 35.3% 2018 32.1 % + 3.2 % Price Earning 2019 26.3 2018 30.4 - 4.1 Return on Equity 2019 30% 2018 28.4% + 1.6%
  • 15. Inventory Turnover 2019 2.23 2018 2.19 + 0.04 Receivable Turnover 2019 6.06 2018 8.39 - 2.33 Asset Growth 2019 20.8% 2018 4.7% + 16.1% Debt To Equity 2019 108.7% 2018 95.7 % + 13% Income Growth 2019 19.8% 2018 12.4% + 7.4%
  • 16. Current Ratio 2019 2018 2017 2016 Edita 1.43 1.17 0.63 1.05 Domty 1.26 1.21 1.12 1.09 Obourland 2.53 2.66 1.45 1.27 0.00 0.50 1.00 1.50 2.00 2.50 3.00 2019 2018 2017 2016 Current Ratio Edita Domty Obourland
  • 17. Receivable Turnover 2019 2018 2017 2016 Edita 6.06 8.39 5.19 4.73 Domty 3.47 3.05 2.98 3.21 Obourland 71.86 99.74 30.29 141.01 - 20.00 40.00 60.00 80.00 100.00 120.00 140.00 160.00 2019 2018 2017 2016 Receivable Turnover Edita Domty Obourland
  • 18. Gross Profit Margin 2019 2018 2017 2016 Edita 35.3% 32.1% 31.1% 35.9% Domty 33.3% 26.1% 22.0% 21.8% Obourland 22.9% 23.8% 23.9% 25.2% 0.0% 5.0% 10.0% 15.0% 20.0% 25.0% 30.0% 35.0% 40.0% 2019 2018 2017 2016 Profit Margin Edita Domty Obourland
  • 19. Quick Ratio 2019 2018 2017 2016 Edita 1.08 0.73 0.33 0.63 Domty 0.95 0.93 0.91 0.82 Obourland 0.71 0.88 0.62 0.53 0 0.2 0.4 0.6 0.8 1 1.2 2019 2018 2017 2016 Quick Ratio Edita Domty Obourland
  • 20. Price Earnings (P/E) 2019 2018 2017 2016 Edita 26.26 30.43 53.85 63.09 Domty 16.14 17.23 45.89 71.92 Obourland 6.98 6.46 8.90 -- 0.00 10.00 20.00 30.00 40.00 50.00 60.00 70.00 80.00 2019 2018 2017 2016 Price Earnings (P/E) Edita Domty Obourland
  • 21. Debt to Equity 2019 2018 2017 2016 Edita 108.68% 95.71% 120.23% 115.81% Domty 92.37% 107.06% 144.18% 190.97% Obourland 15.94% 32.03% 40.37% 84.22% 0.00% 50.00% 100.00% 150.00% 200.00% 250.00% 2019 2018 2017 2016 Debt to Equity Edita Domty Obourland
  • 22. Revenue Growth 2019 2018 2017 2016 Edita 6.6% 24.1% 21.6% 12.5% Domty 21.6% 32.4% 14.9% 3.0% Obourland 7.66% 16.33% 42.5% 24.0% 0.0% 5.0% 10.0% 15.0% 20.0% 25.0% 30.0% 35.0% 40.0% 45.0% 2019 2018 2017 2016 Revenue Growth Edita Domty Obourland
  • 23. Exemplary show case Break-Even Analysis Product Name Date : For the Period: Jan.1, 2021 - Dec.31, 2021 Selling Price (P): $ 34,590 Break-Even Units (X): 165 Units Break-Even Sales (S): $ 5,707,350 Fixed Costs Advertising $ 3,500,000 Depreciation $ 35,900 Manufacturing $ 50,000 Payroll $ 1,300 Total Fixed Costs (TFC) $ 3,587,200 Variable Costs Variable Costs based Amount per Unit Cost of Goods Sold $ 3,400 per unit Direct Labor $ 7,500 per unit Overhead $ 10 per unit Sum: $ 10,910 Variable Costs Based on Percentage Commissions 4.60% per unit Other (Specify) 1.00% per unit Sum: 5.60% Total Variable Cost per Unit (V) $ 12,847 Contribution Margin per unit (CM) = P - V $ 21,743 Contribution Margin Ration (CMR) = 1 - V/P = cm / P 62.86% Break - Even Point Break - Even Units (X) X = TFC / (P-V) 165 Break - Even Units (S) S = X * P = TFC / CMR $ 5,707,350
  • 24. Reducing the Amount of Fixed Cost Reducing the Variable Cost Per Unit Increase Selling Price
  • 25. Break-Even Analysis Product Name Date : For the Period: Jan.1, 2020- Dec.31, 2020 Selling Price (P): $ 34,590 Break-Even Units (X): 156 Units Break-Even Sales (S): $ 5,396,040 Fixed Costs Advertising $ 3,500,000 Depreciation $ 35,900 Manufacturing $ 50,000 Payroll $ 1,300 Total Fixed Costs (TFC) $ 3,587,200 Variable Costs Variable Costs based Amount per Unit Cost of Goods Sold $ 3,060 per unit Direct Labor $ 6,750 per unit Overhead $ 10 per unit Sum: $ 9,820 Variable Costs Based on Percentage Commissions 4.00% per unit Other (Specify) 1.00% per unit Sum: 5.00% Total Variable Cost per Unit (V) $ 11,550 Contribution Margin per unit (CM) = P – V $ 23,041 Contribution Margin Ration (CMR) = 1 - V/P = cm / P 66.61% Break - Even Point Break - Even Units (X) X = TFC / (P-V) 156 Break - Even Units (S) S = X * P = TFC / CMR $ 5,396,040
  • 26. Investing Activities Cost Structure For Bakery & Rusk Financing Growth